거래 로봇을 무료로 다운로드 하는 법을 시청해보세요
당사를 Facebook에서 찾아주십시오!
당사 팬 페이지에 가입하십시오
당사 팬 페이지에 가입하십시오
스크립트가 마음에 드시나요? MetaTrader 5 터미널에서 시도해보십시오
- 게시자:
- Nikolay Kositsin
- 조회수:
- 56
- 평가:
- 게시됨:
-
이 코드를 기반으로 한 로봇이나 지표가 필요하신가요? 프리랜스로 주문하세요 프리랜스로 이동
실제 작성자:
faa1947
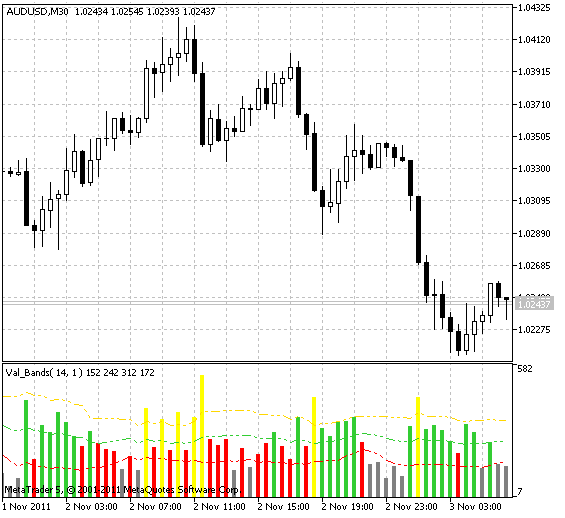
캔들 길이 변동성 지표입니다:
- 히스토그램은 핍 단위의 캔들 길이입니다;
- 선: 표준 편차가 있는 캔들 길이의 평균입니다;
- 설정 - 볼린저 채널과 유사합니다.
사용법:
시장의 갭을 추적할 때 편리합니다. 노란색 선(히스토그램의 노란색 막대) 위의 모든 것은 갭으로 간주되며 상한선을 넘어선 출구로 간주됩니다.
- 테이크프로핏(포지션에 있는 경우);
- 스톱로스(포지션에 반대하는 경우);
- 이 시점에서 진입 금지;
- 하한선(히스토그램의 회색 막대)을 넘어 출구 - 평평함
- 하한선을 아래에서 위로 교차(히스토그램의 빨간색 막대) - 추세의 시작.
이 지표는 MQL4에서 처음 구현되었으며 2010.08. 19에 mql4.com의 코드 베이스에 게시되었습니다.

MetaQuotes Ltd에서 러시아어로 번역함.
원본 코드: https://www.mql5.com/ru/code/687
 IncRVIOnArray
CRVIOnArray 클래스는 인디케이터 버퍼에 의해 RVI(상대 활력 지수) 인디케이터의 값을 계산하도록 설계되었습니다. 이 클래스를 사용하는 예로 Test_RVIOnArray 인디케이터가 나와 있습니다.
 IncCHOOnArray
CCHOOnArray 클래스는 인디케이터 버퍼를 사용해 차이킨 오실레이터(CHO)를 계산하도록 설계되었습니다. 이 클래스 사용의 예로 Test_CHOOnArray 인디케이터가 제공됩니다.
 Find Swing Highs Swing Lows
메타트레이더 5용 스윙 고점/저점 식별기는 차트에 직접 색상 화살표로 주요 스윙 고점과 스윙 저점을 표시합니다. 이 도구는 트레이더가 저항 및 지지 역할을 할 수 있는 주요 가격 수준을 빠르게 식별하는 데 도움이 되며 추세 반전 분석, 지지 및 저항 매핑, 가격 행동 전략 향상에 이상적입니다. 이러한 중요한 스윙 포인트를 강조 표시하여 정보에 입각한 트레이딩 결정을 내리고 트레이딩 전략을 최적화하는 데 유용한 인사이트를 제공합니다.
 Decision Colored Candles - MT5
거래에 대한 높은 자신감