Diamond by MMD MT5
- インディケータ
- バージョン: 7.33
- アップデート済み: 26 4月 2023
- アクティベーション: 5
MMDによるダイヤモンド
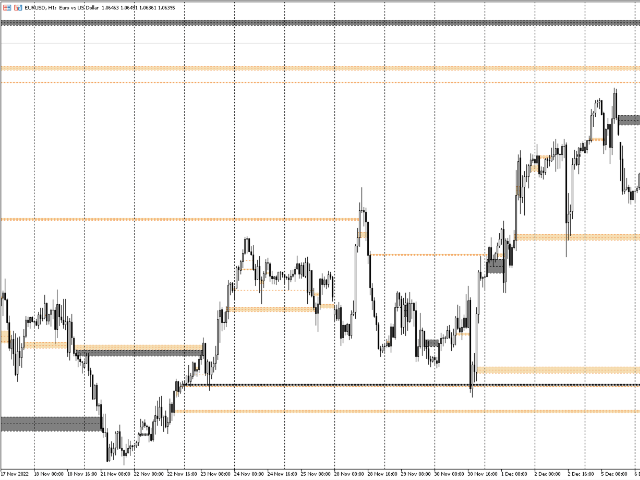
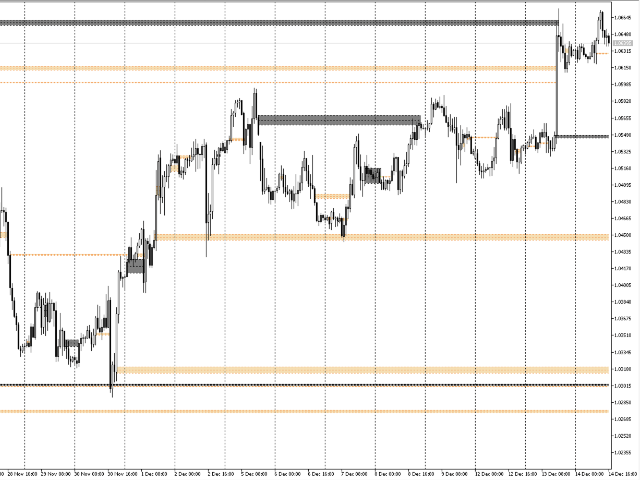
Diamond by MMD は、価格動向にとって重要な場所を特定する高度な指標です。
このインジケーターは、任意の時間枠で、チャート上の価格反応ゾーンを検出してマークします。
ダイヤモンド - MMD 方法論の知識ピラミッドの要素の 1 つ - は、非常に厳しい条件を満たすキャンドルです。
ダイヤモンドには主に 2 つのタイプがあります。
- 標準ダイヤモンド
- 逆認知症。
これらのモデルはどちらも自動的に識別され、チャート上でマークされます。
インジケータは、たとえば H1 間隔の M5 間隔から、ダイヤモンドをマークできます。 インジケーターのデフォルト設定では、現在チャートを開いている時間枠にひし形が表示されます。
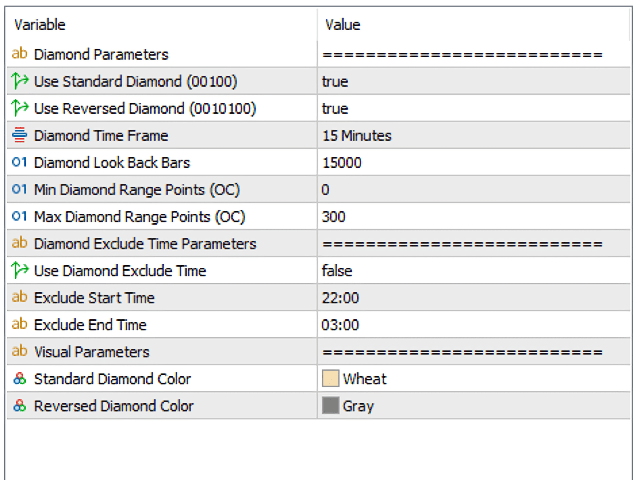
指標パラメータの説明。
標準ダイヤモンドを使用 - モデル 00100 のダイヤモンドを表示/非表示にします
逆ひし形を使用 - モデル 0010100 のひし形を表示/非表示にします
ダイヤモンドの時間枠 - ダイヤモンドを表示する間隔を指定できるオプション。 たとえば、M1 または H1 ローソク足でチャートの M5 間隔のダイヤモンドを表示することができます。
ダイヤモンド ルックバック バー - 特定の間隔で - スキャンされるローソクの数を指定して、ダイヤモンドに選択されたパラメータを満たすローソクを探します。
最小ダイヤモンド レンジ ポイント - 最小ダイヤモンド サイズ (ポイント単位)。
Max Diamond Range Points - ダイヤモンドの最大サイズ (ポイント単位)。
ダイヤモンド除外時間を使用 - パラメータの有効化/無効化。 このパラメーターは、ダイヤモンドに設定された条件を満たすローソク足がチャート上でマークされない時間を決定する役割を果たします。 これは特に夜間に当てはまります。
除外開始時間 - ダイヤモンドがマークされない期間の開始を示します。
除外終了時間 - ダイヤモンドがマークされない期間の終了を示します。
標準ダイヤモンド カラー - 標準ダイヤモンドの色。
逆ダイヤモンドの色 - 逆ダイヤモンドの色。