Diamond by MMD MT5
- Indicadores
- Versão: 7.33
- Atualizado: 26 abril 2023
- Ativações: 5
Diamante por MMD
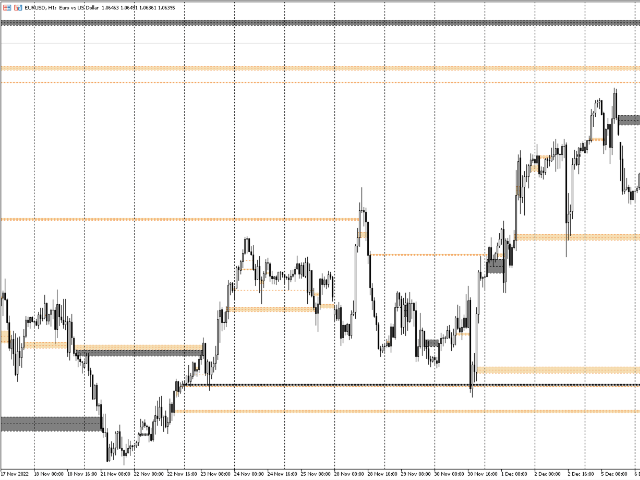
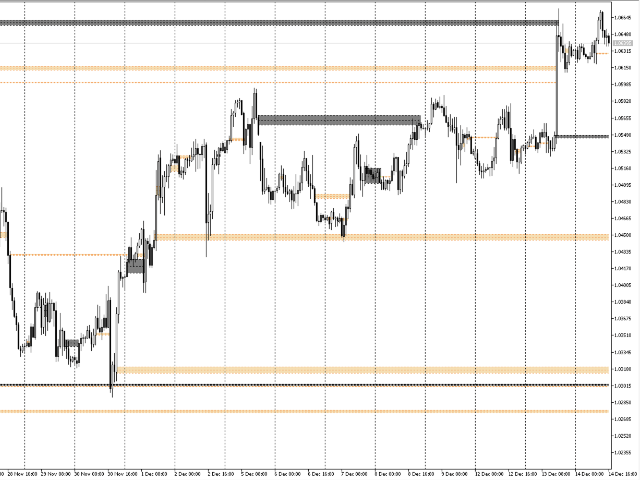
Diamond by MMD é um indicador avançado que identifica locais importantes para o comportamento dos preços.
Este indicador - em qualquer período de tempo - detecta e marca as zonas de reação do preço no gráfico.
Os diamantes - um dos elementos da pirâmide do conhecimento na metodologia MMD - são velas que atendem a condições muito rígidas.
Existem dois tipos principais de diamantes:
- diamante padrão
- demência reversa.
Ambos os modelos são automaticamente identificados e marcados no gráfico.
O indicador pode marcar diamantes, por exemplo, do intervalo M5 no intervalo H1. A configuração padrão do indicador mostra diamantes no período em que você tem o gráfico aberto no momento.
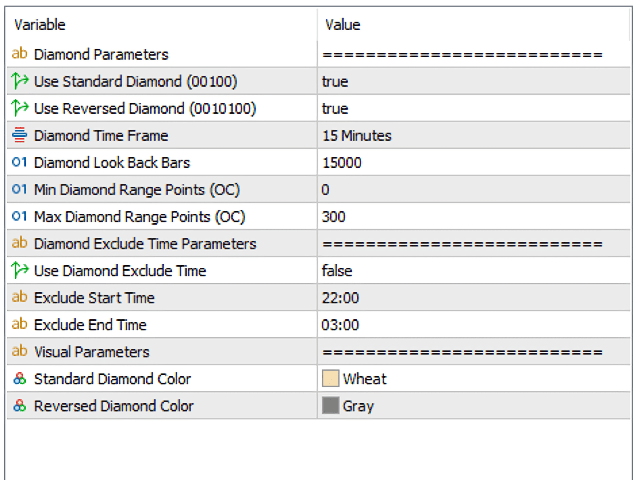
Descrição dos parâmetros do indicador.
Use Standard Diamond - mostra/oculta diamantes no modelo 00100
Usar diamante invertido - mostra/oculta diamantes no modelo 0010100
Diamond Time Frame - uma opção que permite indicar o intervalo a partir do qual os diamantes devem ser mostrados. É possível mostrar, por exemplo, diamantes do intervalo M5 no gráfico com velas M1 ou H1.
Diamond Look Back Bars - especificando o número de velas - em um determinado intervalo - que serão escaneadas - em busca de velas que atendam aos parâmetros selecionados para diamantes.
Min Diamond Range Points - tamanho mínimo do diamante (em pontos).
Max Diamond Range Points - tamanho máximo do diamante (em pontos).
Use Diamond Exclude Time - ativação/desativação do parâmetro. Este parâmetro é responsável por determinar o tempo em que as velas que atendem às condições definidas para os diamantes não serão marcadas no gráfico. Isso se aplica especialmente às horas noturnas.
Excluir Hora de Início - indicação do início do período em que os diamantes não serão marcados.
Excluir Hora Fim - indicação do fim do período em que os diamantes não serão marcados.
Cor Padrão do Diamante - a cor do diamante padrão.
Cor do Diamante Invertida - a cor do diamante invertido.