Diamond by MMD MT5
- Indicatori
- Versione: 7.33
- Aggiornato: 26 aprile 2023
- Attivazioni: 5
Diamante di MMD
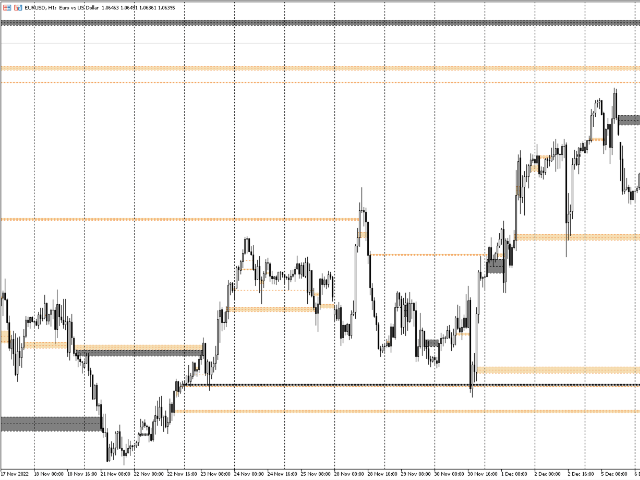
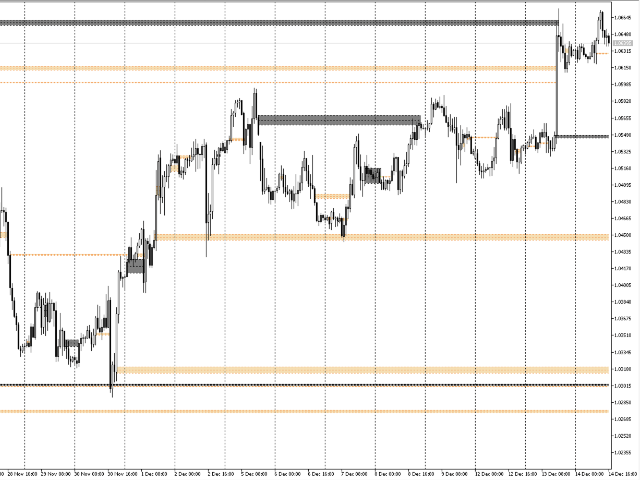
Diamond by MMD è un indicatore avanzato che identifica i luoghi importanti per il comportamento dei prezzi.
Questo indicatore, in qualsiasi periodo di tempo, rileva e contrassegna le zone di reazione dei prezzi sul grafico.
I diamanti - uno degli elementi della piramide della conoscenza nella metodologia MMD - sono candele che soddisfano condizioni molto rigorose.
Esistono due tipi principali di diamanti:
- diamante standard
- demenza invertita.
Entrambi questi modelli vengono automaticamente identificati e contrassegnati sul grafico.
L'indicatore può contrassegnare i diamanti, ad esempio dall'intervallo M5 sull'intervallo H1. L'impostazione predefinita dell'indicatore mostra i diamanti nel periodo di tempo in cui il tuo grafico è attualmente aperto.
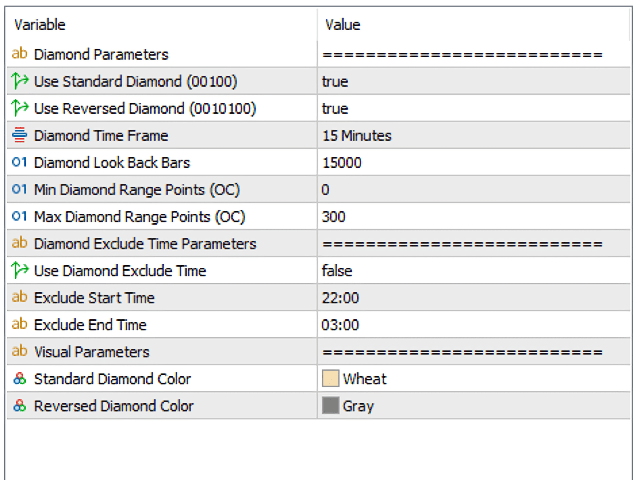
Descrizione dei parametri dell'indicatore.
Usa diamante standard: mostra/nasconde i diamanti nel modello 00100
Usa diamante rovesciato: mostra/nasconde i diamanti nel modello 0010100
Diamond Time Frame - un'opzione che consente di indicare l'intervallo da cui devono essere visualizzati i diamanti. È possibile mostrare, ad esempio, i diamanti dell'intervallo M5 sul grafico con candele M1 o H1.
Diamond Look Back Bars - specificando il numero di candele - su un determinato intervallo - che verranno scansionate - alla ricerca di candele che soddisfano i parametri selezionati per i diamanti.
Min Diamond Range Points - dimensione minima del diamante (in punti).
Max Diamond Range Points - dimensione massima del diamante (in punti).
Use Diamond Exclude Time - attivazione/disattivazione del parametro. Questo parametro è responsabile della determinazione del momento in cui le candele che soddisfano le condizioni stabilite per i diamanti non verranno contrassegnate sul grafico. Ciò vale in particolare per le ore notturne.
Escludi ora di inizio - indicazione dell'inizio del periodo in cui i diamanti non saranno contrassegnati.
Escludi ora di fine - indicazione della fine del periodo in cui i diamanti non saranno contrassegnati.
Standard Diamond Color - il colore del diamante standard.
Colore diamante invertito - il colore del diamante invertito.