Diamond by MMD MT5
- 지표
- 버전: 7.33
- 업데이트됨: 26 4월 2023
- 활성화: 5
MMD의 다이아몬드
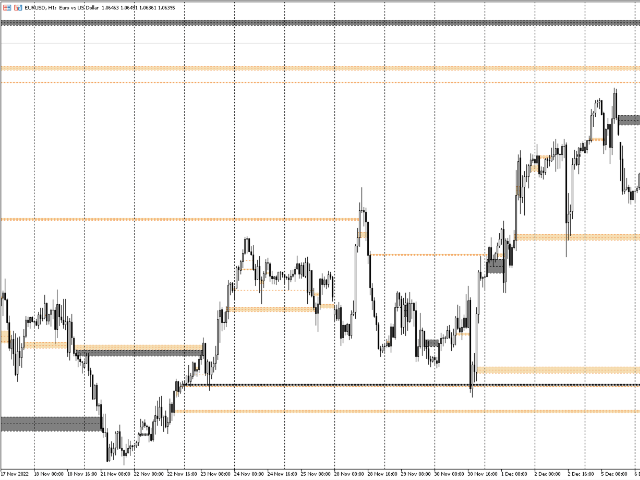
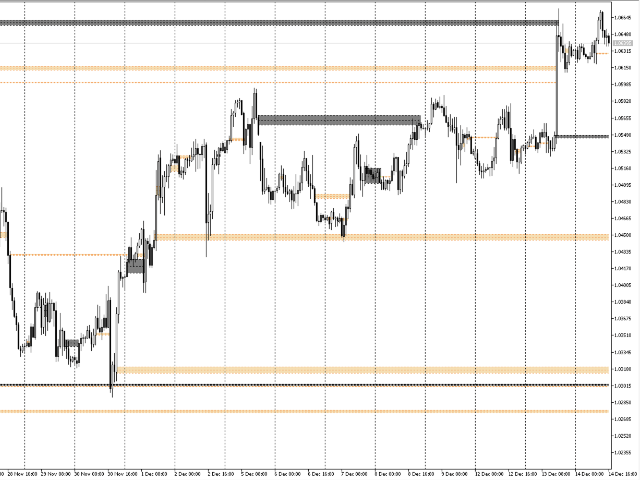
Diamond by MMD는 가격 행동에 중요한 장소를 식별하는 고급 지표입니다.
이 표시기는 모든 시간대에서 차트의 가격 반응 영역을 감지하고 표시합니다.
MMD 방법론에서 지식 피라미드의 요소 중 하나인 다이아몬드는 매우 엄격한 조건을 충족하는 양초입니다.
다이아몬드에는 두 가지 주요 유형이 있습니다.
- 표준 다이아몬드
- 역 치매.
이 두 모델은 자동으로 식별되어 차트에 표시됩니다.
지표는 예를 들어 H1 간격의 M5 간격에서 다이아몬드를 표시할 수 있습니다. 지표의 기본 설정은 현재 차트가 열려 있는 기간에 다이아몬드를 표시합니다.
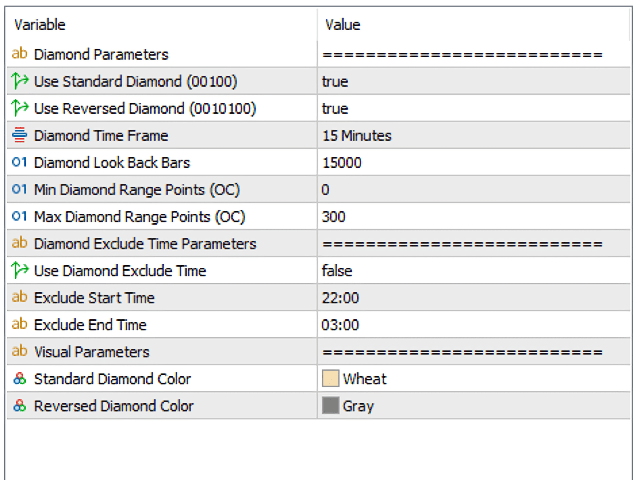
표시기 매개변수에 대한 설명입니다.
표준 다이아몬드 사용 - 모델 00100에서 다이아몬드를 표시하거나 숨깁니다.
반전된 다이아몬드 사용 - 모델 0010100에서 다이아몬드를 표시하거나 숨깁니다.
다이아몬드 시간 프레임 - 다이아몬드가 표시되는 간격을 지정할 수 있는 옵션입니다. 예를 들어 M1 또는 H1 캔들로 차트에 M5 간격의 다이아몬드를 표시할 수 있습니다.
다이아몬드 룩백 바 - 다이아몬드에 대해 선택된 매개변수를 충족하는 양초를 찾기 위해 스캔할 양초의 수를 지정합니다.
최소 다이아몬드 범위 포인트 - 최소 다이아몬드 크기(포인트).
최대 다이아몬드 범위 포인트 - 최대 다이아몬드 크기(포인트).
다이아몬드 제외 시간 사용 - 매개변수 활성화/비활성화. 이 매개변수는 다이아몬드에 대해 설정된 조건을 충족하는 양초가 차트에 표시되지 않는 시간을 결정하는 역할을 합니다. 이것은 특히 야간 시간에 적용됩니다.
제외 시작 시간 - 다이아몬드가 표시되지 않는 기간의 시작을 나타냅니다.
제외 종료 시간 - 다이아몬드에 마킹되지 않는 기간의 종료를 나타냅니다.
표준 다이아몬드 색상 - 표준 다이아몬드의 색상입니다.
반전 다이아몬드 색상 - 반전 다이아몬드의 색상입니다.