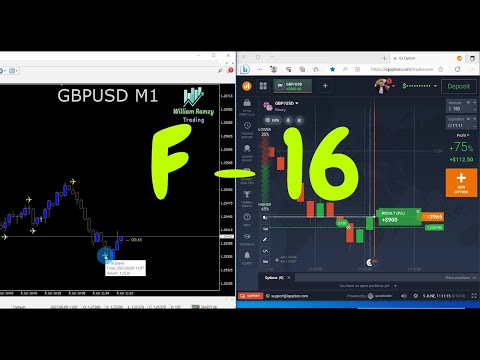
F 16 Plane Indicator

F-16 Plane Indicatorをご紹介します。これは、取引体験を革新するために設計された最先端のMT4ツールです。F-16戦闘機の無類のスピードと精度に触発され、このインジケーターは高度なアルゴリズムと最新技術を組み合わせ、金融市場で比類のないパフォーマンスを提供します。

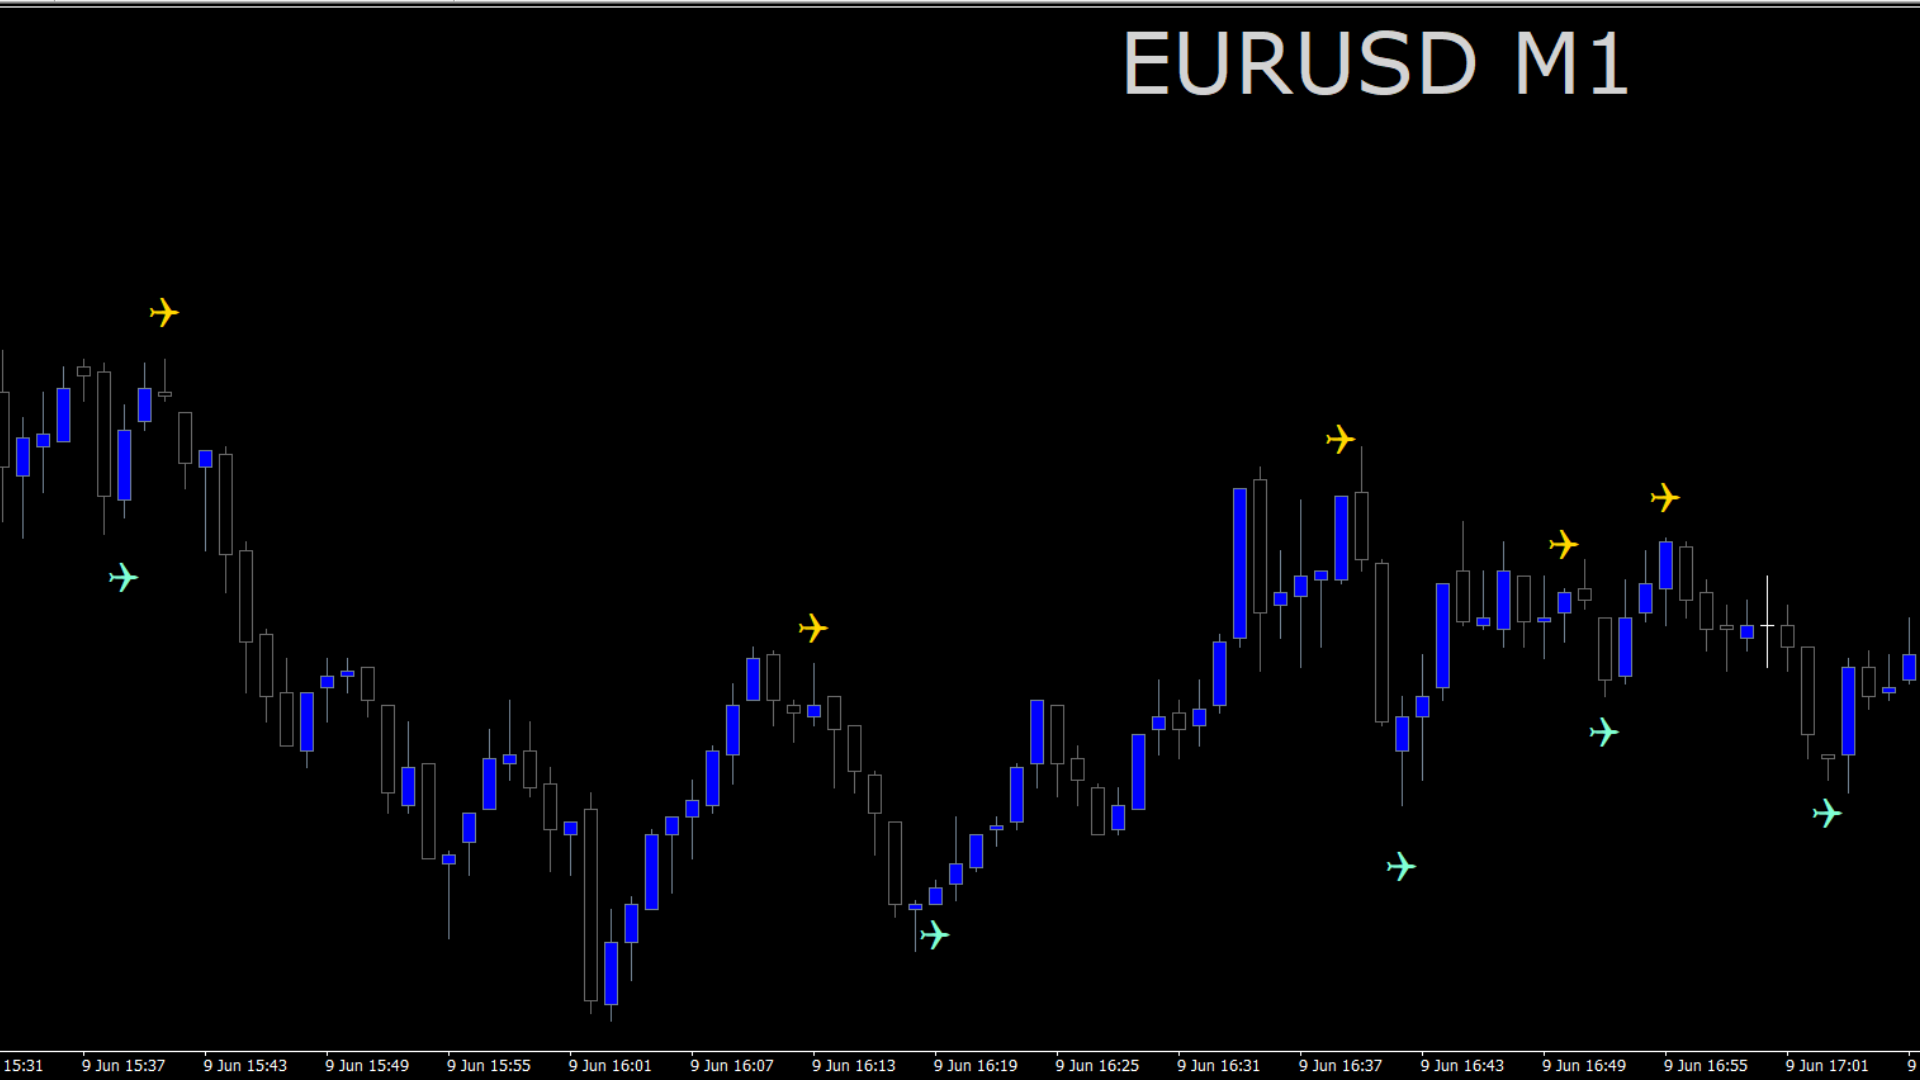
F-16 Plane Indicatorを使用すると、リアルタイムの分析と高精度な取引シグナルの生成が可能で、競争相手を圧倒します。ダイナミックな機能により、さまざまな資産クラスで利益を見つけることができ、自信を持って的確な決定を行うことができます。

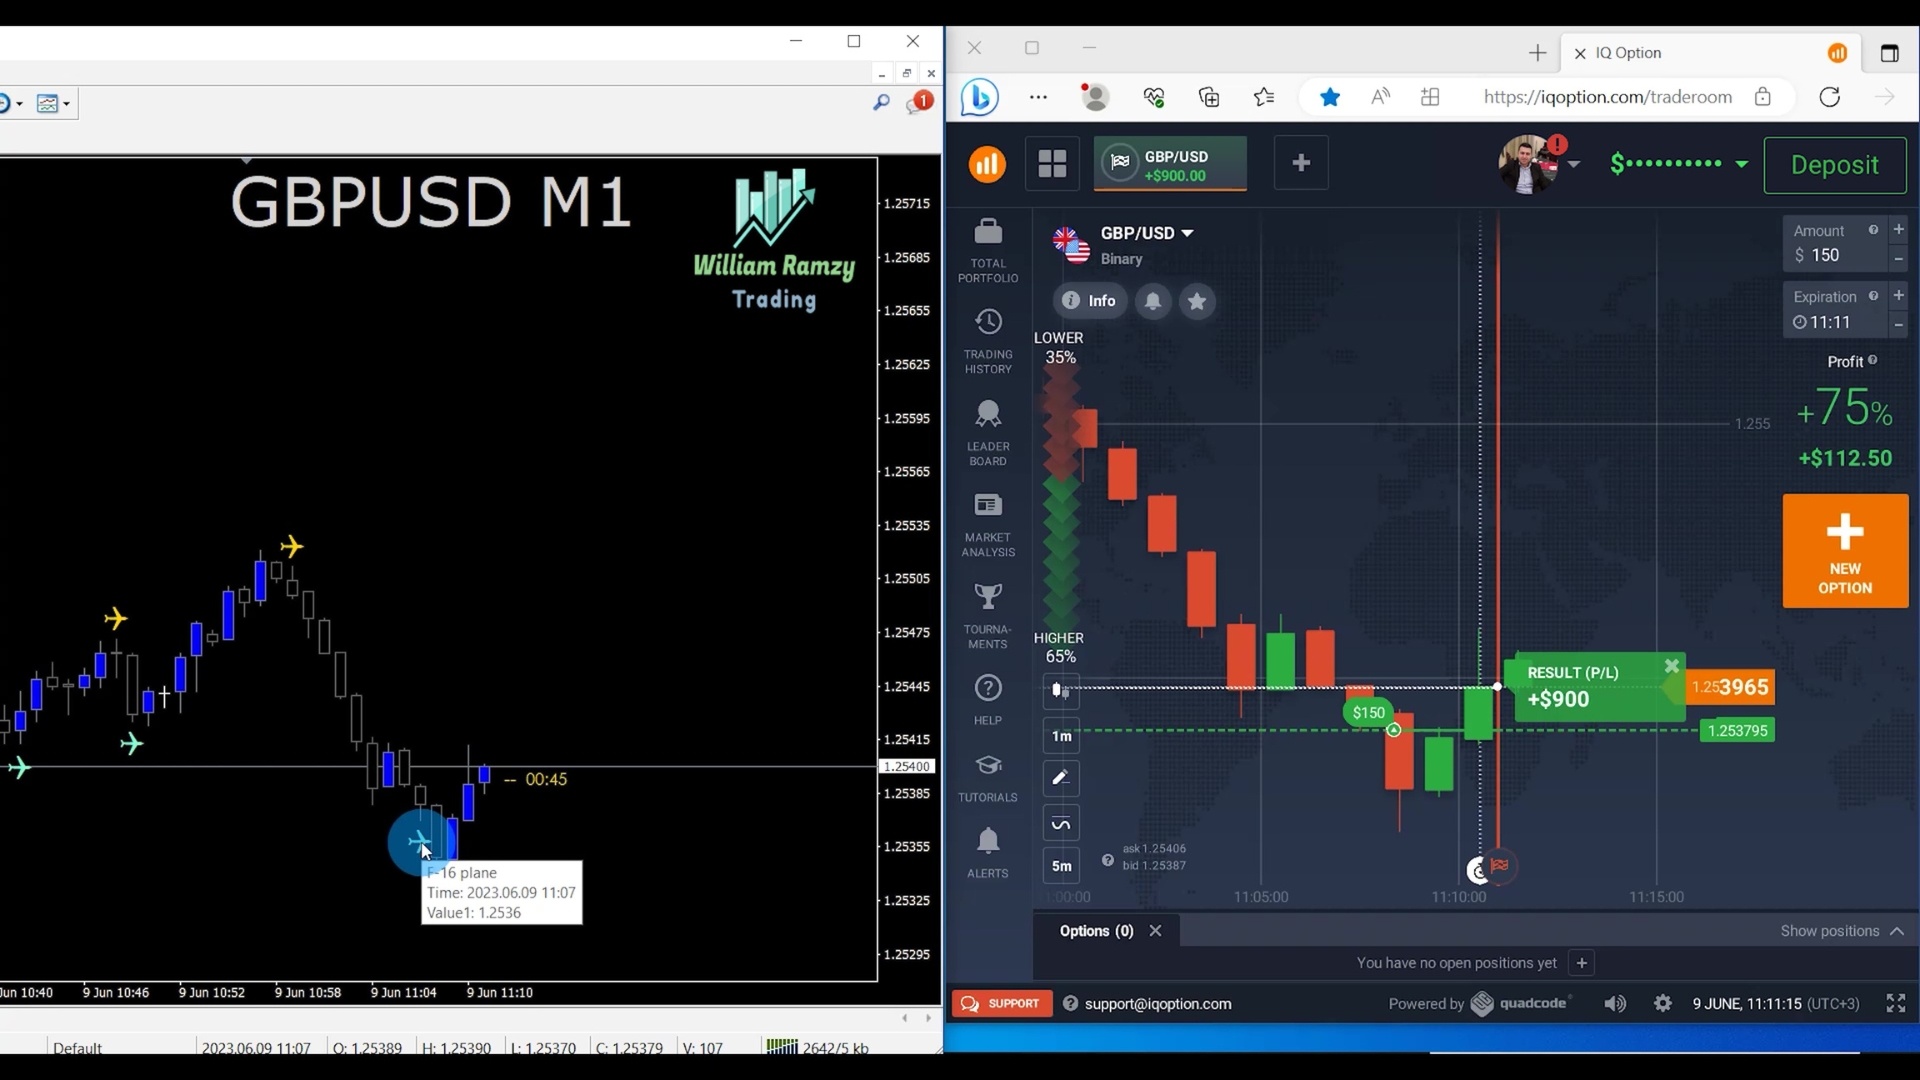
使いやすいインターフェースを備えたF-16 Plane Indicatorは、人気のあるMetaTrader 4プラットフォームとシームレスに統合され、スムーズで効率的な取引プロセスを実現します。初心者のトレーダーでも経験豊富なプロフェッショナルでも、このインジケーターは独自の取引スタイルと好みに合わせて簡単にカスタマイズすることができます。

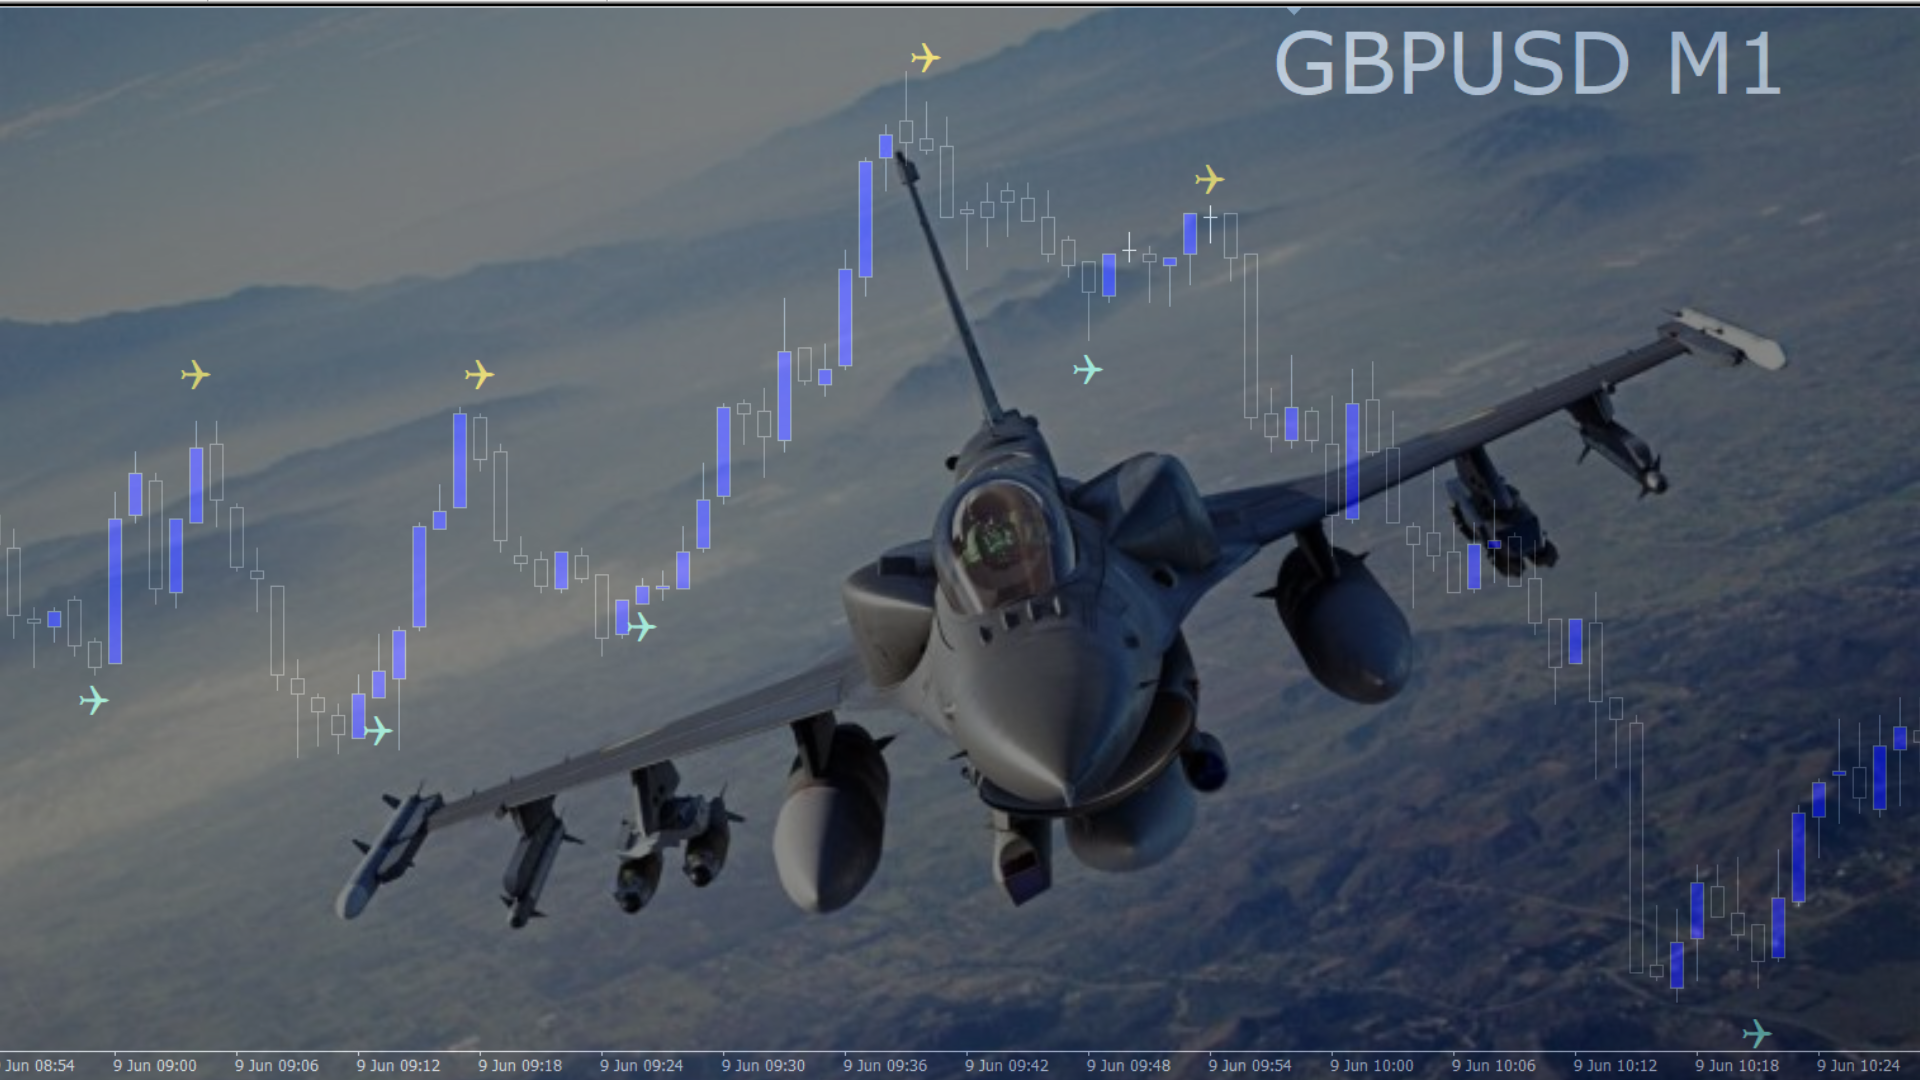
F-16 Plane Indicatorのパワーを体感し、市場のトレンドを精密かつ敏捷にナビゲートします。高度なチャート機能により、最適なタイミングのための主要なエントリーポイントや出口ポイントを検出し、常に先を見越すことができます。F-16 Plane Indicatorを使ってトレードの旅を制御し、一貫した利益を得る可能性を解き放ちましょう。

この優れたMT4インジケーターと共に、離陸の準備をし、トレードパフォーマンスを新たな高みに引き上げましょう。F-16 Plane Indicatorは、金融市場の世界での究極の共同パイロットです。速さ、正確さ、自信を持って成功を収める力を与えてくれます。


おすすめのプロダクト
Owl smart levels
Sergey Ermolov
4.24 (37)
MT5版  |   FAQ Owl Smart Levels Indicator   は、 Bill Williams   の高度なフラクタル、市場の正しい波構造を構築する Valable ZigZag、エントリの正確なレベルをマークする Fibonacci レベルなどの一般的な市場分析ツールを含む 1 つのインジケーター内の完全な取引システムです。 利益を得るために市場と場所に。 戦略の詳細な説明 インジケータを操作するための指示 顧問-取引助手 プライベートユーザーチャット ->購入後に私に書いて、私はプライベートチャットにあなたを追加し、あなたはそこにすべてのボーナスをダウンロードすることができます 力はシンプルさにあります! Owl Smart Levels   取引システムは非常に使いやすいので、専門家にも、市場を勉強し始めて自分で取引戦略を選択し始めたばかりの人にも適しています。 戦略と指標に秘密の数式や計算方法が隠されているわけではなく、すべての戦略指標は公開されています。 Owl Smart Levels を使用すると、取引を開始するためのシグナルをすばやく確認し、注
VR Cub
Vladimir Pastushak
VR Cub は、質の高いエントリーポイントを獲得するためのインジケーターです。このインジケーターは、数学的計算を容易にし、ポジションへのエントリーポイントの検索を簡素化するために開発されました。このインジケーターが作成されたトレーディング戦略は、長年にわたってその有効性が証明されてきました。取引戦略のシンプルさはその大きな利点であり、初心者のトレーダーでもうまく取引することができます。 VR Cub はポジション開始ポイントとテイクプロフィットとストップロスのターゲットレベルを計算し、効率と使いやすさを大幅に向上させます。取引の簡単なルールを理解するには、以下の戦略を使用した取引のスクリーンショットを見てください。 設定、設定ファイル、デモ版、説明書、問題解決方法は、以下から入手できます。 [ブログ] レビューを読んだり書いたりすることができます。 [リンク] のバージョン [MetaTrader 5] エントリーポイントの計算ルール ポジションをオープンする エントリーポイントを計算するには、VR Cub ツールを最後の高値から最後の安値までストレッチする必要があります。 最初
Shark Deal Book
Philip Pankaj Suthagar
4 (3)
Term  "shark"  in the business world denotes a high volume investor who just made a good investment in a highly Potential business deal.So, sharks are the ones who make the market move. In our case, if an American shark bought a Japanese company, he/she has to convert American dollars into Japanese yen to make the deal. So, the demand for the Japanese yen will increase sharply. Thus USD/JPY will go short rapidly if the deal was from the shark. Another example, In the case of forex, if fed increa
The Stepping Trend Indicator     The Steppi ng Trend indicator uses the  average true range  (ATR indicator) in its calculation. This gives you control to set your own average true range period, I set the Default as 10.   Indicator Details. Green Arrow Up: This means you are at the starting point of a new bullish trend, it’s time to buy.   Red  Arrow  Down : This means you are at the starting point of a new  bearish  trend, it’ s time to sell .   What if you miss the Arrow Signal?   No prob
Was: $249  Now: $99   Market Profile defines a number of day types that can help the trader to determine market behaviour. A key feature is the Value Area, representing the range of price action where 70% of trading took place. Understanding the Value Area can give traders valuable insight into market direction and establish the higher odds trade. It is an excellent addition to any system you may be using. Blahtech Limited presents their Market Profile indicator for the MetaTrader community. Ins
Indicator Description GOLD TITAN KING SIGNAL INDICATOR High-Precision Gold Scalping Buy/Sell Signals – Manual Trading Assistant Overview The Gold Titan King Signal Indicator is a manual trading assistant tool designed for high-frequency scalping on Gold (XAUUSD) and other major pairs. It generates clear BUY/SELL signals with precise entry levels, along with adjustable Stop Loss and Take Profit levels displayed directly on the chart. ️ This tool is NOT an EA. It does not execute trades
"The trend is your friend" is one of the best known sayings in investing, because capturing large trendy price movements can be extremely profitable. However, trading with the trend is often easier said than done, because many indicators are based on price reversals not trends. These aren't very effective at identifying trendy periods, or predicting whether trends will continue. We developed the Trendiness Index to help address this problem by indicating the strength and direction of price trend
SMC Venom Model BPR インジケーターは、スマート マネー (SMC) コンセプトで取引するトレーダー向けのプロフェッショナル ツールです。価格チャート上の 2 つの主要なパターンを自動的に識別します。 FVG   (フェアバリューギャップ) は、3 本のローソク足の組み合わせで、最初のローソク足と 3 番目のローソク足の間にギャップがあります。ボリュームサポートのないレベル間のゾーンを形成し、価格修正につながることがよくあります。 BPR   (バランス価格範囲) は、2 つの FVG パターンの組み合わせで、「ブリッジ」を形成します。これは、価格がボリュームアクティビティの少ない動きで動くときに、ブレイクアウトしてレベルに戻るゾーンで、ローソク足の間にギャップを作成します。 これらのパターンは、大規模な市場プレーヤーと一般参加者の相互作用が発生するチャート上のボリュームと価格動向の分析に基づいて、トレーダーが主要なサポート/レジスタンス レベル、ブレイクアウト ゾーン、エントリ ポイントを識別するのに役立ちます。 インジケーターは、長方形と矢印の形でパターンを視
Super Reversal Pattern Indicator Unlock the power of advanced pattern recognition with our Super Reversal Pattern Indicator. Designed for traders seeking precision and reliability, this indicator identifies one of the most effective reversal patterns in technical analysis, offering a significant edge in your trading strategy. Key Features: Non-Repainting Accuracy: Enjoy the confidence of non-repainting technology. Once a Super Reversal Pattern is detected, it remains static, providing consiste
The indicator shows the potential trend direction by cyclical-wave dependence. Thus, all the rays of the intersection will be optimal rays, in the direction of which the price is expected to move, taking into account the indicator period. Rays can be used as a direction for potential market movement. But we must not forget that the approach must be comprehensive, the indicator signals require additional information to enter the market.
Power Renko is an indicator which plots Renko bricks underneath the chart using a histogram. You can select the brick size and the timeframe of the Renko bricks as well as whether or not to use the close price or the high/low price of the candles. Renko bricks are based on price alone, not time, therefor the Renko bricks will not be aligned with the chart's time. They are extremely useful for trend trading and many different strategies can be formed from them. Buffers are provided allowing you t
This is a trend indicator without redrawing Developed instead of the binary options strategy (by the color of the Martingale candlestick) Also works well in forex trading When to open trades (binary options) A signal will appear in the place with a candle signaling the current candle It is recommended to open a deal for one candle of the current timeframe M1 and M5 When a blue dot appears, open a deal up When a red dot appears, open a trade down. How to open trades on Forex. When a signal is rec
「Auto FIBO Pro」Crypto_Forex インジケーターは、取引の補助ツールとして最適です。 - インジケーターは、フィボナッチ レベルとローカル トレンド ライン (赤色) を自動的に計算してチャート上に配置します。 - フィボナッチ レベルは、価格が反転する可能性のある重要な領域を示します。 - 最も重要なレベルは、23.6%、38.2%、50%、61.8% です。 - リバーサル スキャルピングやゾーン グリッド取引に使用できます。 - Auto FIBO Pro インジケーターを使用して、現在のシステムを改善する機会も多数あります。 - Info Spread Swap Display があり、接続されている外国為替ペアの現在のスプレッドとスワップを表示します。 - ディスプレイには、アカウントの残高、エクイティ、マージンも表示されます。 - Info Spread Swap Display は、チャートのどのコーナーにも配置できます。 0 - 左上コーナー、1 - 右上、2 - 左下、3 - 右下。 高品質のトレーディングロボットとインジケーターをご覧にな
Alpha Trend signは私たちの取引システムを検証し、取引信号を明確に提示し、信号がドリフトすることはありません。 主な機能: •市場が活況を示している地域に応じて、指標に基づいて現在の相場がトレンド相場に属しているか、それとも揺れ相場に属しているかを直感的に判断することができる。 そして、指標の指示矢印に基づいて市場に切り込み、緑の矢印は購入を提示し、赤の矢印は販売を提示する。 •小周期変動による頻繁な取引信号の発生を回避するために、5分以上の時間周期で取引を行うことを推奨します。 •最適な取引タイミングを逃さないために、シグナルプロンプトをオンにすることもできます。 •本指標はトレンド相場をよく予測するだけでなく、幅広振動相場でも利益を得ることができる。 •本指標は大道至簡の原則に基づいており、異なる段階のトレーダーが使用するのに適している。 注意事項: •Alpha Trend signには明確な入退場信号があり、損失を与えないように逆位相操作を提案しない。 •Alpha Trend signは特に成熟した指標であり、デルのチー
PipFinite Trend PRO
Karlo Wilson Vendiola
4.88 (2248)
Breakthrough Solution For Trend Trading And Filtering With All Important Features Built Inside One Tool! Trend PRO's smart algorithm detects the trend, filters out market noise and gives entry signals with exit levels. The new features with enhanced rules for statistical calculation improved the overall performance of this indicator. Important Information Revealed Maximize the potential of Trend Pro, please visit www.mql5.com/en/blogs/post/713938 The Powerful Expert Advisor Version Automatin
THIS IS A NEW PRODUCT RELEASE -  RENT FOR 1 MONTH FOR JUST $49.99: OFFER EXTENDS UNTIL THE END OF JANUARY 2026.   STRATEGY TESTER HAS LIMITED FUNCTIONS AND DOES NOT BEHAVE EXACTLY AS THE INDICATOR WOULD ON A DEMO. Transform Your Trading with Advanced Multi-Timeframe MACD Analysis The Continuation and Reversal Indicator is a sophisticated technical analysis tool that revolutionizes how you interpret MACD signals by analyzing multiple timeframes simultaneously. This professional-grade indicator p
Forex Gump
Andrey Kozak
2.4 (5)
Forex Gump is a fully finished semi-automatic trading system. In the form of arrows, signals are displayed on the screen for opening and closing deals. All you need is to follow the instructions of the indicator. When the indicator shows a blue arrow, you need to open a buy order. When the indicator shows a red arrow, you need to open a sell order. Close orders when the indicator draws a yellow cross. In order to get the most effective result, we recommend using the timeframes H1, H4, D1. There
Crypto_Forex インジケーター   PINBAR パターン MT4用。リペイントなし、遅延なし。 - インジケーター「PINBARパターン」は、プライスアクション取引に非常に強力なインジケーターです。 - インジケーターはチャート上のピンバーを検出します。 - 強気のピンバー - チャート上に青い矢印シグナルを表示します(画像参照)。 - 弱気のピンバー - チャート上に赤い矢印シグナルを表示します(画像参照)。 - PC、モバイル、メールアラート機能付き。 - インジケーター「PINBARパターン」は、サポート/レジスタンスレベルと組み合わせるのに最適です。 高品質のトレーディングロボットとインジケーターをご覧になるにはここをクリックしてください! これは、このMQL5ウェブサイトでのみ提供されるオリジナル製品です。
The Th3Eng PipFinite indicator is based on a very excellent analysis of the right trend direction with perfect custom algorithms. It show the true direction and the best point to start trading. With StopLoss point and Three Take Profit points. Also it show the right pivot of the price and small points to order to replace the dynamic support and resistance channel, Which surrounds the price. And Finally it draws a very helpful Box on the left side on the chart includes (take profits and Stop loss
The indicator shows which trading pairs, strategies, robots and signals that you use are profitable and which are not. The statistic of trades and balance graph are displayed in the account currency and pips - to switch simply click on the graph. button "$"(top left) - minimize/expand and move the indicator panel button ">"(bottom right) - stretching and resetting to the original size Statistic of trades 1 line - account balance, current profit and lot of open trades; 2 line - the number of all
Trend PA
Mikhail Nazarenko
5 (3)
The Trend PA indicator uses   Price Action   and its own filtering algorithm to determine the trend. This approach helps to accurately determine entry points and the current trend on any timeframe. The indicator uses its own algorithm for analyzing price changes and Price Action. Which gives you the advantage of recognizing, without delay, a new nascent trend with fewer false positives. Trend filtering conditions can be selected in the settings individually for your trading style. The indicator
Next level of trend trading here. Possibility 75%, the indicator analyzes the current market to determine short (small dot), middle (circle with a dot inside) and long (cross with a circle and a dot inside) trends.  Wingdings characters of  Aqua color represents the beginning of the UP trend. Wingdings characters of  Orange color represents the beginning of the DOWN trend. Possibility 75% Indicator will improve your trading in the world of forex, commodities, cryptocurrencies and indices.
[ZhiBiCCI]インディケータは全てのサイクル使用に適しており、そして全ての市場品種にも適しています。 [ZhiBiCCI]緑色の実線は強気の発散の逆転です。緑色の点線は古典的な強気の発散です。 [ZhiBiCCI]赤への実線は逆弱気の発散である。赤い点線は古典的な弱気の発散です。 [ZhiBiCCI]はパラメータ(アラート、メール送信、通知送信)で設定でき、(true)に設定するとインスタント信号をアラームウィンドウに送信し、Eメール、インスタントメッセージを送信できます。 パラメータ設定の説明 [displayAlert]:これはアラームスイッチで、trueに設定され、矢印が表示されればプロンプトに自動的に警告され、falseに設定されれば警告されません。 [sendmail_NO_OFF]:これはメールを送信するためのスイッチで、trueに設定します。矢印が表示されていればMT4で設定したメールボックスにメールを送信し、falseに設定されていればメールを送信しません。 [sendnotification_NO_OFF]:これはインスタントメッセージを送信するた
Noize Absorption Index - is the manual trading system that measures the difference of pressure between bears forces and bulls forces. Green line - is a noize free index that showing curent situation. Zero value of index shows totally choppy/flat market.Values above zero level shows how powerfull bullish wave is and values below zero measures bearish forces.Up arrow appears on bearish market when it's ready to reverse, dn arrow appears on weak bullish market, as a result of reverse expectation. S
Renko, Heiken Ashi, Ticks Bar, Range Bar.    Easy switching, easy setup, all in one window.        Place the Custom Chart indicator and view Renko, Heiken Ashi, Tick bar, Range bar charts in real time at real chart.    Position the offline chart window so that the indicator control panel is visible.    Switch the chart mode by click of a button.    Connect to the output chart any indicator, expert advisor without any restrictions.    No, it doesn't work in the tester.    Yes, you can use an
For sure, this indicator has become very popular amongst traders. Through coding this indicator will give you the most accurate levels possible for your trading analysis. We have also added in the ability for you to receive alerts when the price breaks above or below a Support or Resistance lines! HOW TO USE The red rectangles represent your resistance/supply zone. The green rectangles represent your support/demand zone.  BONUS FEATURES We coded this indicator with the ability to switch between
Easy Trade Indicator – Your Path to Profitable Trades! Work any Time Frame! Maximize your profits with precise and assertive trades! ️ Trade with comfort – the indicator does the analysis and you only open the order in the direction in which the indicator shows you!  Exclusive panel with past trade counter and accuracy tracking! Simplify your analysis, boost your performance, and trade with confidence! Get it now and take your trading to the next level
PABT Pattern Indicator - it's classical system one of the signal patterns. Indicator logic - the Hi & Lo of the bar is fully within the range of the preceding bar, look to trade them as pullback in trend. In the way if indicator found PABT pattern it's drawing two lines and arrow what showing trend way.  - First line - it's entry point and drawing at: 1. On the high of signal bar or on middle of the signal bar (depending from indicator mode) for buy; 2. On the low of signal bar or on middle of t
QuantumEdge Trader v1.0 AI-Powered Precision Signals for Serious Traders QuantumEdge Trader is a smart and reliable indicator that delivers accurate BUY and SELL signals using advanced market analysis and trend detection. Designed for M1 to M60 timeframes, it's ideal for scalping and intraday strategies. --- Key Features: No Repaint – Signals never change after appearing Smart trend filters to reduce noise Adjustable sensitivity and alerts Perfect for XAUUSD, EURUSD, and m
The main idea of this indicator is rates analysis and prediction by Fourier transform. Indicator decomposes exchange rates into main harmonics and calculates their product in future. You may use the indicator as a standalone product, but for better prediction accuracy there is another related indicator - FreqoMaster - which uses FreqoMeterForecast as a backend engine and combines several instances of FreqoMeterForecast for different frequency bands. Parameters: iPeriod - number of bars in the ma
このプロダクトを購入した人は以下も購入しています
Miraculous Indicator – ガン・スクエア・オブ・ナインに基づく100%非リペイントのFXおよびバイナリーツール この動画では、FXおよびバイナリーオプションのトレーダー向けに特別に開発された、非常に正確で強力な取引ツールである Miraculous Indicator を紹介しています。このインジケーターがユニークなのは、伝説的な ガン・スクエア・オブ・ナイン と ガンの振動の法則 に基づいている点で、現代の取引で利用できる最も正確な予測ツールの一つとなっています。 Miraculous Indicatorは 完全に非リペイント であり、ローソク足が確定した後にシグナルが変化したり消えたりすることはありません。つまり、見たものがそのまま利用できます。これにより、トレーダーは自信を持ってエントリーおよびエグジットを行うための信頼性と一貫性のある根拠を得ることができます。 主な特徴: ガン・スクエア・オブ・ナインとガン理論に基づいて構築 100%非リペイントのシグナルシステム すべての時間枠(M1、M5、H1、H4、日足、週足)で機能 FXおよびバイナリーオプション取引
Pulse Scalping Line - an indicator for identifying potential pivot points. Based on this indicator, you can build an effective Martingale system. According to our statistics, the indicator gives a maximum of 4 erroneous pivot points in a series. On average, these are 2 pivot points. That is, the indicator shows a reversal, it is erroneous. This means that the second signal of the indicator will be highly accurate. Based on this information, you can build a trading system based on the Martingale
Currently switched to the 4 hour chart - but use other time frames for confirmation. :-)  I change my main time frame based on the market movement at the time. The Hurricane Forex Indicator is a multi time frame indicator that includes such things as Trade Notifications, Trade Calculator, Momentum Indicator, risk reward and much more. We have a free Trade room for our users as well. Please check out the video for full details of how this indicator works as it has over 15 years worth of developme
Scalping signals M1 を購入した方全員に、 本インジケーターのシグナルに基づいて自動売買を行う EAロボットを無料プレゼント します。 Scalping signals M1 — M1向けトレンドスキャルピング完全エントリーシステム Scalping signals M1 は、チャートをわかりやすい行動マップに変えるインジケーターです。 カラートレンドチャネルが市場の方向を示し、矢印がエントリーポイントを知らせます。 チャネルの方向と矢印に従うだけでよく、初心者でも簡単に扱えます。 インジケーターは特に M1 で優れた性能を発揮し、 XAUUSD(ゴールド)、ポンド、ドルの主要通貨ペア、クロスなど、ほぼすべての通貨ペアに対応しています。 アラートとメール通知を搭載しているため、シグナルを見逃しません。 基本コンセプト Scalping signals M1 は使いやすい外観とは対照的に、内部では高度なアルゴリズムが動作しています。 視覚的に表示されるのは以下の2つだけです。 – トレンド方向を示すチャネル – トレンド継続が期待される位置での Buy/Sell 矢印
BinaryIndicator is a highly accurate indicator for trading binary options. It shows excellent results in scalping. This indicator is based in multifactor analysis of trend indicators, as well as confirmation oscillators, which in the end gives an increased accuracy of signals. Advantages of the indicator Increased accuracy of signals. Excellent results when trading binary options with a short expiration time from M30 to M1 . It works on any timeframes. Works with any trade symbols. Parameters
Rtc ML Ai | Predictor CORE MACHINE LEARNING ENGINE Adaptive ML Market Predictor – Multi-Bar Trend & Candle Forecast What This Indicator Does This indicator is a  real-time market prediction engine  designed to analyze price behavior and estimate  future market tendencies . Unlike conventional indicators, this system  does not rely on static parameters or historical curve-fitting , but adapts its internal state dynamically during live market operation. Instead of using static rules, the indic
FFx Engulfing Setup Alerter gives trade suggestions with Entry, Target 1, Target 2 and StopLoss. Below are the different options available: Entry suggestion - pips to be added over the break for the entry 3 different options to calculate the SL - by pips, by ATR multiplier or at the pattern High/Low 3 different options to calculate the 2 TPs - by pips, by ATR multiplier or at Risk/Reward Offset the dashboard - any place on the chart Remove the suggestion once the price reached the SL line Lines
FFx InsideBar Setup Alerter gives trade suggestions with Entry, Target 1, Target 2 and StopLoss. Below are the different options available: Entry suggestion - pips to be added over the break for the entry Minimum candle size - to avoid too close buy/sell entry suggestions 3 different options to calculate the SL - by pips, by ATR multiplier or at the pattern High/Low 3 different options to calculate the 2 TPs - by pips, by ATR multiplier or at Risk/Reward Offset the dashboard - any place on the c
FFx OutsideBar Setup Alerter gives trade suggestions with Entry, Target 1, Target 2 and StopLoss. Below are the different options available: Entry suggestion - pips to be added over the break for the entry. 3 different options to calculate the SL - by pips, by ATR multiplier or at the pattern High/Low. 3 different options to calculate the 2 TPs - by pips, by ATR multiplier or at Risk/Reward. Offset the dashboard - any place on the chart. Remove the suggestion once the price reached the SL line.
FFx PinBar Setup Alerter gives trade suggestions with Entry, Target 1, Target 2 and StopLoss. Below are the different options available: Entry suggestion - pips to be added over the break for the entry Minimum candle size - to avoid too small candles 3 different options to calculate the SL - by pips, by ATR multiplier or at the pattern High/Low 3 different options to calculate the 2 TPs - by pips, by ATR multiplier or at Risk/Reward Offset the dashboard - any place on the chart Remove the sugges
Automatic, live & interactive picture of all trendlines. Assign push, email and sound alerts to the lines of your choice and be informed about price rollback, breakout, rollback after breakout, number of rollbacks, line expiration by double breakout. Correct, drag or delete the lines and interactively tune the line system. https://youtu.be/EJUo9pYiHFA . Chart examples https: //www.mql5.com/en/users/efficientforex Price Interaction Events All events are effective immediately and only after one
The purpose of this new version of the MT4 standard indicator provided in your platform is to display in a sub-window multiple timeframes of the same indicator with its divergences. See the example shown in the picture below. But the display isn't like a simple MTF indicator. This is the real display of the indicator on its timeframe. Here's the options available in the FFx divergences indicator: Select the timeframes to be displayed (M1 to Monthly) Define the width (number of bars) for each tim
The purpose of this new version of the MT4 standard indicator provided in your platform is to display in a sub-window multiple timeframes of the same indicator with its divergences. See the example shown in the picture below. But the display isn't like a simple MTF indicator. This is the real display of the indicator on its timeframe. Here's the options available in the FFx divergences indicator: Select the timeframes to be displayed (M1 to Monthly). Define the width (number of bars) for each ti
The FFx Dashboard MTF alerter will show you on a single chart all the timeframes (M1 to Monthly) with their own status for the indicator. 2 Alert Options: Single timeframe: each selected timeframe alert separately when a signal occurs Multi timeframes: all selected timeframes must agree for an alert to be triggered Both options have an input to select the timeframes to be used for the alert(s). How to Understand the Status: Green/Red square: histogram above/below 0 line Green square + Red bord
The FFx Dashboard MTF alerter will show you on a single chart all the timeframes (M1 to Monthly) with their own status for the indicator. 2 Alert Options: Single timeframe: each selected timeframe alert separately when a signal occurs Multi timeframes: all selected timeframes must agree for an alert to be triggered Both options have an input to select the timeframes to be used for the alert(s). How to understand the status: Green/Red square: RSI above/below 50 line Green square + Red border: R
The FFx Dashboard MTF alerter will show you on a single chart all the timeframes (M1 to Monthly) with their own status for the indicator. 2 Alert Options: Single timeframe: each selected timeframe alert separately when a signal occurs Multi timeframes: all selected timeframes must agree for an alert to be triggered Both options have an input to select the timeframes to be used for the alert(s). How to understand the status: Green/Red square: Stoch above/below 50 line Green square + Red border:
The FFx Dashboard MTF alerter will show you on a single chart all the timeframes (M1 to Monthly) with their own status for the indicator. 2 Alert Options: Single timeframe: each selected timeframe alert separately when a signal occurs Multi timeframes: all selected timeframes must agree for an alert to be triggered Both options have an input to select the timeframes to be used for the alert(s). How to understand the status: Green/Red square: Price above/below Cloud (Kumo) Green square + Red bo
The FFx Dashboard MTF alerter will show you on a single chart all the timeframes (M1 to Monthly) with their own status for the indicator. 2 Alert Options: Single timeframe: each selected timeframe alert separately when a signal occurs Multi timeframes: all selected timeframes must agree for an alert to be triggered Both options have an input to select the timeframes to be used for the alert(s). How to understand the status: Green/Red square: MA pointing Up/Down Green square + Red border: MA po
The FFx Dashboard MTF alerter will show you on a single chart all the timeframes (M1 to Monthly) with their own status for the indicator. 2 Alert Options: Single timeframe: each selected timeframe alert separately when a signal occurs. Multi timeframes: all selected timeframes must agree for an alert to be triggered. Both options have an input to select the timeframes to be used for the alert(s). How to understand the status: Green square: Price above PSAR Red square: Price below PSAR Options
The FFx Dashboard MTF alerter will show you on a single chart all the timeframes (M1 to Monthly) with their own status for the indicator. 2 Alert Options: Single timeframe: each selected timeframe alert separately when a signal occurs Multi timeframes: all selected timeframes must agree for an alert to be triggered Both options have an input to select the timeframes to be used for the alert(s). How to understand the status: Green/Red square: CCI above/below levels (ie. 100/-100) Grey square: C
The FFx Dashboard MTF alerter will show you on a single chart all the timeframes (M1 to Monthly) with their own status for the indicator. 2 Alert Options: Single timeframe: each selected timeframe alert separately when a signal occurs Multi timeframes: all selected timeframes must agree for an alert to be triggered Both options have an input to select the timeframes to be used for the alert(s). How to understand the status: Green/Red square: ADX above level Grey square: ADX below level Red bor
The FFx Dashboard MTF alerter will show you on a single chart all the timeframes (M1 to Monthly) with their own status. 2 Alert Options: Single timeframe: each selected timeframe alert separately when a signal occurs Multi timeframes: all selected timeframes must agree for an alert to be triggered Both options have an input to select the timeframes to be used for the alert(s). How to understand the status: Green/Red square: bullish/bearish candle Options available in the FFx Dashboard Alerter
The [GRAFF] III manual trading system is based on multiple MetaTrader (MT4) indicators. Together, the entire PACK of GRAFF III indicators makes an advanced trading tool. The system consists of over 20 different custom-built indicators which have been carefully selected and tested in the long term to produce strong and efficient trading signals. The particular indicators are based on different mathematical formulas, so the entire system is calibrated to remove false signals from its own indicator
This indicator allows you to see the strength of the trend on all timeframes. It can be used for all currency pairs. The indicator can be displayed in the form of a column (from left to right): status buy / sell / strong buy / strong sell, strength of the trend in percentage, pips last candle, body candle now, remaining time, and the timeframe of M1 to MN. Information contained below (from left to right): total trend percent, sell percent, buy percent.
FFx Universal Strength Meter PRO is more than a basic strength meter. Instead of limiting the calculation to price, it can be based on any of the 19 integrated strength modes + 9 timeframes. With the FFx USM, you are able to define any period for any combination of timeframes. For example, you can set the dashboard for the last 10 candles for M15-H1-H4… Full flexibility! Very easy to interpret... It gives a great idea about which currency is weak and which is strong, so you can find the best pai
A simplistic indicator informing a user on RSI divergence by sending messages to mobile device and email. The indicator draws 2 vertical lines, marking two RSI extrema that formed the divergence. You get the alert, open the charts and make a decision. The indicator does not show past divergences, thus when you attach it to a chart for the first time you see nothing. Graphics and alerts will appear as soon as divergences do. Drop it in Tester to see how it works. Parameters: RSIPeriod - number of
Pan PrizMA CD Phase is an analogue of the МetaТrader 5 indicator , and is an option based on the Pan PrizMA indicator. Details . Averaging by a quadric-quartic polynomial increases the smoothness of lines, adds momentum and rhythm. Extrapolation by the sinusoid function near a constant allows adjusting the delay or lead of signals. The value of the phase - wave status parameter (which is close in meaning to the trigonometric phase or the angle of the radius-vector rotation in the trigonometric p
作者のその他のプロダクト
Miraculous Indicator – ガン・スクエア・オブ・ナインに基づく100%非リペイントのFXおよびバイナリーツール この動画では、FXおよびバイナリーオプションのトレーダー向けに特別に開発された、非常に正確で強力な取引ツールである Miraculous Indicator を紹介しています。このインジケーターがユニークなのは、伝説的な ガン・スクエア・オブ・ナイン と ガンの振動の法則 に基づいている点で、現代の取引で利用できる最も正確な予測ツールの一つとなっています。 Miraculous Indicatorは 完全に非リペイント であり、ローソク足が確定した後にシグナルが変化したり消えたりすることはありません。つまり、見たものがそのまま利用できます。これにより、トレーダーは自信を持ってエントリーおよびエグジットを行うための信頼性と一貫性のある根拠を得ることができます。 主な特徴: ガン・スクエア・オブ・ナインとガン理論に基づいて構築 100%非リペイントのシグナルシステム すべての時間枠(M1、M5、H1、H4、日足、週足)で機能 FXおよびバイナリーオプション取引
プロフェッショナルなEAエキスパート、グリーンフロッグEAの短い説明 迅速かつ確実に移動する外国為替取引市場で、頼りになる味方を持つことは重要です。グリーンフロッグEAをご紹介します。これは、類まれなる正確性と効率性でトレーダーをサポートする、最高のプロフェッショナルエキスパートアドバイザー(EA)です。 グリーンフロッグEAは、最先端の技術と外国為替市場での長年の経験が融合したものです。経験豊富なトレーダーやソフトウェアエンジニアのチームによって開発され、一線を画す成果と大幅な利益を生み出しています。 グリーンフロッグEAの特徴は、常に変動する市場環境に適応する能力です。洗練されたアルゴリズムとリアルタイムのデータ分析により、利益をもたらすチャンスを迅速に特定し、驚異的な精度で取引を実行します。EAの賢明なトレーディング戦略により、トレンド、ボラティリティの高い市場、レンジ相場など、様々な市場シナリオに対応し、常に最適なパフォーマンスを発揮します。 グリーンフロッグEAは使いやすいインターフェースを備えており、経験豊富なトレーダーや外国為替市場初心者の両方にアクセス可能です
信頼性の低いバイナリオプションのインジケーターにうんざりしていませんか?偽のシグナルを出して損失や失望を招くこともありますよね?それなら、CLOCK INDICATORを探す必要はありません。これはMT4トレーディングプラットフォームで利用できる最高のバイナリオプションのインジケーターです。 高度なアルゴリズムと強力なテクニカル分析ツールを備えたCLOCK INDICATORは、初心者から経験豊富なトレーダーまで、究極のトレーディングツールです。市場のトレンドを正確に予測し、利益を生むトレードの機会を特定し、利益を最大化し、損失を最小限に抑えるのに役立ちます。 他の複雑で使いにくいバイナリオプションのインジケーターとは異なり、CLOCK INDICATORは簡単にインストールしてカスタマイズできます。設定を個別の取引の好みに合わせることができ、すべての主要な通貨ペアと時間枠でシームレスに動作します。 CLOCK INDICATORの特筆すべき特徴の1つは、再描画されない性質です。シグナルが生成されると、チャート上に表示されるため、正確な情報に基づいて的確な取引決定をすることがで
SCALPER EAのご紹介です。この画期的なエキスパートアドバイザー(EA)は、フォレックス取引界を席巻しています。2023年において、SCALPER EAは最も利益の出るEAとして台頭し、トレーダーが外国為替市場にアプローチする方法を革新しました。 短期の市場変動に乗じることを目的としたSCALPER EAは、高い確率でのトレードチャンスを迅速かつ正確に特定するために、高度なアルゴリズムと最先端のテクノロジーを駆使しています。その驚異的なパフォーマンスは、経験豊富なトレーダーや大きな利益を追い求める初心者にとって頼りになるツールとしての評判を築き上げています。 スマートな自動化により、SCALPER EAは常に他のEAを上回る成績を収め、市場の変動が激しい状況でも驚異的な収益を生み出します。迅速かつ効率的なトレードの実行能力により、利益のチャンスが逃げることなくトレーダーに競争上の優位性を与えます。 SCALPER EAを他のEAと異なる点は、その適応性です。市場のトレンドを常に分析し、戦略を調整し、過去のトレードから学び続けることで、常に変動する市場のダイナミクスに適応し続けるよ
驚異的なFXインジケーター「Miraculous」をご紹介します。完璧な結果を得るための1時間足を含むすべてのタイムフレームで効果的に機能する、最強の強力な特殊MT4フォレックスインジケーターです。 すべてのタイムフレームで優れた結果を提供する最高のFXインジケーターを探し続けるのに疲れましたか?これ以上探す必要はありません!「Miraculous」フォレックスインジケーターをご紹介します。このインジケーターは、トレーディングの経験を変革し、収益を新たなレベルに引き上げるために設計されました。 先進のテクノロジーと長年にわたる緻密な開発に基づいて構築された「Miraculous」フォレックスインジケーターは、FX市場における力と正確さの頂点となります。この素晴らしいツールは、すべてのレベルのトレーダーのニーズを満たすように設計されており、一貫した収益性を追求する上で比類のない優位性を提供します。 「Miraculous」フォレックスインジケーターの他との違いは、その非常に適応性にあります。デイトレーダー、スウィングトレーダーであろうと、長期ポジションを好む方であろうと、このインジケータ
MT4インジケーター「イーグルアイ」でバイナリーオプション取引の可能性を引き出す MetaTrader 4(MT4)用の「イーグルアイインジケーター」を使って、バイナリーオプション取引の世界に革命を起こしましょう。この革新的なツールは、レーザーのような精度と比類のない収益性をもたらし、あなたのトレーディング体験を変える準備ができています。 ポテンシャルの境界が崩れ、利益が最大化される世界に飛び込んでください。イーグルアイインジケーターの比類のない精度と揺るぎない信頼性によって、市場の隠された秘密が明らかにされます。細部への緻密な注意を払って設計されたこの先進的なインジケーターは、先進的なアルゴリズム、入念なテクニカル分析、リアルタイムの市場データを組み合わせ、並外れたトレーディングの優位性を提供します。 イーグルアイインジケーターは市場のポイントを的確に把握し、迅速な意思決定をサポートします。直感的なインターフェースと使いやすいデザインにより、初心者のトレーダーでもバイナリーオプションの複雑な世界をスムーズにナビゲートし、その強力な力を最大限に活用することができます。 過去の推測や感情
SWING X Blackは、MetaTrader 4(MT4)インジケーターの画期的なツールです。バイナリーオプションと外国為替の両方の手動および自動取引に対応するように精巧に作られています。比類のない精度とさまざまな時間枠への適応性が、利益を最大化したいトレーダーにとって強力なツールとなっています。SWING X Blackは15分の時間枠に最適化されており、迅速な意思決定と迅速な取引実行に最適です。また、トレーダーはマーチンゲール戦略を後続の信号に使用することを選択できるため、金融市場のダイナミックな世界に参入する際のリスク管理が強化されます。 主な特長: バイナリーオプションと外国為替の互換性: SWING X Blackは、バイナリーオプションと外国為替取引のギャップを調和的に埋め、トレーダーが両方の市場でその強力な洞察を活用できる多様性を提供します。このクロス互換性により、トレーダーは自分の好みの取引スタイルに関係なく、情報に基づいた意思決定をすることができ、成功の可能性を高めることができます。 正確な信号生成: SWING X Blackの核となる強みは、その非の打ちどこ
バイナリオプション取引の世界では、正確な市場分析と戦略的な意思決定が重要です。利益を生むチャンスを開拓するための優れた取引インジケーターを求める旅は終わりません。秘密のインジケーターが登場します。これはMT4バイナリオプション取引ツールで、そのクラスで最も優れた、最も強力な評判を築いています。 秘密のインジケーターは、熟練したトレーダーとエキスパートプログラマーのチームによる、年単位の入念な研究、開発、テストの結果です。独自のアルゴリズムと高度な数学モデルは、バイナリオプションの高速な世界でトレーダーに無類の優位性を提供するように微調整されています。 秘密のインジケーターを他の取引インジケーターとは異なるものにするのは、驚くべき正確さで利益を生む取引のチャンスを見つける能力です。そのシグナルは、強力なテクニカルインジケーター、価格行動分析、市場センチメント評価の組み合わせから派生しています。この多面的なアプローチにより、秘密のインジケーターは短期の変動と長期のトレンドの両方を捉え、トレーダーに市場の包括的な視点を提供します。 秘密のインジケーターの中でも際立った特徴の1つは、そ
**Binary Smart Systemのご紹介:究極のトレードパートナー** Binary Smart Systemは単なるインジケーターではありません。様々な市場で的確なシグナルを提供し、洗練されたアルゴリズムと豊富なテクニカルインジケーターの集合をベースにした、トレーダーを的確さとタイムリーなシグナルで装備するための厳選されたトレードツールです。 **インジケーターコンポーネント:** 1. **移動平均パーセンテージ(MAP):** このコンポーネントは複数の移動平均の加重平均を計算し、トレンドの特定の強力な基盤を形成します。MAPは市場の状況に動的に適応し、現在のトレンド方向に対する洞察を提供します。 2. **商品チャネル指数(CCI):** 平均価格からの偏差を分析することで、CCIは買われすぎと売られすぎの状態を評価します。Binary Smart SystemのCCI統合は、ポテンシャルな反転ポイントを特定する包括的なアプローチを保証します。 3. **移動平均収束拡散法(MACD):** シンプルなクロスオーバーを超えるMACDコンポーネント。MACD
はじめに バイナリーオプションと外国為替取引の高速な世界では、成功と失敗の違いを生み出すことができる適切なツールと戦略を手にすることが重要です。そのようなツールの1つは、チャートパターン、移動平均、取引量の組み合わせを活用してトレーダーが情報に基づいた意思決定を支援する、画期的な取引手法であるBBBブラックブルーバイナリーオプションインジケーターシステムです。この包括的なガイドでは、BBBシステムの複雑な部分を掘り下げ、その仕組み、使用方法、そしてあなたの取引パフォーマンスを潜在的に向上させる方法を説明します。 BBBインジケーターシステムの説明 BBBブラックブルーバイナリーオプションインジケーターシステムは、バイナリーオプションと外国為替取引の最適なエントリーと出口ポイントを特定するのを支援するために設計された洗練されたテクニカル分析ツールです。その名前は、主要な取引シグナルを表す「黒」と「青」から来ています。 チャートパターン BBBシステムは、取引チャートの特定された部分を分析することから始まります。これは、サポートとレジスタンスレベル、トレンドライン、ろうそく足パターンなどの
「メトロ駅」:成功する自動取引への道 「メトロ駅」は、先端の手法と賢明なアルゴリズムの交差点で動作する、前衛的なMT4自動取引シグナルです。精密な取引の世界に足を踏み入れましょう。「メトロ駅」は、移動平均線(MA)、相対力指数(RSI)、ストキャスティクスオシレーター、モメンタム、および平均方向指数(ADX)の強さを活用して、洗練された取引シグナルを生成します。これは、指導を求める初心者トレーダーと、取引プロセスを効率化しようとする熟練トレーダーの両方に対応するよう設計されています。 「メトロ駅」の機能の中心には、これらの重要なテクニカル指標を組み合わせる独自の戦略があり、これによりデータ駆動の洞察の調和した収束が生まれます。移動平均線は基本的なトレンド分析を提供し、市場のノイズを取り除き、価格の動向の真の方向を明らかにします。市場が買われ過ぎか売られ過ぎかを判断することで、RSIとストキャスティクスオシレーターは、トレーダーが可能性のある反転または継続を予測するのに役立つ追加の確認レベルを提供します。一方、モメンタムは市場の活気を評価し、現在のトレンドの強度を窺うための窓を提供します
タイトル: ノンリペイント XY トレンドインジケーターの紹介: フォレックスとバイナリオプションで成功するための究極のガイド はじめに: ノンリペイント XY トレンドインジケーターは、複雑で常に変化する金融市場において、トレーダーが情報に基づいた意思決定を行うために設計された革新的な取引ツールです。この高度な MetaTrader 4 (MT4) インジケーターは、リペイントという一般的な問題を排除しながら、驚くほどの精度で価格トレンドを予測するそのユニークな能力により、トレーダーの間で大きな人気を集めています。 インジケーターの理解: ノンリペイント XY トレンドインジケーターを際立たせている重要な機能の一つは、その精度へのこだわりです。過去のシグナルをリペイントし、トレーダーに信頼性の低いデータを残してしまう他の多くのインジケーターとは異なり、このインジケーターは一貫性を保っています。トレーダーは、生成されたシグナルが過去の価格変動を正確に反映していることを知って、安心して取引できます。 XY トレンドインジケーターは、高度なアルゴリズムを使用して価格データを分析し、市場のト
バイナリーハッカーインジケーター 金融市場の高速な世界では、1秒も無駄にできません。すべての意思決定が、取引の成否を分けるのです。そこで登場するのが、バイナリーハッカーインジケーターです。これは、トレーダーに貴重な洞察を提供するために、チャート上の1分ごとに分析を提供する画期的なツールです。 バイナリーハッカーは、手動による広範な分析が必要な従来のインジケーターとは異なり、トレーディングストラテジーから推測作業を取り除き、純粋なデータに基づいた計算されたアプローチを提供します。 取引における精度の向上: バイナリーハッカーインジケーターは、一般的なトレーディングツールではありません。チャート上の各分を分析し、トレーダーに貴重な洞察を提供するリアルタイムアナライザーとして機能します。 バイナリーハッカーを使用すると、売買圧力の微妙なバランスを理解しながら、取引の1分ごとに分析する機能を備えています。この機能により、常に市場の勢いに沿った取引を行うことができます。 1分ごとのパワー: 取引の1分ごとに分析し、売り買い圧力の微妙なバランスを理解する能力を想像してみてください。バイナリーハッカ
ゴールデンサン123トレンドダッシュボードアラートMT4インジケーター 刻々と変化する金融市場の世界で、 トレーダーは常に競争力を高めるためのツールを求めています。 この精度と収益性の追求の中で、 ゴールデンサン123トレンドダッシュボードアラートMT4インジケーターは、 チャンスの灯台として輝いています。 MetaTrader 4プラットフォーム用に設計されたこの卓越したインジケーターは、 トレンド追跡機能とアラートメカニズムを備えた戦略的取引のエッセンスをカプセル化しています。 トレンドのパワーを活用する ゴールデンサン123トレンドダッシュボードアラートMT4インジケーターは、 市場のトレンドを特定して活用するための高度なツールです。 トレーダーは、 トレンドが収益性の高い取引の生命線であることを理解しており、 このインジケーターはまさにそれを実現するために細心の注意を払って作られています。 市場をたゆまなくスキャンし、 ブル、 ベア、 レンジングのいずれのトレンドであっても、 出現するトレンドを即座に認識します。 明快なダッシュボード このインジケーターの際立った特徴の1つは、
Elon Musk EAは、MACDレベル、MACDのダイバージェンス、隠れたMACDのダイバージェンス、そしてインテリジェントマーチンゲールに基づく特別な戦略によって動作する、革新的なトレードツールです。 他とは一線を画すトレード体験を始める準備はできていますか? Elon Musk EAを使用すると、MACDレベル、さまざまなMACDのダイバージェンス、隠れたMACDのダイバージェンス、そして類まれなるインテリジェントマーチンゲールシステムの潜在能力を引き出すことができます。これらの優れた要素を活用して、このEAはあなたのトレードを新たなレベルに引き上げ、財務的な成功を達成するお手伝いをします。 Elon Musk EAの優れた点は、その精度と適応性です。先進的なアルゴリズムと徹底的な市場分析に基づいて、MACDレベルを非常に正確に検出し、利益を得るための最適なタイミングをつかむことができます。MACDのダイバージェンスと隠れたダイバージェンスを活用することで、収益性の高いエントリーポイントとイグジットポイントを特定し、競合他社に先んじて行動できます。 しかしそれだけではありません
MT4用T-REX_EAエキスパートアドバイザー T-REX_EA は、MT4向けに設計された強力でインテリジェントなトレーディングロボットで、先進的な戦略の組み合わせを活用して安定した利益を提供します。このエキスパートアドバイザーは、AI技術、ブレイクアウト戦略、ローソク足パターン、ボリュームプロファイル、需給ゾーンを活用して市場トレンドを分析し、トレードのエントリーとエグジットを最適化します。 主な特徴: マルチストラテジーアプローチ : AIに基づく分析と従来のブレイクアウト戦略、ローソク足パターンの認識を組み合わせて、強力なトレード優位性を提供します。 ボリュームプロファイルと需給ゾーン : ボリュームプロファイルデータと需給ゾーンを統合し、高確率のトレードを正確に特定します。 ターボモード : 市場のボラティリティが高い状況で取引頻度と利益の可能性を高めるための特別な機能です。 通貨ペアの互換性 : EAはすべての通貨ペアで取引できますが、主要な通貨ペア(EUR/USD、GBP/USD、USD/JPYなど)で特に高い利益を上げることができます。 柔軟なトレード設定 : $50
AI TRADING SYSTEM for MT4 - あなたの究極のAI駆動利益マシン! AI TRADING SYSTEM で取引の未来を解き放ちましょう。これは最先端の専門アドバイザー(EA)で、強力なAI駆動戦略を使用して、すべての通貨ペアの利益を最大化します。汎用性のために設計されていますが、EUR/USD、GBP/USD、USD/JPYなどの 主要ペア で 優れたパフォーマンス を発揮し、市場の先を行くことができます。 AI TRADING SYSTEM には 2つの異なる取引モード があり、あなたの取引スタイルと利益目標に合わせて適応します。 BACISモード - 安定した信頼性の高い利益を最小限のリスクで実現し、バランスの取れたアプローチを求めるトレーダーに最適です。 TURBOモード - アグレッシブな高報酬戦略で利益を高めたい人にとって理想的で、市場の勢いを捉えるのに最適です。 主要な特徴: カスタマイズ可能な設定 : 利食い(TP)、損切り(SL)、ロットサイズ、マーチンゲールオプションを調整して、リスク許容度と取引の好みに合わせてシステムをカスタマイズします。
「Binary Smart Eye」MT4インジケーターは、バイナリーオプションと外国為替市場の両方で取引シグナルを提供するために設計されており、M1からW1までの広範囲な時間枠で動作します。トレンドレベル、インテリジェントな移動平均、最適化された取引期間を組み合わせた独自の戦略を採用し、潜在的なエントリーポイントを特定します。 主な機能の内訳は以下のとおりです。 マルチタイムフレーム分析: インジケーターの多様性により、トレーダーはさまざまな時間枠で利用でき、M1でのスキャルピングからW1での長期トレンドフォローまで、さまざまな取引スタイルに対応します。 独自の戦略: 「Binary Smart Eye」の核となるのは、以下を利用する独自の戦略です。 トレンドレベル: これらのレベルは、優勢な市場トレンドと潜在的な反転ポイントを特定するのに役立ちます。 インテリジェントな移動平均: 市場のボラティリティに適応し、正確なトレンド方向を提供するカスタマイズされた移動平均です。 スマート取引期間: インジケーターは、特定の時間期間に基づいてシグナル生成を最適化し、最適な市場状況を捉えること
MT5インジケーター「トラフィックシグナル」は、RSI、ストキャスティクス、CCI、トレンドの水準を分析する特別な戦略に基づいて、すべての時間枠で最も正確なエントリーシグナルを得るための特別な戦略に基づいて動作します。トラフィックシグナルは、成功した取引の世界への入り口です!精度と専門知識で設計されたこの革新的なインジケーターは、先進的なテクニカルインジケーターであるRSI、ストキャスティクス、CCI、トレンドを全時間枠で活用し、前例のない自信を持って市場をナビゲートするための最も正確なエントリーシグナルを提供します。 トラフィックシグナルを使用することで、収益性の高い取引機会を検出するために精密に調整された重要なテクニカル指標の包括的な分析にアクセスできます。不確実性を払拭し、情報を基にした意思決定の新たな時代を迎えましょう。RSI、ストキャスティクス、CCI、トレンドの潜在能力を引き出すトラフィックシグナルは、これまでにない市場のダイナミクスを鮮明に描写します。 トラフィックシグナルを使って、市場のトレンドとパターンを容易に把握できます。短期的なエネルギーサージまたは長期的な戦略的
ROADMAPをご紹介します:完璧なエントリーエリア、売買ゾーン、ストップロス、TP1、TP2を知るための特別な戦略に基づいたMT5 Forexインジケーター! Forex市場での不確実性や推測にうんざりしていませんか?完璧なエントリーポイント、買いエリアと売りエリアの特定、正確なストップロスとテイクプロフィットの設定に苦労していませんか?そんな方には、ROADMAPがおすすめです。ROADMAPは、トレーディング戦略を一新する革命的なMT5 Forexインジケーターです。 特別な戦略を採用したROADMAPは、Forex市場での成功に欠かせない貴重な情報と正確な計算を提供します。この優れたインジケーターは、Fibonacci(FIBO)レベルを含む先進的な手法の組み合わせを使用して、最適なトレード決定をサポートします。 ROADMAPを使用することで、驚くほど正確なエントリーゾーンを特定することができます。これにより、利益を生む機会を逃さず、早すぎるトレードを行うこともありません。インジケーターのスマートなアルゴリズムは、市場の状況が望ましいトレードパラメーターと一致するタイミングを
Currency Magician Matrixインジケーターとは何ですか? Currency Magician Matrixインジケーターは、通貨の強さを示すグラフィカルなツールです。一般的なインジケーターは通常、通貨の強さを他の通貨との関係で表示しますが、いくつかの計算を行うことで各個別通貨の絶対的な強さを見つけることができます。 したがって、Currency Magician Matrixインジケーター(またはメーター)は、通貨の絶対的な強さを表現し、他の通貨の強さと比較できるツールです。 通貨の絶対的な強さを計算する方法はさまざまありますが、通常、他のインジケーターのすべての値を考慮して抽出しようとします。 つまり、たとえばJPYの強さを計算するためには、アルゴリズムがJPYを含むすべてのペアで同じインジケーターの値を分析します。 この概念は、Currency Magician Matrixに新しい場合は少し混乱するかもしれませんが、心配しないでください。さらに読んでいくことで理解できます。 Currency Magician Matrixは、8つの主要通貨の強さを測定するため
革新的な MT5 インジケーター、DARWIN Assistant   をご紹介します。これは、トレーディングを成功させる世界への究極のゲートウェイです。精度と専門知識に基づいて設計された DARWIN Assistant   は、RSI、ストキャスティクス、CCI、トレンドなどの高度なテクニカル指標をすべての時間枠にわたって活用する特別な戦略に基づいて動作します。この最先端のインジケーターはエントリーのための最も正確なシグナルを提供し、比類のない自信を持って市場をナビゲートできるようにするため、並外れた取引体験に備えてください。 DARWIN Assistant   を使用すると、最も収益性の高い取引機会を検出するために細心の注意を払って調整された、重要な指標の包括的な分析にアクセスできるようになります。不確実性に別れを告げ、情報に基づいた意思決定の新時代を迎えましょう。 RSI、ストキャスティクス、CCI、トレンドを DARWIN Assistant   内でシームレスに統合することでその力を解き放ち、これまでにないほど市場のダイナミクスを鮮明に描きます。 DARWIN As
フィルタ:
レビューなし
レビューに返信