Chandelier Exit MT5
- インディケータ
-
BLAKE STEVEN RODGER
 I’ve been trading Forex since 1998 and developing trading algorithms and tools to exploit trends since 2002.
I launched ALGOSAMURAI.COM in 2017 to help all traders succeed in this very challenging market with some of my best strategies and tools. - バージョン: 1.9
- アップデート済み: 12 4月 2023
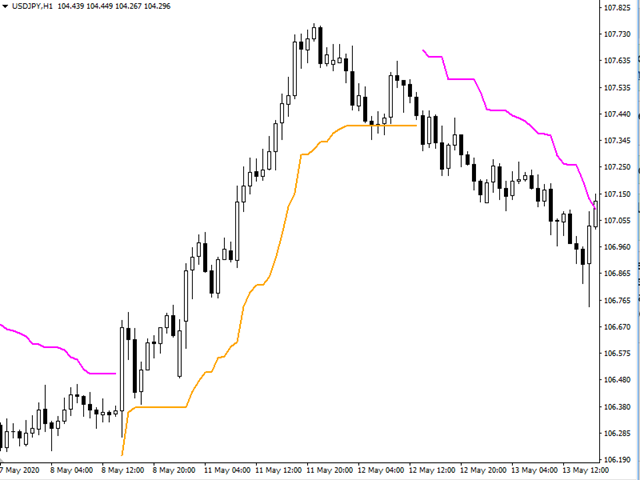
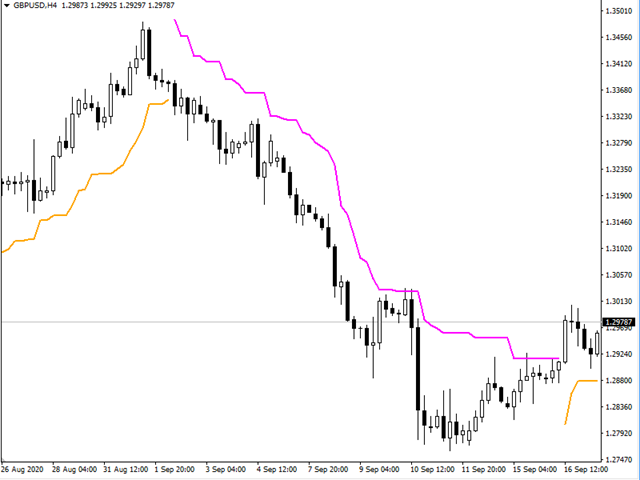
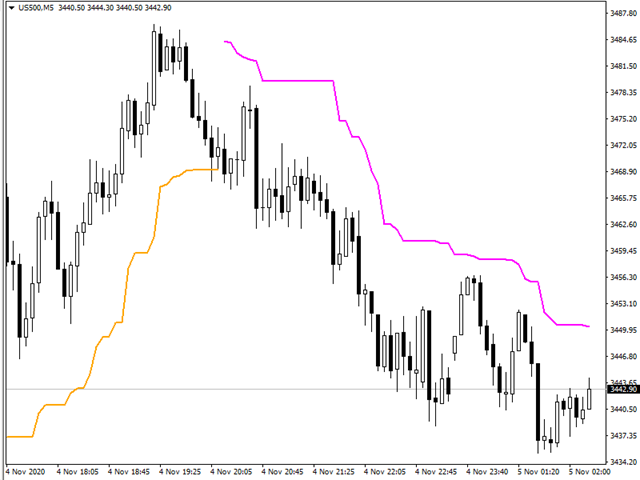
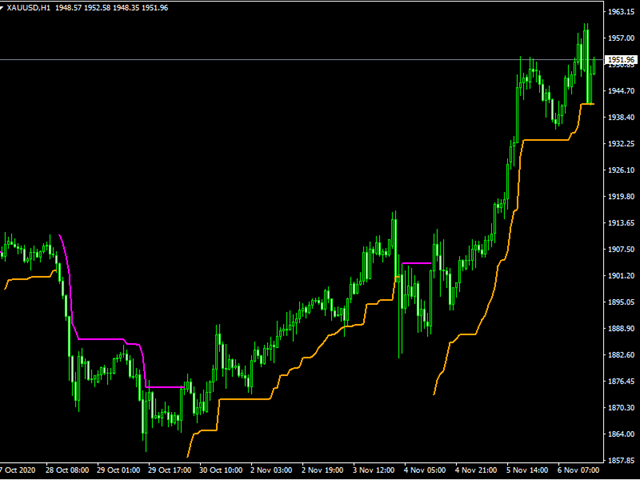
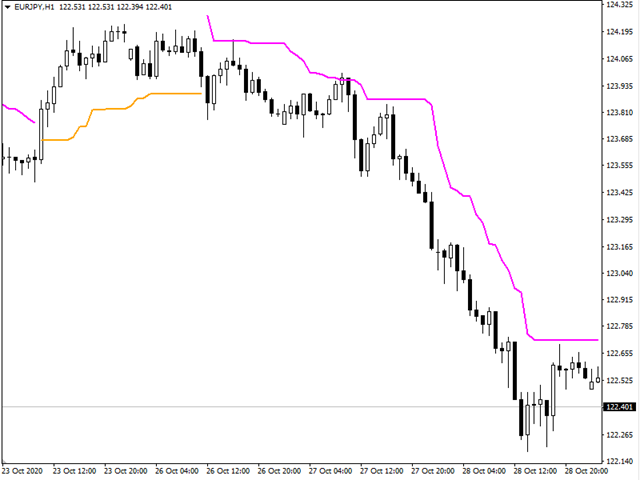
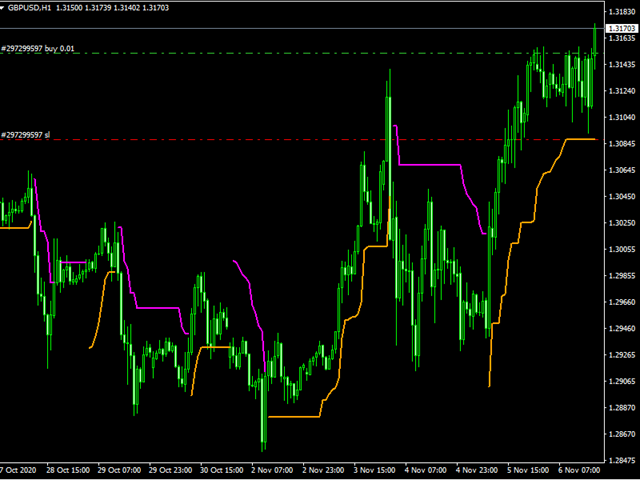
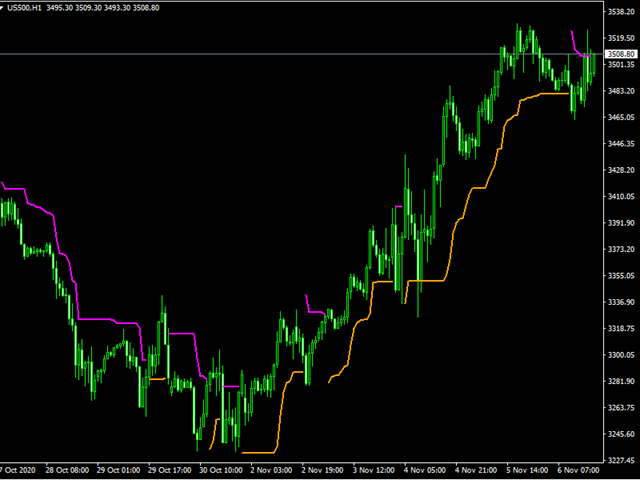
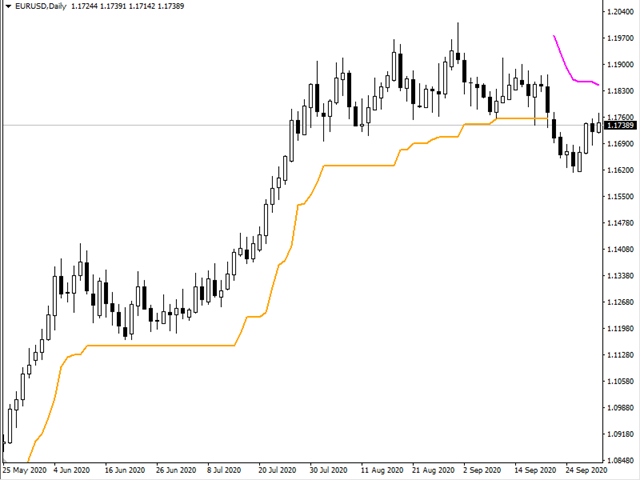
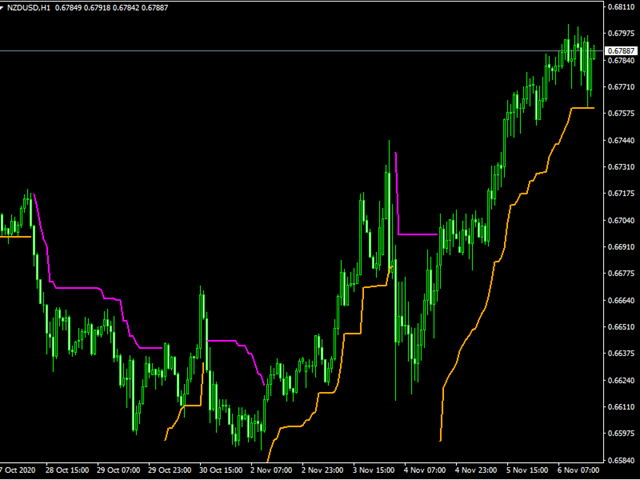
Developed by Chuck LeBeau, the Chandelier Exit indicator uses the highest high / lowest low -/+ a multiple of the ATR value to draw trailing stop lines (orange under buys, magenta over sells) that advance with the trend until the trend changes direction.The value of this trailing stop is that it rapidly moves upward in response to the market action. LeBeau chose the chandelier name because "just as a chandelier hangs down from the ceiling of a room, the chandelier exit hangs down from the high point or the ceiling of our trade."
Chandelier Exit uses a multiple of the Average True Range (ATR), subtracting it’s value from the highest high on buy, adding its value to the lowest low on sell. Moreover, the trailing stop lines are generated to support the order’s trend direction (long or short):
- In an upward trend, the long trailing stop line (orange line under buy) appears and advances upward until the close crosses under the line.
- In a downward trend, the short trailing stop line (magenta over sell) appears and declines until the close crosses over the line.
The Chandelier Exit is one of 14 indicator-based trailing stops comprising our Universal Trailing Stop EA MT5. You don't need to download this indicator to make it work in the UTS EA, as the indicator is already built into it, but if you want to see how your trailing stop auto-adjusts to the indicator lines on the chart of UTS-EA when you set Apply indicator template=true, you need to download this indicator.
While we use the Chandelier Exit as a trailing stop, it can be used in a volatility breakout strategy. The trader or EA can buy whenever the close crosses above the upper trail line and sell whenever the close crosses below the lower trail line.
This Chandelier Exit trail is superior to using a fixed percentage because its change is based on the volatility characteristics of the underlying instrument and time frame.
Parameters:
- Range (7) - Range of the highest high (lowest low)
- Shift (1) - Indicator shift;
- ATRPeriod (14) – Indicator Period;
- ATRMultipl (3) – This is the factor for multiplying the ATR. You may use fractions – this does not need to be an integer;
- Show Channel (true/false) — if false (default), it shows the orange line under buy in upward trend, magenta line over sell in downward trend; if true, it shows a channel on both sides of the price.


This is a useful indicator for trend following traders. It would be very helpful if the author would add alerts when the trend changes.