Volume Trade Levels

The idea behind this indicator is very simple , First it contains 2 mechanisms to place your trades:


1- Enter the Pips you want to duplicate to price levels.

2- Automatically let the indicator specify the largest Buy / Sell Volume Candle and place duplicated levels based on the candle itself.


How it works:

1- Enter the Pips you want to duplicate to price levels:  

1- once the indicator is loaded you will need first to Specify the number of pips in the indicator Configuration window ,you can get that by selecting any candle high and low , divide by 10  then go  to chart.
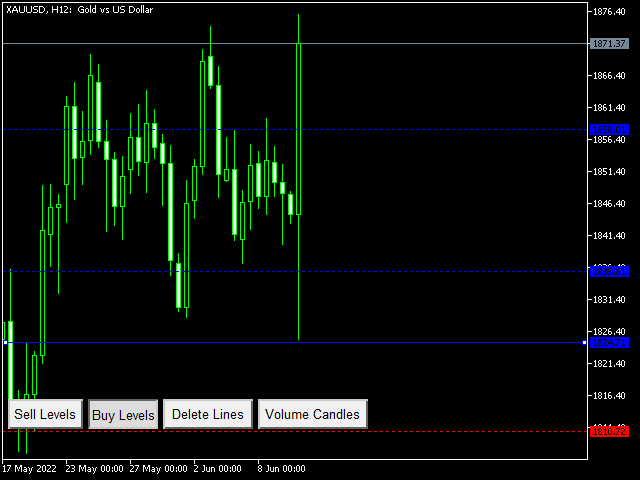
2-Now you will see 2 lines , Red & Blue Horizontal lines, move the red to the very upper level you consider it as TOP , mostly people chose a top of a candle , I advise to chose the low price of HIGHEST candle.
3- Do the same for the Buy Blue line , move it the price level lower than current price where you believe it is a bottom.
4- Press Sell levels button , then Buy levels , if not appearing press one more time, or refresh the chart.
5- Now you will have the levels where the price will reverse FOR SURE. 


2- Automatically let the indicator specify the largest Buy / Sell Volume Candle and place duplicated levels based on the candle itself.

1- once the indicator is loaded , ignore the the indicator configuration value , it is not used in this method, just go to the chart.
2- Now you will see a vertical line moving it left for X Number of candles means , any candle to that vertical line right are the candles you want to process the indicator algorithm against , in other words , if you move that line to 45 candle to the left , this means to the right there will be 44 candle ,
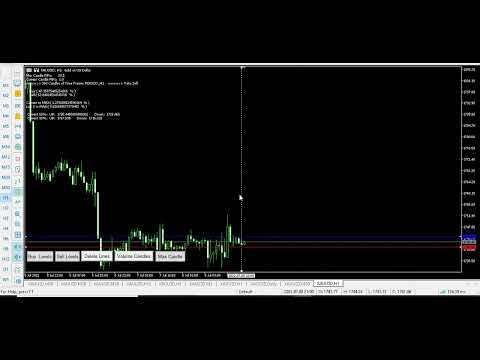
3- Once you moved the line to the required point , now you press Volume Candles Button on the Chart
it will automatically detect the highest and lowest volume candles and place one vertical line in blue another on red on the detected candle , those candles are your master candles, enjoy watching the price reversing on each buy/sell levels.

At any point of time you can delete all lines to clear the chat , switch the time frame to have the default standby as before.


Once the trial period is expired (31 July 2022) , this will be for rent or sell , kindly as much as you suggest new features to add or technical advices as closer as you are to get 3 6 or 12  Months free use of it.


Update version 2.9 youtube is based on

again I am trying to upload a new version but I get an error , no idea what is wrong:

At least 8 characters are required


おすすめのプロダクト
This indicator simplifies your entry zones by displaying the areas where you can plan your entry that potentially could give you high risk/reward ratios. Other than picking the most optimal entry points, the Hot Zone indicator can act as your typical support/resistance indicator for pullbacks for all timeframes. You can use this indicator as the only trading indicator or use it with another indicator for reentry purposes.  Besides, when using Hot Zones, the risk/reward ratio should be well abov
This Indicator draws Fibonacci Extension levels in two different ways. You can select whether to draw Fibonacci Extension levels based on your favourite ZigZag settings or you can let the indicator to draw Fibonacci Extension  level based on given number of Bars or Candles.  You can also set Mobile and Email notification for your favourite Extension  levels individually. With this indicator you will not have to feel lonely as the it can generate Voice alerts, which will keep you focused on your
Fibonacci MT5 Converted from MT4, Optimized MT5 Version. original MT4 code by Awran5  https://www.mql5.com/en/code/14393 Non-Repainting Fibonacci Tool for MT5 Professional Fibonacci indicator with a stable non-repainting swing detection engine. Feel free to join my  Telegram Channel Main Functions Custom Swing Detection Uses proprietary Reverse-Scan plus Peak-Climbing algorithm to find reliable swing highs and lows without repainting Includes right-side priority for equal highs and lows Suppor
FREE
"Hunttern harmonic pattern finder" base on the dynamic zigzag with the notification and prediction mode This version of the indicator identifies 11 harmonic patterns and predicts them in real-time before they are completely formed. It offers the ability to calculate the error rate of Zigzag patterns depending on a risk threshold. It moreover sends out a notification once the pattern is complete. The supported patterns: ABCD BAT ALT BAT BUTTERFLY GARTLEY CRAB DEEP CRAB CYPHER SHARK THREE DRIV
Fibonacci Auto Levels Pro MT5 – リトレースメント、エクステンション、ピボットポイント Fibonacci Auto Levels Pro MT5 は、市場のスイングポイントを自動的に検出し、完全なフィボナッチ・リトレースメント、エクステンション、およびピボットポイントの構造をチャート上に描画する高度なテクニカル分析ツールです。 このインジケーターは、いくつかの独立したシステムを統合された単一の分析ツールに組み合わせています。 ピボットポイント (フィボナッチモード) ピボットポイントは、前期間の値幅に基づいて、潜在的なサポートおよびレジスタンスゾーンを特定するために使用されます。 このインジケーターは、前回の高値 (High)、安値 (Low)、終値 (Close) にフィボナッチ比率を適用して計算される フィボナッチ・ピボットポイント を使用します。 ピボットポイントの時間足は、手動で設定することも、以下のロジックを使用して自動で設定することもできます。 日中取引 ≤ 5 分 → 4 時間足 5–45 分 → 日足 45 分–4 時間 → 週足 日足
MetaTrader 5用スマートピボットポイント — スマートな取引のための明確なレベル スマートピボットポイントは、MetaTrader 5用のプロフェッショナルインジケーターです。チャート上に主要な取引レベルを自動計算し、表示します。混沌とした価格変動を、明確な構造化されたマップに変換し、サポート、レジスタンス、価格バランス、そして潜在的なターゲットゾーンをハイライトします。明瞭性を重視するトレーダーのために設計されたこのツールは、FX、仮想通貨(ビットコイン、イーサリアム)、株価指数、株式、コモディティ(XAUUSD)など、あらゆる市場で機能します。 このインジケーターは、計算時間を節約し、分析に客観性をもたらす、信頼できる分析アシスタントです。市場シグナルを提供したり、代わりに意思決定を行うわけではありませんが、情報に基づいた独自の取引判断のための高品質な情報基盤を提供します。 主な機能とメリット すぐに使える価格座標システム:もう手動でレベルを描く必要はありません。中心レベル(バランス)、サポート、レジスタンス、買いターゲット、売りターゲットの5本の明確なラインがチャ
Historical Pivot Zones - Fibonacci Indicator MT5 Automatically draws Fibonacci retracement and projection zones based on historical price pivots. This MT5 indicator intelligently selects pivot points from different timeframes (weekly, monthly, or 6-month ranges) and creates visual Fibonacci zones around key levels. Features include: Smart Mode Selection - Auto-adjusts based on your chart timeframe Clean Visual Zones - Highlighted areas instead of just lines Essential Fib Levels - 9 retrace
This Indicator draws Fibonacci Arc levels in two different ways. You can select whether to draw Fibonacci Arc levels based on your favourite ZigZag settings or you can let the indicator to draw Arc levels based on given number of bars or candles.  You can also set Mobile and Email notification for your favourite Arc levels individually. With this indicator you will not have to feel lonely as the it can generate Voice alerts, which will keep you focused on your trading and remove boredom.  Produc
Auto Fib Retracements
Ross Adam Langlands Nelson
4.2 (5)
Automatic Fibonacci Retracement Line Indicator. This indicator takes the current trend and if possible draws Fibonacci retracement lines from the swing until the current price. The Fibonacci levels used are: 0%, 23.6%, 38.2%, 50%, 61.8%, 76.4%, 100%. This indicator works for all charts over all timeframes. The Fibonacci levels are also recorded in buffers for use by other trading bots. Any comments, concerns or additional feature requirements are welcome and will be addressed promptly. 
FREE
BTMNEXT Manager Pro – Smart Trade Manager Open trades manually, let the system handle management, protection, and optimization automatically. ️ Full mobile control (easy SL/TP management) ️ Advanced profit protection system ️ Perfect compatibility with manual trading ️ Real-time push notifications ️A VPS is required for all mobile controls BTMNEXT Manager Pro is an advanced trade management system designed to intelligently manage open positions, control risk, and optimize profits. This s
Somewhere over the rainbow It is a system that tries to operate the market from the exhaustion of the trend with a correction algorithm that tries to cut losses at the cost of increasing the margin This system makes all the adjustments automatically, analyzing the pair and the market to decide which is the most efficient step to reach your destination. Somewhere over the rainbow is a multiple trade and multi lot system(The maximum batch can be up to 5 times the initial batch distributed in mult
Chart Patterns Builder Premium
Florea E. Sorin-Mihai Persoana Fizica Autorizata
The Chart Patterns Builder Premium expert advisor is an extension of the freely available Chart Patterns Builder Basic :         it provides 1 new chart pattern: the rectangle breakout (besides the double top & bottom pattern already provided in the basic edition);         in most configurations, backtesting usually shows more than double (2x) average yearly return rate;         the account growth curve is also smoother, due to approximately double number of trades,  compared to the free version
Candle EA MT5
Mansour Babasafary
4.14 (22)
This expert is based on patterns The main patterns of this specialist are candlestick patterns Detects trends with candlestick patterns It has a profit limit and a loss limit, so it has a low risk The best time frame to use this expert is M30 time frame The best currency pairs to use with this expert is the EURUSD, GBPUSD, AUDUSD, USDCAD currency pairs Attributes: Can be used in the EURUSD, GBPUSD, AUDUSD, USDCAD  currency pairs Can be used in M30, H1, H4 time frames Has profit limit and loss
MERAVITH SCANNERは、MetaTrader 5用のプロフェッショナルな金融市場インジケーターで、複数の分析ツールを一つの統合システムにまとめています。独自の出来高加重平均価格(VWAP)手法を使用してすべての計算を自動で行い、主観的な解釈を完全に排除します。 このインジケーターは、すべての資産クラス(FX、株式、指数、商品、暗号通貨)およびM1から月足までのすべての時間軸で動作します。基本原理は「価格は出来高に従う」というものです。MERAVITHは機関投資家の出来高が集中するポイントを特定し、その集中から数学的に正確な価格レベルを導き出します。予測や投機は行わず、計算のみを行います。 MERAVITH SCANNERを使用すると、28の主要FX通貨ペアをすべての時間軸でわずか2~3分でスキャンできます。また、任意の市場をスキャンすることも可能です。例えば、約100銘柄の株式を約10分でスキャンできます。 インジケーターは、消耗レベル、均衡線、偏差、統計レベル、およびターゲット予測を算出します。 チャート要素 Origin Point :すべての計算が始まる起点です。イン
AUC - Super Trends   は、価格の動きに基づいた視覚的なラインで市場の方向を示すインジケーターです。 このインジケーターは、価格追跡システムを使用して上昇局面と下降局面の変化を示します。ラインは市場の変動に応じて自動的に調整されます。 Forex、指数、ゴールドなどのさまざまな金融商品や複数の時間足で使用できます。 ---------------------------------------------------- 機能 市場方向の可視化 価格変動の変化の識別 トレンド分析の補助 ---------------------------------------------------- 特徴 上昇および下降局面の視覚的表示 価格への自動適応 シンプルで分かりやすい表示 複数の時間足に対応 さまざまな金融商品で使用可能 注意 本インジケーターは分析を補助するツールであり、リスク管理や意思決定の代替ではありません。
FREE
Candle Smart Range
Gianny Alexander Lugo Sanchez
5 (1)
MetaTrader 5用 Candle Smart Range (CSR) Candle Smart Rangeは、複数のタイムフレームで価格レンジを自動的に識別するためのテクニカル指標です。このツールは、ローソク足の形成と、以前の高値・安値との相互作用に基づいて市場構造を分析します。 主な機能: レンジ検出: 勢いのある動きの前のコンソリデーション(保ち合い)ゾーンを特定します。 だまし(フェイクアウト)の識別: 価格が以前の水準を超えたものの、ローソク足の終値基準でレンジ内に戻った場合をマークします。 マルチタイムフレーム分析: カスタム期間を含む最大19のタイムフレームのデータを1つのチャートに表示します。 内部可視化(ズーム): チャートを切り替えずに、上位足のローソク足内部の値動きを確認できます。 時間フィルター: 主要な市場セッションなど、特定の時間帯で動作するように設定可能です。 履歴確認モード: 過去のデータをステップバイステップで確認し、分析できます。 アラート機能: ローソク足の確定や新しいレンジの検出を通知します。 インターフェース: 視覚的な負荷を管理する画面
ニューラルネットワークインジケーター   学習機能が組み込まれています。 これは、多層的にカスタマイズ可能なパーセプトロンと高度なトレーニング設定を備えた、真の自律型人工知能システムです。 将来の価格変動を予測します。このインジケーターは、あらゆる金融銘柄でご自身でトレーニングできます。機械学習の特別な知識は必要ありません。必要なものはすべてこのツールに集約されており、自動モードとプリセットによって簡単に実装できます。 メジャーアップデートv2.0-2.5がリリースされました。 高度な入力機能:インジケータのサポートが追加されました。 これで、生の価格データを3つのテクニカル指標と組み合わせて、より深い市場分析を行うことも、価格なしの指標のみを使用することもできます。 ブロックせずにライブトレーニング:インテリジェントな学習アルゴリズムは、バックグラウンドで非同期的に動作します。 あなたのMetaTrader5ターミナルは完全に応答し続け、ニューラルネットワークを学びながら市場の取引と分析を継続することができます。 特徴: 簡単スタート 。自動モードですぐにスタートできる簡単な設定
Free automatic Fibonacci is an indicator that automatically plots a Fibonacci retracement based on the number of bars you select on the BarsToScan setting in the indicator. The Fibonacci is automatically updated in real time as new highest and lowest values appears amongst the selected bars. You can select which level values to be displayed in the indicator settings. You can also select the color of the levels thus enabling the trader to be able to attach the indicator several times with differe
FREE
Elliot Wave Pro is an MT5 indicator that automatically detects Elliott Wave structures (impulse and corrective behavior) and calculates key Fibonacci-based retracement/limit levels from the most recent completed wave. It helps turn wave structure into a tradable setup: enter on the pullback, target Wave 1 , and place your stop beyond the wave high / invalidation level . That gives you a clear risk-to-reward model where a single valid setup can outweigh multiple small losses. In short, it shows w
Unlock the power of Fibonacci with our advanced indicator! This tool precisely plots Fibonacci levels based on the previous day's high and low, identifying the next day's key support and resistance levels. Perfect for day trading and swing trading, it has consistently generated weekly profits for me. Elevate your trading strategy and seize profitable opportunities with ease. NOTE: In the Input section make sure the draw labels are set to "True" so you can see each levels.
Do you need to check support and resistance lines? Do you need to find them really fast and automatically? Do you want to set your own settings how to find them? Then this indicator is your right choice! Indicator Lines is developed for finding support and resistance lines on chart. It does its job quickly and fully automatically. Main principle of algorithm is to get all extremes on chart (according to "Density" parameter). Then indicator tries to find minimally 3 points (according to "Minimal
Ultra Charts - Advanced Custom Chart Types for MT5 Get Manual Here! Get The Free Ultra Charts Trader Here! Ultra Charts is a comprehensive charting solution that brings professional-grade alternative chart types to MetaTrader 5. This Expert Advisor provides traders with multiple custom chart formats beyond standard time-based candlesticks, enabling enhanced technical analysis and pattern recognition. Chart Types Included The product includes six distinct chart types, each designed to filter mark
FREE
Utility for show on charts the visual informations about: - a vertical line at start of each bar of selected timeframe - a vertical line at start of each day - a vertical line at start of each week - vertical lines at start / end of trading sessions selected - bid / ask prices, spread, money value for each point (of 1 standard lot) and last tick time recived" You can enable / disable each information and set the color for each line
FREE
PredatorEA
Dragan Drenjanin
5 (1)
Predator EAの紹介 Predatorは、MetaTrader 5(MT5)プラットフォーム向けの最先端のエキスパートアドバイザー(EA)で、FX取引を簡素化し、強化することを目指して開発されました。このEAは様々な通貨ペアと時間枠に最適化されており、信頼性の高い自動化ソリューションを求めるトレーダーに最適です。 仕様 プラットフォーム : MT5 アカウントタイプ : 最適なパフォーマンスを得るにはヘッジアカウントが推奨されます。 Predator の潜在能力を引き出すにはテストが不可欠です。 MT5 の戦略テスターを使用して、利用可能なすべての通貨ペアのパフォーマンスを評価し、XAUUSD-H1 などのトップ パフォーマーを特定します。 パフォーマンスはアカウントや市場環境によって異なるため、ブローカーの条件に合わせて設定を調整してください。 Predator を選ぶ理由 Predatorは、シンプルさと高度な自動化の融合、効率性を重視した事前最適化、そして様々な戦略への適応性において際立っています。将来的なアップグレードと丁寧なサポートにより、安定した成果を求めるトレ
シンプルだが効果的。 反転インジケーター - それは何か? スーパートレンドのロジックと指数曲線技術を組み合わせたトレンドフォロー型オーバーレイインジケーターです。トレンドの方向を検知し、チャート上に動的なチャネルを描画し、トレンドが反転した際にリアルタイムでアラートを送信します。 仕組み ATRとスーパートレンド係数を用いて指数ベースラインを算出。価格がこのベースラインを上抜け/下抜けした時点でトレンド反転を確認。緑矢印は買いトレンド開始、赤矢印は売りトレンド開始を示す。 特徴: ATRベースの動的チャネル付き指数トレンドベースライン 緑/赤で色分けされたトレンドラインと塗りつぶしチャネル トレンド反転時の買い/売り矢印シグナル 内蔵アラート:ポップアップ、プッシュ通知、メール、サウンド 重複アラート防止(1バーあたり1アラート) 完全カスタマイズ可能:色、線幅、矢印サイズ、チャネル幅 遅延のないクリーンなチャートオーバーレイ 入力パラメータ: 指数係数、スーパートレンド係数、ATR期間、チャネル幅 オン/オフ切り替え:チャネル塗りつぶし、矢印、各アラートタイプ 全視覚
FREE
Uncover the market’s secret zones with the ADR Levels+ Indicator. This dynamic tool plots ADR extension levels at 100%, 125%, 150%, and 200% right on your chart. In most cases, price dances between these boundaries—but when it breaks out, it often signals a prime opportunity for a mean reversion trade or the start of an evolving trend. Plus, an integrated alarm system triggers as soon as these key levels are reached, ensuring you never miss a lucrative trading opportunity. Elevate your strategy
Fibonacci Bollinger Bands (FBB) Indicator - User Manual 1. Introduction Fibonacci Bollinger Bands (FBB) is a technical analysis indicator that combines three tools: Bollinger Bands , Fibonacci Ratios , and the Volume-Weighted Moving Average (VWMA) . The purpose of this indicator is to provide a multi-dimensional view of the market by helping to identify: Dynamic support and resistance zones. The general market trend. Volatility levels and potential accumulation phases (squeezes). Price breakouts
FREE
Supertrend Pro MTF Dashboard: Trade with Confidence Stop missing high-probability trades. The Supertrend Pro MTF Dashboard is the professional-grade tool designed to cut through market noise and instantly identify powerful, aligned trends across 8 timeframes (M1 to W1). Built for serious traders, this indicator delivers no-repaint signals and a clean, actionable dashboard, making multi-timeframe confirmation effortless. KEY FEATURES FOR PROFESSIONAL TRADERS 1. Multi-Timeframe Trend Alignment
This z-score indicator shows the correct z-score of an asset, as it uses the normalized price data for calculation, which is the only correct way. Z-score is only applicable for normal distributed data, therefore not the actual price is considered, but the normalised returns, which were assumed to follow a normal distribution. Returns are mean reverting and assumed to follow a normal distribution, therefore z-score calculation of returns is more reliable than z-score on price, as price is NOT m
Range Directional Force Indicator – Designed for You to Optimize! The Range Directional Force Indicator is a cutting-edge tool designed to empower traders by visualizing market dynamics and directional strength. Built to offer insights into market trends and reversals, this indicator is an invaluable asset for traders seeking precision in their strategies. However, it is important to note that this indicator is not optimized, leaving room for you to tailor it to your unique trading preferences.
このプロダクトを購入した人は以下も購入しています
ARIPoint is a powerful trading companion designed to generate high-probability entry signals with dynamic TP/SL/DP levels based on volatility. Built-in performance tracking shows win/loss stats, PP1/PP2 hits, and success rates all updated live. Key Features: Buy/Sell signals with adaptive volatility bands Real-time TP/SL/DP levels based on ATR Built-in MA Filter with optional ATR/StdDev volatility Performance stats panel (Success, Profit/Loss, PP1/PP2) Alerts via popup, sound, push, or email Cu
このインジケーターを購入された方には、以下の特典を 無料 で提供しています: 各トレードを自動で管理し、ストップロスとテイクプロフィットを設定し、戦略ルールに基づいてポジションを決済する補助ツール 「Bomber Utility」 様々な銘柄に合わせたインジケーターの設定ファイル(セットファイル) 「最小リスク」、「バランスリスク」、「待機戦略」 の3つのモードで使用できる Bomber Utility 用の設定ファイル このトレーディング戦略をすぐに導入・設定・開始できる ステップバイステップのビデオマニュアル ご注意: 上記の特典を受け取るには、MQL5のプライベートメッセージシステムを通じて販売者にご連絡ください。 オリジナルのカスタムインジケーター 「Divergence Bomber(ダイバージェンス・ボンバー)」 をご紹介します。これは、MACDのダイバージェンス(乖離)戦略に基づいた 「オールインワン」型のトレーディングシステム です。 このテクニカルインジケーターの主な目的は、価格とMACDインジケーターの間に発生するダイバージェンスを検出 し、将来の価格の動きを示す
Entry In The Zone and SMC Multi Timeframe is a real-time 2-in-1 market analysis tool that combines market structure analysis and a No Repaint BUY / SELL signal system into a single indicator, built on Smart Money Concepts (SMC) — a widely adopted framework used by professional traders to understand market structure. This indicator helps you see the market more clearly, make decisions based on structure rather than guesswork, and focus on high-probability zones where price is more likely to react
Quantum TrendPulse を ご紹介します。これは、   SuperTrend   、   RSI   、および Stochastic のパワーを 1 つの包括的なインジケーターに組み合わせて、取引の可能性を最大限に引き出す究極の取引ツールです。精度と効率を求めるトレーダー向けに設計されたこのインジケーターは、市場のトレンド、勢いの変化、最適なエントリー ポイントとエグジット ポイントを自信を持って特定するのに役立ちます。 主な特徴: SuperTrend 統合: 現在の市場動向に簡単に追従し、収益性の波に乗ることができます。 RSI精度: 買われすぎと売られすぎのレベルを検出し、市場の反転のタイミングに最適で、SuperTrendのフィルターとして使用されます。 確率的精度: 確率的振動を活用して、変動の激しい市場で隠れたチャンスを見つけます。SuperTrend のフィルターとして使用されます。 マルチタイムフレーム分析:   M5 から H1 または H4 まで、さまざまなタイムフレームで市場を常に把握します。 カスタマイズ可能なアラート: カスタム取引条件が満たされ
このインジケーターを購入すると、プロ仕様のトレードマネージャーを無料で差し上げます。 まず第一に、このトレーディングシステムがノンリペイント、ノンリドロー、ノンラグのインジケーターであることを強調する価値がある。これにより、手動取引とロボット取引の両方に理想的なものになっています。 オンラインコース、マニュアル、プリセットのダウンロード。 「スマートトレンドトレーディングシステム MT5」は、新規および経験豊富なトレーダー向けにカスタマイズされた包括的なトレーディングソリューションです。10以上のプレミアムインジケーターを組み合わせ、7つ以上の堅実なトレーディング戦略を備えており、多様な市場状況に対応する多目的な選択肢となっています。 トレンドフォロー戦略:トレンドを効果的に乗り越えるための正確なエントリーとストップロス管理を提供します。 リバーサル戦略:潜在的なトレンドの反転を特定し、トレーダーがレンジ相場を活用できるようにします。 スキャルピング戦略:高速で正確なデイトレードおよび短期取引のために設計されています。 安定性:すべてのインジケーターはノンリペイント、ノンリドロー、ノ
Power Candles – あらゆる市場に対応した強度ベースのエントリーシグナル Power Candles は、Stein Investments が長年培ってきた強度分析を価格チャート上に直接反映します。価格だけに反応するのではなく、各ローソク足は実際の市場の強さに基づいて色分けされ、モメンタムの蓄積、強度の加速、明確なトレンド転換を瞬時に把握できます。 すべての市場に共通する単一ロジック Power Candles は すべての取引シンボル で自動的に動作します。現在のシンボルが Forex か非 Forex 市場かを自動判別し、内部で適切な強度モデルを適用します。 Forex および Gold :FX Power のデルタ値を使用(絶対値レンジ最大 100) 指数、暗号資産、CFD :IX Power の強度値を使用(絶対値レンジ最大 50) 必要な強度計算は Power Candles に直接組み込まれています。ローソク足のカラーリングやシグナルロジックに、追加のインジケーターは不要です。 価格ノイズではなく「強度状態」 各ローソク足は、以下の 9 つの明確に定義された強
Azimuth Pro
Ottaviano De Cicco
5 (7)
Azimuth Pro V2:MT5向けシンセティック・フラクタル構造分析と確認済みエントリー 概要 Azimuth Pro は Merkava Labs によるマルチレベルスイング構造インジケーターです。4つのネストされたスイングレイヤー、スイングアンカーVWAP、ABCパターン検出、3タイムフレーム構造フィルタリング、そして確定バーでの確認済みエントリー — 1つのチャートで、ミクロスイングからマクロサイクルまでを網羅するワークフロー。 これはブラインドシグナル製品ではありません。ロケーション、コンテキスト、タイミングを重視するトレーダーのための構造ファーストワークフローです。 V2発売記念オファー — Azimuth Pro V2をUSD 399で(次の100本)。最終価格:USD 499。 1. V2での変更点 シンセティック・マルチタイムフレームエンジン 上位タイムフレーム分析をMeridian Proと同じ独自のシンセティックアーキテクチャで一から再構築。よりクリーンなHTFコンテキスト、安定したライブ動作、従来のMTF同期問題なし。シンセティックエンジンは 固定比率タ
FX Trend NG:次世代マルチマーケット・トレンドインテリジェンス 概要 FX Trend NG は、複数の時間足に対応したプロフェッショナル向けトレンド分析およびマーケット監視ツールです。 市場全体の構造を数秒で把握することができます。 複数のチャートを切り替える必要はありません。どの銘柄がトレンド中なのか、どこでモメンタムが弱まっているのか、そしてどの時間足で強い整合性があるのかを瞬時に確認できます。 ローンチ特別オファー – FX Trend NG を $30(6ヶ月) または $80 永久ライセンス でご利用いただけます。 すでに Stein Investments のユーザーですか? -> メッセージを送信 して、プライベートグループへアクセスしてください。 セットアップや詳細情報が必要ですか? -> Stein Investments 公式ページ をご覧ください。 1. FX Trend NG が他と異なる理由 3ステート・トレンドロジック ― Buy と Sell だけではない • 多くのインジケーターは Buy または Sell の2状態のみを表示します。
SignalTech MT5 is a trading system for EURUSD, USDCHF, USDJPY, AUDUSD, NZDUSD, EURJPY, AUDJPY, NZDJPY, CADJPY H2 and H3 Timeframe.  It can generate signals with Buy/Sell Arrows and Pop-Up/Sound Alerts. Each signal has clear Entry and Stop Loss levels, which should be automatically flagged on the chart, as well as potential Targets 1, 2, and 3. The Entry and TP levels are fixed after the trade is taken. The exit level is dynamic. If there are signs of a potential short-term trend reversal, the
優れたテクニカルインジケーター「Grabber」をご紹介します。これは、すぐに使える「オールインワン」トレーディング戦略として機能します。 ひとつのコードに、市場のテクニカル分析ツール、取引シグナル(矢印)、アラート機能、プッシュ通知が強力に統合されています。 このインジケーターを購入された方には、以下の特典を無料で提供します: Grabberユーティリティ:オープンポジションを自動で管理するツール ステップバイステップのビデオマニュアル:インジケーターのインストール、設定、取引方法を解説 カスタムセットファイル:インジケーターをすばやく自動設定し、最大限の成果を出すための設定ファイル 他の戦略はもう忘れてください!Grabberだけが、あなたを新たなトレードの高みへと導いてくれるのです。 Grabber戦略の主な特徴: 推奨タイムフレーム:M5〜H4 対応通貨ペア・資産:どれでも使用可能ですが、私が実際に検証した以下を推奨します(GBPUSD、GBPCAD、GBPCHF、AUDCAD、AUDUSD、AUDSGD、AUDCHF、NZDUSD、NZDCAD、EURCAD、EURUSD、E
マーケットメーカーのためのツール。 Meravith は次の機能を提供します: すべての時間足を分析し、現在有効なトレンドを表示します。 強気と弱気の出来高が等しくなる流動性ゾーン(出来高均衡)を強調表示します。 異なる時間足のすべての流動性レベルをチャート上に直接表示します。 テキスト形式の市場分析を生成し、参考情報として表示します。 現在のトレンドに基づいて目標値、サポートレベル、ストップロスを計算します。 取引のリスクリワード比を算出します。 口座残高に基づいてポジションサイズを計算し、潜在的な利益を推定します。 また、市場に大きな変化があった場合には警告を表示します。 インジケーターの主要ライン: 強気/弱気の出来高エグゾーストライン ― 目標値として機能します。 市場のトレンドを示すライン。市場が強気か弱気かによって色が変わり、トレンドのサポートとして機能します。主にその色が市場センチメントを示します。 出来高均衡ライン(Eq)。Eq(Volume Equilibrium)ラインはシステムの中核です。これは買い手と売り手の出来高のバランスポイントを表します。市場の流動性を示し
あなたのシンボルでどの戦略が実際に機能するか確認しましょう - リアルマネーをリスクにさらす前に。 Power Barは、あらゆるシンボルとあらゆるタイムフレームで 極端な価格バー を検出し、3つの異なるトレード戦略を即座にバックテストします。勝率、プロフィットファクター、損益を並べて比較できます。すべてが1つのインタラクティブなパネルに集約されています。 推測なし。カーブフィッティングなし。データだけです。 Power Barが特別な理由 ほとんどのインジケーターはシグナルを出すだけで、それが機能するかどうかは推測に任されます。Power Barはさらに先を行きます - すべてのシグナルを 3つの戦略 に対してテストし、統計を表示します。FlipFlop、Momentum、Reversalをワンクリックで切り替え、数値が即座に変化するのを確認できます。 FlipFlop - 常にポジションを保有。シグナルでエントリーし、反対シグナルでイグジット。当社のリサーチでは、US30、US500、DAXなどのトレンドのあるインデックスで最も効果的です。 Momentum - シグナルの方向に
まず第一に、この取引インジケーターは再描画されず、再描画されず、遅延しないことを強調する価値があります。これにより、手動取引とロボット取引の両方に理想的なものになります。 ユーザーマニュアル:設定、入力、戦略。 アトミックアナリストは、価格の強さとモメンタムを利用して市場でより良いエッジを見つけるためのPA価格アクションインジケーターです。ノイズや誤ったシグナルを除去し、取引ポテンシャルを高めるための高度なフィルターを備えています。複雑なインジケーターの複数のレイヤーを使用して、アトミックアナリストはチャートをスキャンし、複雑な数学的計算をシンプルなシグナルと色に変換します。これにより、どのような初心者トレーダーでも理解して使用し、一貫した取引の決定を行うことができます。 「アトミックアナリスト」は、新規および経験豊富なトレーダー向けにカスタマイズされた包括的な取引ソリューションです。プレミアムインジケーターとトップノッチの機能を1つの取引戦略に組み合わせ、すべてのタイプのトレーダーにとって汎用性のある選択肢にします。 デイリートレーディングとスキャルピング戦略:高速で正確なデイ
BTMM State Engine Pro is a MetaTrader 5 indicator for traders who use the Beat The Market Maker approach: Asian session context, kill zone timing, level progression, peak formation detection, and a multi-pair scanner from a single chart. It combines cycle state logic with a built-in scanner dashboard so you do not need the same tool on many charts at once. What it does Draws the Asian session range; session times can follow broker server offset or be set in inputs. Tracks level progression (L
これはMT5のインジケーターで、再描画なしで取引に参入するための正確なシグナルを提供します。 外国為替、暗号通貨、金属、株式、インデックスなど、あらゆる金融資産に適用できます。かなり正確な見積もりを提供し、取引を開始して終了するのに最適な時期を教えてくれます。1つのシグナルを処理しただけでインジケーターの元が取れた例の 動画 (6:22)をご覧ください。Entry PointsPro インジケーターの助けを借りたほとんどのトレーダーの最初の1週間の結果が改善しています。 Telegramグループ に登録してください。Entry Points Proインジケーターのメリットは次の通りです。 再描画のないエントリーシグナル 再描画されるインジケーターでは一度表示されたシグナルが削除されて大きな金銭的損失につながることがありますが、これと異なり、表示されて確認されたシグナルは消えることがありません。 エラーなしの取引開始 インジケーターアルゴリズムによって取引を開始する(資産を売買する)理想的な瞬間を見つけることができます。それを使用するすべてのトレーダーの成功率が向上します。 あら
ご紹介     Quantum Breakout PRO は 、ブレイクアウト ゾーンの取引方法を変革する画期的な MQL5 インジケーターです。 13年以上の取引経験を持つ経験豊富なトレーダーのチームによって開発されました。     クォンタム ブレイクアウト プロ   は、革新的でダイナミックなブレイクアウト ゾーン戦略により、あなたのトレーディングの旅を新たな高みに押し上げるように設計されています。 クォンタム ブレイクアウト インジケーターは、5 つの利益ターゲット ゾーンを備えたブレイクアウト ゾーン上のシグナル矢印と、ブレイクアウト ボックスに基づいたストップロスの提案を提供します。 初心者トレーダーにもプロのトレーダーにも適しています。 量子EAチャネル:       ここをクリック 重要!購入後、インストールマニュアルを受け取るためにプライベートメッセージを送ってください。 推奨事項: 時間枠: M15 通貨ペア: GBPJPY、EURJPY、USDJPY、NZDUSD、XAUUSD アカウントの種類: ECN、Raw、またはスプレッドが非常に低い R
FX Power: 通貨の強弱を分析して、より賢い取引を実現 概要 FX Power は主要通貨と金の実際の強弱をあらゆる市場状況で理解するための必須ツールです。強い通貨を買い、弱い通貨を売ることで、 FX Power は取引の意思決定を簡素化し、高い確率の取引機会を見出します。トレンドを追従する場合でも、極端なデルタ値を使用して反転を予測する場合でも、このツールはあなたの取引スタイルに完全に適応します。ただ取引するだけではなく、 FX Power で賢く取引をしましょう。 1. なぜ FX Power がトレーダーにとって非常に有益なのか 通貨と金のリアルタイム強弱分析 • FX Power は主要通貨と金の相対的な強弱を計算し、マーケットダイナミクスに関する明確な洞察を提供します。 • どの資産がリードしているか、または後れを取っているかを監視して、取引するペアを賢く選びましょう。 マルチタイムフレームの包括的なビュー • 短期、中期、長期のタイムフレームで通貨と金の強弱を追跡し、マーケットトレンドに基づいて取引戦略を調整できます。 • スキャルピングからスイングトレード
OmniSync Projection
Antonio-alin Teculescu
5 (1)
Chronos Fractal Engine is an innovative price projection indicator for MetaTrader 5, designed to transform your technical analysis by intelligently identifying and projecting historical price patterns. Built upon an advanced correlation algorithm and the fractal principles of the market, this powerful tool visualizes potential future price movements, giving you a unique edge in your trading decisions. What is Chronos Fractal Engine? At its core, the Chronos Fractal Engine employs a sophisticat
Bill Williams Advanced is designed for automatic chart analysis using Bill Williams' "Profitunity" system. The indicator analyzes four timeframes at once. Manual (Be sure to read before purchasing) Advantages 1. Analyzes the chart using Bill Williams' "Profitunity" system. Signals are displayed in a table in the corner of the screen and on the price chart. 2. Finds all known AO and AC signals, as well as zone signals. Equipped with a trend filter based on the Alligator. 3. Finds "Divergence Bar
Berma Bands
Muhammad Elbermawi
5 (8)
Berma Bands (BBs) インジケーターは、市場のトレンドを特定して活用したいトレーダーにとって貴重なツールです。価格と BBs の関係を分析することで、トレーダーは市場がトレンド段階にあるか、レンジ段階にあるかを判断できます。 詳細については、[ Berma Home Blog ] をご覧ください。 バーマ バンドは、上部バーマ バンド、中部バーマ バンド、下部バーマ バンドの 3 つの異なる線で構成されています。これらの線は価格の周りにプロットされ、全体的な傾向に対する価格の動きを視覚的に表します。これらのバンド間の距離から、ボラティリティや潜在的な傾向の反転についての洞察を得ることができます。 バーマ バンドの線がそれぞれ離れると、市場が横ばいまたはレンジ相場の期間に入っていることを示すことがよくあります。これは、明確な方向性の偏りがないことを示しています。トレーダーは、これらの期間中にトレンドを特定するのが難しいと感じる可能性があり、より明確なトレンドが出現するまで待つ場合があります。 バーマ バンドの線が 1 本の線に収束すると、強いトレンド環境の兆候となること
Meridian Pro
Ottaviano De Cicco
5 (1)
Meridian Pro:MT5用プロフェッショナル・マルチタイムフレーム・トレンドマトリックス 概要 Meridian Pro は Merkava Labs が開発したマルチタイムフレーム・トレンドマトリックスで、方向性の状態、強度、モメンタムの状況、マトリックスの合意をひとつのコンパクトなパネルに集約します。ひとつのアダプティブエンジンがM1からW1まで一貫して適用されます。シンボルごとの調整は不要。インジケーターの積み重ねも不要。すべてのアセットとすべてのタイムフレームをカバーするひとつの構造化された読み取りです。 発売キャンペーン — Meridian Proを USD 99 (導入価格)で入手。通常価格:USD 149 。 1. Meridian Proが他と異なる理由 ひとつのエンジン、バラバラなインジケーターのダッシュボードではない 多くのMTFダッシュボードは、タイムフレームごとに生のインジケーター値を繰り返すだけです。Meridian Proはマトリックス全体でひとつのアダプティブ・トレンドエンジンを使用するため、パネルの各行が同じ構造化フレームワークから導出されます
FX Volume MT5
Daniel Stein
4.79 (24)
FX Volume:ブローカー視点で捉える本物の市場センチメント クイック概要 トレード手法をさらに高めたいとお考えですか? FX Volume は、リテールトレーダーやブローカーのポジション状況をリアルタイムで提供します。これは、COTのような遅延レポートよりもはるかに早く知ることができます。安定した利益を目指す方も、さらなる優位性を求める方も、 FX Volume は大きな不均衡を見極め、ブレイクアウトを確認し、リスク管理を洗練させるのに役立ちます。今すぐ始めて、実際の出来高データがどのように意思決定を変革するかを体感してください! 1. FX Volume がトレーダーにとって非常に有益な理由 高精度の早期警戒シグナル • 各通貨ペアを売買しているトレーダー数を、他者よりも早く、ほぼリアルタイムで把握できます。 • FX Volume は、複数のリテールブローカーから得られる本物の出来高データを収集し、分かりやすい形式で提供する 唯一 のツールです。 強力なリスク管理 • ロングやショートの大きな偏り(インバランス)を特定し、潜在的なトレンド転換を見逃しません。ストップ
Trend Ai indicatorは、トレンドの識別と実用的なエントリポイントと反転アラートを組み合わせることで、トレーダーの市場分析を強化する優れたツールです。 この指標は、ユーザーが自信と正確さで外国為替市場の複雑さをナビゲートすることを可能にします トレンドAiインジケーターは、主要なシグナル以外にも、プルバックやリトレースメント中に発生するセカンダリエントリポイントを識別し、トレーダーが確立されたトレンド内の価格修正を活用できるようにします。 重要な利点: *MT4およびMT5の仕事 *明確な買いまたは売りシグナル *再描画しません ·すべての資産で動作します 私はeaやセットをtelegram it詐欺で販売しないように注意してください。 すべての設定はここでブログで無料です。  重要! 指示とボーナスを得るために購入後すぐに私に連絡してください! 私の他のプロダクトと同様、実質操作の監視はここに見つけることができます: https://www.mql5.com/en/users/mechanic/seller&nbsp ; 設定および入力: すべての
Gannスクエアインジケーターは、W.D. Gannによって執筆された「市場予測のための数学的な式」の記事に基づく強力な市場分析ツールです。このツールは、解析に数学的な概念を応用し、Gann理論に基づいています。それは、144、90、52のスクエアや9のスクエアなど、Gannの関連テクニックの要素を取り入れています。さらに、の方法を組み込んでおり、9のスクエアとその関連性についてのチャネルやスターパターンに焦点を当てています。 ユーザーマニュアルと使用方法: このインジケーターを使用する前に、ユーザーマニュアルを読んで疑問点を解決するためにお問い合わせいただくことをお勧めします。ユーザーマニュアルの完全版は、当社のウェブサイトで入手できます。 MT5の完全版は購入できますし、MT4の無料版も試すことができます。両方のバージョンへのリンクを提供していますので、ご利用ください。 主な機能と機能: Gannスクエアインジケーターは、市場分析のための完全なツールセットを提供し、幾何学的な概念とGann理論に基づいて的確な判断を行う手助けをします。以下に主な機能を示します。 9のスクエアの分析:
Cvd Divergence
Thalles Nascimento De Carvalho
CVD Divergence ― オーダーフローとダイバージェンスのプロフェッショナル分析 CVD Divergence は、価格と Cumulative Delta Volume(CVD)との間に発生する信頼性の高いダイバージェンスを検出するために開発されたテクニカル指標です。実際の注文フローが価格の動きを確認していない局面を正確に捉え、反転、勢いの減衰、そして機関投資家による操作の可能性を示します。 このインジケーターは、アグレッシブボリュームの読み取りと価格構造の分析を組み合わせ、明確で客観的かつ先行性のあるシグナルを提供します。 インジケーターの機能 CVD Divergence は、累積デルタボリュームを用いて注文フローの方向と価格の方向を比較します。両者が大きく乖離した際、チャート上にマーカーを表示し、ダイバージェンスの方向を視覚的に示します。 検出できる内容: 強気ダイバージェンス(価格が下落しているが CVD が上昇している場合) 弱気ダイバージェンス(価格が上昇しているが CVD が下降している場合) 買い手・売り手の勢いの枯渇 機関投資家の不均衡によるフェイクムーブ
Gartley Hunter Multi - An indicator for searching for harmonic patterns simultaneously on dozens of trading instruments and on all possible timeframes. Manual (Be sure to read before purchasing) | Version for MT4 Advantages 1. Patterns: Gartley, Butterfly, Shark, Crab. Bat, Alternate Bat, Deep Crab, Cypher 2. Simultaneous search for patterns on dozens of trading instruments and on all possible timeframes 3. Search for patterns of all possible sizes. From the smallest to the largest 4. All fou
このダッシュボードは、選択されたシンボルの最新の利用可能なハーモニックパターンを表示するので、時間を節約し、より効率的に /   MT4バージョン 。 無料インジケーター:   Basic Harmonic Pattern インジケーター列 Symbol : 選択したシンボルが表示されます。 Trend :   強気または弱気 Pattern : パターンの種類(ガートレー、バタフライ、バット、カニ、サメ、サイファー、ABCD) Entry : エントリー価格 SL: ストップロス価格 TP1: 1回目の利食い価格 TP2: 2回目の利食い価格 TP3:   3回目の利食い価格 Current price :   現在値 Age (in bars):    最後に描画されたパターンの年齢 主な入力項目 Symbols:   "28 Major Currency Pairs "または "Selected Symbols "から選択。 Selected Symbols:   カンマで区切られた監視したいシンボル("EURUSD,GBPUSD,XAUUSD")。ブローカーがペアに接
Introducing Indicator for PainX and GainX Indices Traders on Weltrade Get ready to experience the power of trading with our indicator, specifically designed for Weltrade   broker's PainX and GainX Indices.  Advanced Strategies for Unbeatable Insights Our indicator employs sophisticated strategies to analyze market trends, pinpointing optimal entry and exit points.  Optimized for Maximum Performance To ensure optimal results, our indicator is carefully calibrated for 5-minute timeframe charts on
Presenting one-of-a-kind Gann Indicator for XAUUSD IQ Gold Gann Levels is a non-repainting, precision tool designed exclusively for XAUUSD/Gold intraday trading. It uses W.D. Gann’s square root method to plot real-time support and resistance levels, helping traders spot high-probability entries with confidence and clarity. William Delbert Gann (W.D. Gann) was an exceptional market analyst whose trading technique was based on a complex blend of mathematics, geometry, astrology, and ancient calcul
「 Dynamic Scalper System MT5 」インジケーターは、トレンド波の中でスキャルピング取引を行う手法のために設計されています。 主要通貨ペアと金でテスト済みで、他の取引商品との互換性があります。 トレンドに沿った短期的なポジションオープンのシグナルを提供し、追加の価格変動サポートも提供します。 インジケーターの原理 大きな矢印はトレンドの方向を決定します。 トレンド波の中では、小さな矢印の形でスキャルピングシグナルを生成するアルゴリズムが機能します。 赤い矢印は強気方向、青い矢印は弱気方向です。 トレンドの方向には敏感な価格変動ラインが描かれ、小さな矢印のシグナルと連動します。 シグナルは次のように機能します。適切なタイミングでラインが現れるとエントリーシグナルが形成され、ラインが開いている間はポジションが保持され、完了すると取引が終了します。 推奨される動作時間枠はM1~H4です。 矢印は現在のローソク足に形成され、次のローソク足が開いている場合は、前のローソク足の矢印は再描画されません。 入力パラメータ Trend Wave Period - トレ
作者のその他のプロダクト
Andrew PitchFork
Mahmoud Sabry Mohamed Youssef
4 (4)
Andrew Pitch fork is one of the most interesting string trend & Channel & Fibo technical analysis , it's like ALL in ONE tool would be very enough for you. Using 2 Andrew pitch Forks with 2 different time frames on same chart is really very hard working and might be impossible , but with this indicator is possible now , moreover , using this method as Candle Volume based  analysis give strong trust for your trade. I assume if you are having 1 daily pith fork lets say with 22 Candle value , and
FREE
I always wondered if I can have multiple time frame Moving average on same chart , it is not possible , now with my Indicator is possible , As you know Moving average is lagging not leading indicator , but how can I predict future levels of it ? I came with this idea , I hope you will like it , I made a Mirror of Moving average , the other side of specific time will be shown in the other side of the chart where the price didnt reach yet , that will help you to know the levels you can start sell
FREE
ZamanCyclesPOC
Mahmoud Sabry Mohamed Youssef
Everyone knows how to analyze the market , which level to buy / sell  this is an easy job , which leads to unusual horrible loses , very little few people knows WHEN then enter the market , time is Money , this is the key!!! This version is a Proof of concept limited version of ZamanCYcles founded here: https://www.mql5.com/en/market/product/81883?source=Site +Market+Product+Page This works Only on 3 Minutes Time frame for 45 Candles Get rest of planets and more than 10 other algorithms to pred
FREE
Elliot Waves Master
Mahmoud Sabry Mohamed Youssef
Hello Everyone ,  I am not an Elliot pro , but I promise to let you see it in a different way , have you ever considered to see 3 probabilities of different time frames on same chart ? this will not only enhance your trades entry , but will give you confidence and certainty when everything is not clear. in my indicator you will be able to select 3 time frames of your choice , define number of candles per each time frame , give the color per each trend (Bearish or Bullish), not only that , you
フィルタ:
mohammed fathy
277
mohammed fathy 2022.07.09 18:35 
 

ユーザーは評価に対して何もコメントを残しませんでした

nourmediatv
54
nourmediatv 2022.07.03 23:36 
 

ユーザーは評価に対して何もコメントを残しませんでした

Mohamed Abdelrady
99
Mohamed Abdelrady 2022.06.29 21:33 
 

ユーザーは評価に対して何もコメントを残しませんでした

merhou
44
merhou 2022.06.27 23:18 
 

ユーザーは評価に対して何もコメントを残しませんでした

Lully
118
Lully 2022.06.27 21:57 
 

ユーザーは評価に対して何もコメントを残しませんでした

هيثم عطية
58
هيثم عطية 2022.06.27 11:15 
 

ユーザーは評価に対して何もコメントを残しませんでした

レビューに返信