• 概要
  • レビュー (4)
  • コメント (5)
  • 最新情報

Chart Drawing Cloner

5

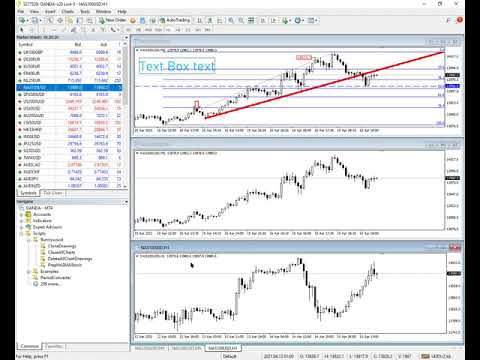
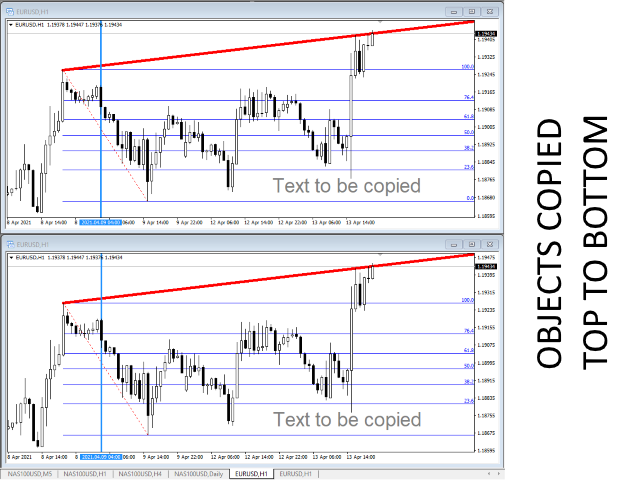
このスクリプトを使用すると、トレンド ライン、フィボナッチ リトレースメントなど、あらゆる種類の描画オブジェクトを 1 つ以上の他のチャートにコピーできます。


デフォルトでは、スクリプトは現在のチャート (スクリプトが適用されたチャート) のすべてのオブジェクトを、現在ロードされている同じシンボルの他のチャートにコピーします。


設定

目的地の時間枠

PERIOD_CURRENT 以外に設定すると、スクリプトが適用されたチャートと同じシンボルの開いているチャートにオブジェクトがコピーされます。

値を特定の時間枠、たとえば PERIOD_D1 に設定すると、同じ銘柄と期間のチャートのみが更新されます。

CopyObjectsOfType

これをコピーしたい特定のタイプのオブジェクトに設定すると、そのタイプのオブジェクトのみが他のチャートにコピーされます。

CopyIndicatorWindowObjects

True に設定すると、インジケータ ウィンドウのオブジェクトもコピーされます。これは、ソース チャートと同じ指標を同じ順序で持つ 2 番目のチャートに依存します。


チャート間のオブジェクトを心ゆくまで複製してください!


レビュー 4
Christian Astillero
1203
Christian Astillero 2022.03.08 14:52 
 

Perfect

CasiousD
784
CasiousD 2021.10.30 19:39 
 

2nd indicator I have from this author. Took some getting used to understanding how it interacts with other indicators already on the chart, but once I figured it out (I can be slow sometimes), works perfectly. As with the other indicator I have from this author (Multi Chart Crosshairs), this is going to make my market analysis so much easier! Thank you again!

Payman
663
Payman 2021.04.16 15:05 
 

its really cool because its the only copier that also copies the objects description i found. i wish i could exclude certain objects like buttons and labels. but anyways its already awesome. thanks

おすすめのプロダクト
VR Cub
Vladimir Pastushak
VR Cub は、質の高いエントリーポイントを獲得するためのインジケーターです。このインジケーターは、数学的計算を容易にし、ポジションへのエントリーポイントの検索を簡素化するために開発されました。このインジケーターが作成されたトレーディング戦略は、長年にわたってその有効性が証明されてきました。取引戦略のシンプルさはその大きな利点であり、初心者のトレーダーでもうまく取引することができます。 VR Cub はポジション開始ポイントとテイクプロフィットとストップロスのターゲットレベルを計算し、効率と使いやすさを大幅に向上させます。取引の簡単なルールを理解するには、以下の戦略を使用した取引のスクリーンショットを見てください。 設定、設定ファイル、デモ版、説明書、問題解決方法は、以下から入手できます。 [ブログ] レビューを読んだり書いたりすることができます。 [リンク] のバージョン [MetaTrader 5] エントリーポイントの計算ルール ポジションをオープンする エントリーポイントを計算するには、VR Cub ツールを最後の高値から最後の安値までストレッチする必要があります。
数列の一つに「森林火災数列」があります。これは、最も美しい新しいシーケンスの 1 つとして認識されています。その主な特徴は、このシーケンスが線形トレンドを回避することです。最短のものであってもです。この指標の基礎を形成したのはこのプロパティです。 財務時系列を分析する場合、この指標は可能なすべての傾向オプションを拒否しようとします。そして失敗した場合にのみ、トレンドの存在を認識し、適切なシグナルを発します。このアプローチにより、新しいトレンドの始まりの瞬間を正しく判断できます。ただし、偽陽性の可能性もあります。それらの数を減らすために、このインジケーターに追加のフィルターが追加されました。新しいバーが開くとシグナルが生成されます。いずれの場合も再描画は発生しません。 指標パラメータ: Applied Price - 適用価格定数; Period Main - インディケータのメイン期間、その有効な値は 5 ~ 60 です。 Period Additional - 追加の期間。このパラメーターの有効な値は 5 ~ 40 です。 Signal Filter - 追加の信号フィルター、有効
"The trend is your friend" is one of the best known sayings in investing, because capturing large trendy price movements can be extremely profitable. However, trading with the trend is often easier said than done, because many indicators are based on price reversals not trends. These aren't very effective at identifying trendy periods, or predicting whether trends will continue. We developed the Trendiness Index to help address this problem by indicating the strength and direction of price trend
The indicator shows the potential trend direction by cyclical-wave dependence. Thus, all the rays of the intersection will be optimal rays, in the direction of which the price is expected to move, taking into account the indicator period. Rays can be used as a direction for potential market movement. But we must not forget that the approach must be comprehensive, the indicator signals require additional information to enter the market.
Bigger chart labels would allow the user to be entirely aware of which chart he/she is on.  Each chart window is unique, containing different patterns and economic motives so acknowledging the chart window would be absolutely essential!  There are well known Economic Time Zones included in clear view, by choice!    Simple does it! Use your computing mouse scroller, clicking with the right finger on the label, in order to customize the label properties. From there, choose your preferred color,
FREE
Awesome Oscillator by Bill Williams with the ability to fine-tune and replace the averaging algorithms of the indicator, which significantly expands the possibilities of using this oscillator in algorithmic trading and brings it closer in its properties to such an indicator as the MACD. To reduce price noise, the final indicator is processed with an additional Smooth averaging. The indicator has the ability to give alerts, send mail messages and push signals when the direction of movement of th
Big Trend Signal   indicator is designed for trend and signal trading. This indicator generates trend signals.  It uses many algorithms and indicators to generate this signal. It tries to generate a signal from the points with the highest trend potential. This indicator is a complete trading product. This indicator does not need any additional indicators.  You can only trade with this indicator. The generated signals are displayed on the graphical screen.  Thanks to the alert features you can ge
トレンドキャッチャー: アラートインジケーター付きのトレンドキャッチャーストラテジーは、市場トレンドやポテンシャルなエントリーポイントやエグジットポイントを特定するのに役立つ多目的な技術分析ツールです。動的なトレンドキャッチャーストラテジーを備えており、市場状況に適応してトレンドの方向を明確に視覚化します。トレーダーは、自身の好みやリスク許容度に合わせてパラメーターをカスタマイズできます。このインジケーターはトレンドの識別を支援し、ポテンシャルなリバーサルをシグナルし、トレイリングストップのメカニズムとして機能し、市場への迅速な対応のためのリアルタイムアラートを提供します。 特徴: - トレンドの識別:上昇トレンドと下降トレンドをシグナルします。 - トレンドのリバーサル:ローソク足の色が上昇から下降に変わった場合やその逆の場合に、ポテンシャルなリバーサルを警告します。 - リアルタイムアラート:新しいトレンドの識別に対するアラートを生成します。 推奨事項: - 通貨ペア:EURUSD、AUDUSD、XAUUSDなど... - タイムフレーム:H1。 - アカウン
FREE
Hello friends. I wrote this utility specifically for use in my profile with a large number of Expert Advisors and sets ("Joint_profiles_from_grid_sets" https://www.mql5.com/en/blogs/post/747929 ). Now, in order to limit losses on the account, there is no need to change the "Close_positions_at_percentage_of_loss" parameter on each chart. Just open one additional chart, attach this utility and set the desired percentage for closing all trades on the account. The utility has the following function
FREE
Gvs Undefeated Trend   indicator is designed for trend and signal trading. This indicator generates trend signals.  It uses many algorithms and indicators to generate this signal. It tries to generate a signal from the points with the highest trend potential. This indicator is a complete trading product. This indicator does not need any additional indicators.  You can only trade with this indicator. The generated signals are displayed on the graphical screen.  Thanks to the alert features you ca
「一目均衡表」の専門的な使い方は、一目均衡表を正しく解釈してグラフを分析することです! はトレーダーが価格グラフ上の指定された点間の比率を素早く簡 単に測定できるようにするグラフィックプログラムです。この時間と価格の指標は、MT4 プラットフォームの一目の戦略に従って図表を分析するための基本的なツールです。この ツールを使用すると、 非常に短期間での価格波だけでなく、時間波の洞察に満ちた完全な 分析も可能になります。分析の実行に費やされる労力は、エクセルを使用して実行される 同様の測定および計算と比較して、何度も最小限に抑えられます。指標は、一目均衡表戦 略を使用するトレーダーの知識と経験、およびそれらの期待を考慮して設計されています。 提示されたツールは私たちの仕事の結果です。 指標のモジュール構造により、論理的な順序で分析を実行できます。このプロセスは過去 の波に関するデータを収集することから始まり、それが将来の市場の動きを計算するため の基礎となります。 計算で考慮されるデータは、予測の正確さにとって非常に重要です。 この操作は最小限に抑えられ、即座に測定値が得られます。 この測
Diamond PRO
Fanur Galamov
5 (9)
Diamond PRO is enhanced powerful version of Diamond for advanced traders. Pro version includes optimized cores, new impoved entry points filters, new multistage profit closure algorithm and сontains number of external control parameter that allows build and fine tune own tradind decisions and algorithms. The system provides more accurate market entries, analyzes and filters upcoming economic news, contains spread protection and an advanced position management algorithm. Main goal of Diamond PRO
This    Perfective Signal System   indicator is designed for signal trading. This indicator generates trend signals. It uses many algorithms and indicators to generate this signal. It tries to generate a signal from the points with the highest trend potential. This indicator is a complete trading product. This indicator does not need any additional indicators. The indicator certainly does not repaint. The point at which the signal is given does not change.     Features and Suggestions
The Arrow Scalper
Fawwaz Abdulmantaser Salim Albaker
1 (2)
Dear Friend..  I share with you this simple Expert Adviser .. it is full automatic  this Expert Adviser following the trend of the pair you install on or any stocks or indices , it is works like that: - when the trend on H4 chart show a start of up trend the expert will wait till the 15M & 1H charts show an up trend the EA will open a buy order directly , and do the same for down trend and open a sell order the buy or sell  order lot size and take profit and stop loss will measured manually  by
FREE
の紹介     Quantum平均足PRO チャート 市場のトレンドに対する明確な洞察を提供するように設計された平均足キャンドルは、ノイズを除去し、誤ったシグナルを排除する能力で知られています。混乱を招く価格変動に別れを告げ、よりスムーズで信頼性の高いチャート表現を導入しましょう。 Quantum Heiken Ashi PRO を真にユニークなものにしているのは、従来のローソク足データを読みやすい色のバーに変換する革新的なフォーミュラです。赤と緑のバーはそれぞれ弱気トレンドと強気トレンドをエレガントに強調し、潜在的なエントリーポイントとエグジットポイントを驚くほど正確に見つけることができます。 量子EAチャネル:       ここをクリック MT5のバージョン:       ここをクリック この注目すべき指標には、いくつかの重要な利点があります。 明確性の向上: 価格変動を平滑化することで、平均足バーは市場トレンドをより明確に表現し、有利な取引機会を特定しやすくします。 ノイズの削減: 誤ったシグナルを引き起こすことが多い不安定な価格変動に別れを告げます。 Quan
This is the complete REX package. It consists of the lite, pro and ULTRA version.  Perfect for beginners and intermediates. REX complete is 100% non repaint. The strategy is based on a mix of different strategies, statistics, including pivot points, oscillators and patterns.  As the trading idea consists of a variety of some classic indicators like Momentum, Williams Percent Range, CCI, Force Index, WPR, DeMarker, CCI, RSI and Stochastic, it is clear that the fundamental indicators have being
TLM Map AM
Andriy Matviyevs'kyy
TLM Map AM (Trend Line Momentum Map) is an indicator developed based on a set of digital technical analysis indicators described in the article by Vladimir Kravchuk: " Digital indicators in the technical analysis of financial markets ". The indicator displays in a separate window a complex of digital technical analysis indicators such as FTLM and STLM. Recommended for use in conjunction with the RTL Map AM (Reference Trend Line Map) indicator. The indicator has no customizable parameters.
FREE
Introduction It is common practice for professional trades to hide their stop loss / take profit from their brokers. Either from keeping their strategy to the themselves or from the fear that their broker works against them. Using this indicator, the stop loss / take profit points will be drawn on the product chart using the bid price. So, you can see exactly when the price is hit and close it manually.  Usage Once attached to the chart, the indicator scans the open orders to attach lines fo
RSI heatmap
Mr Pimook Chokdamrongsuk
Welcome to the world of trading and technical analysis. In today's fast-paced markets, understanding market sentiment and identifying potential entry and exit points is crucial for successful trading. One essential tool in a trader's arsenal is the Relative Strength Index, or RSI. And now, we introduce the Free RSI Heat Map, a powerful visualization tool that brings RSI data to life. RSI Heat Map offers a comprehensive overview of the RSI values across multiple instruments, allowing trade
FREE
LineBreakMT4
Nattadecha Tangpakinwat
Key Features: Type of Indicator: Line Break Chart Indicator Usage: Identifying trend reversals and potential market turning points. Input Parameters: The primary input parameter is 'Lines_Break,' which represents the number of lines the price needs to move to create a new line in the opposite direction. How it works: The indicator draws green and red histogram bars to represent the line break chart. Green bars indicate an upward trend, and red bars indicate a downward trend. The indicator calcul
FREE
The main idea of this indicator is rates analysis and prediction by Fourier transform. Indicator decomposes exchange rates into main harmonics and calculates their product in future. You may use the indicator as a standalone product, but for better prediction accuracy there is another related indicator - FreqoMaster - which uses FreqoMeterForecast as a backend engine and combines several instances of FreqoMeterForecast for different frequency bands. Parameters: iPeriod - number of bars in the ma
Strong Oscillator is an indicator designed to find indicator trends. It finds trends using a set of algorithms and a set of indicators. This indicator is a trend indicator. Helps to find trends easily. You can use this indicator alone, or you can use it as an auxiliary indicator for other strategically appropriate indicators. You can use it as a trend validation indicator. Suggestions and Features There are 4 level lines on the indicator. These level lines 5, 20 and 80 are 95 lines. 5, 20 le
Free automatic Fibonacci is an indicator that automatically plots a Fibonacci retracement based on the number of bars you select on the BarsToScan setting in the indicator. The Fibonacci is automatically updated in real time as new highest and lowest values appears amongst the selected bars. You can select which level values to be displayed in the indicator settings. You can also select the color of the levels thus enabling the trader to be able to attach the indicator several times with differe
FREE
Noize Absorption Index - is the manual trading system that measures the difference of pressure between bears forces and bulls forces. Green line - is a noize free index that showing curent situation. Zero value of index shows totally choppy/flat market.Values above zero level shows how powerfull bullish wave is and values below zero measures bearish forces.Up arrow appears on bearish market when it's ready to reverse, dn arrow appears on weak bullish market, as a result of reverse expectation. S
Taurus All4 Taurus All4 is a high-performance indicator, it will tell you the strength of the trend, and you will be able to observe the strength of the candle. Our indicator has more than 4 trend confirmations. It is very simple and easy to use. Confirmation Modes Candle Trend Confirmations: When the candle switches to light green the trend is high. When the candle switches to light red the trend is reverting down. When the candle changes to dark red the trend is low. Trendline Trend Conf
Alpha Trend
Evgeny Belyaev
3.33 (3)
Alpha Trend is a trend indicator for the MetaTrader 4 platform; it has been developed by a group of professional traders. The Alpha Trend indicator finds the most probable tendency reversal points, which allows making trades at the very beginning of a trend. This indicator features notifications, which are generated whenever a new signal appears (alert, email, push-notification). This allows you to open a position in a timely manner. Alpha Trend does not redraw, which makes it possible to evalua
The main idea of this indicator is rates analysis and prediction by Fourier transform. The indicator decomposes exchange rates into main harmonics and calculates their product in future. The indicator shows 2 price marks in history, depicting price range in the past, and 2 price marks in future with price movement forecast. Buy or sell decision and take profit size are displayed in a text label in the indicator window. The indicator uses another indicator as an engine for calculations - FreqoMet
The presented indicator allows you to determine potential entry points into the market and set protective orders at reasonable levels. This product can be useful for both beginners and experienced traders. The indicator is based on calculation methods proven by time and practicing traders. The indicator is calculated in two stages: At the first stage, linear regression (LR) of the selected price type is determined for a given number of chart periods. At the second stage, the obtained data is p
まず第一に、この取引ツールはノンリペイント、ノンリドロー、ノンラグの指標であり、プロの取引に理想的ですことを強調する価値があります。 スマートプライスアクションコンセプトインジケーターは、新米から経験豊富なトレーダーまで、非常 に強力なツールです。Inner Circle Trader AnalysisやSmart Money Concepts Trading Strategiesなど、20以上の有用な指標を1つに組み合わせています。このインジケーターはスマートマネーコンセプトに焦点を当て、大手機関の取引方法を提供し、彼らの動きを予測するのに役立ちます。 特に、流動性分析に優れており、機関がどのように取引しているかを理解しやすくしています。市場のトレンドを予測し、価格の動きを慎重に分析するのに優れています。機関の戦略とトレードを合わせることで、市場の動向についてより正確な予測ができます。このインジケーターは多目的であり、市場構造を分析し、重要な注文ブロックを特定し、さまざまなパターンを認識するのに優れています。 このインジケーターはBOSやCHoCHなどのパターンの識
MA CROSSES PRO MT4は移動平均クロスアローインジケーターです。インジケータパラメータには直感的な名前があり、各行は個別に構成されています。インジケータは、矢印を表示したり、音声信号を鳴らしたり、携帯端末や電子メールに通知を送信したりすることで、信号を通知できます。 インジケーターは再描画されません ろうそくの終わりにのみ信号 スキャルピングに最適 任意のペアと任意の時間枠で動作します 時間枠が古いほど、信号は良くなります アドオンとしてあらゆる取引戦略と互換性があります。 オプション: FASTER_MA-動きの速い移動期間; FASTER_MA_METHOD-高速移動平均法。 FASTER_MA_PRICE-中古価格; FASTER_MA_SHIFT-シフト; SLOWER_MA-動きの遅い移動期間。 SLOWER_MA_METHOD-動きの遅い平均化方法。 SLOWER_MA_PRICE-中古価格; SLOWER_MA_SHIFT-シフト; ALERT-ダイアログボックスを表示します。 PUSH_NOTIFICATIONS-モバイル端末に通
このプロダクトを購入した人は以下も購入しています
Trade Assistant MT4
Evgeniy Kravchenko
4.46 (181)
取引 ごとのリスクの 計算、新規注文 の 簡単 な 設置、部分的 な 決済機能 を 持 つ 注文管理、 7 種類 のトレーリングストップなど 、便利 な 機能 を 備 えています 。 注意、アプリケーションはストラテジーテスターでは機能しません。 Manual, Description, Download demo ライン機能 チャート上にオープニングライン、ストップロス、テイクプロフィットを表示します。この機能により、新規注文を簡単に設定することができ、注文を出す前にその特徴を確認することができます。   リスク計算 リスク計算機能は、設定されたリスクとストップロス注文のサイズを考慮して、新規注文のボリュームを計算します。ストップロスの大きさを自由に設定できると同時に、設定したリスクを守ることができます。 Lot calc ボタン - リスク 計算 を 有効 / 無効 にします 。 Risk フィールドでは 、必要 なリスクの 値 を 0 から 100 までのパーセンテージまたは 預金通貨 で 設定 します 。 設定」 タブで 、 リスク 計算 の 種類 を 選択 します :
価格が一瞬で変わる可能性のある市場では、注文はできるだけ簡単にすべきだと思いますか? Metatraderでは、注文を開くたびに、開始価格を入力し、損失を止めて利益を得るウィンドウと、取引サイズを開く必要があります。金融市場の取引では、初期預金を維持し、それを増やすために資本管理が不可欠です。それで、あなたが注文をしたいとき、あなたはおそらくあなたがどれくらいの大きさの取引を開くべきか疑問に思いますか?この単一の取引であなたの預金の何パーセントを危険にさらすべきですか?この取引からどれだけの利益を得ることができますか?また、リスクに対する利益の比率はどのくらいですか?トレードサイズを設定する前に、トレードサイズがどうあるべきかという質問に対する答えを得るために必要な計算を行います。 これらすべてを自動的に行うツールがあると想像してみてください。チャートを開き、市場分析を行い、エントリーポイント、ディフェンスポイント(ストップロス)、ターゲット(テイクプロフィット)を水平線でマークし、最後にリスクのレベルを定義します。利用可能な資本の%として、このトランザクションで負担することができ、こ
Local Trade Copier EA MT4
Juvenille Emperor Limited
5 (80)
Local Trade Copier EA MT4 による、驚くほど高速な取引コピーを体験してください。1分で簡単にセットアップできるこの取引コピー機は、同じWindowsコンピュータまたはWindows VPS上の複数のMetaTrader端末間で取引をコピーすることができ、0.5秒未満の高速コピースピードを実現します。 初心者であろうとプロのトレーダーであろうと、 Local Trade Copier EA MT4 には、あなたの特定のニーズに合わせてカスタマイズするための幅広いオプションが用意されています。これは、利益の可能性を高めたい人にとって究極のソリューションです。 今すぐ試してみて、これが市場で最も速くて簡単なトレードコピー機である理由を理解してください。 ヒント: デモアカウントで Local Trade Copier EA MT4 デモバージョンをダウンロードして試すことができます: ここ ダウンロードした無料のデモ ファイルを MT4 >> ファイル >> データ フォルダを開く >> MQL4 >> Experts フォルダに貼り付けて、ターミナルを再起動し
The product will copy all telegram signal to MT4   ( which you are member  ) , also it can work as remote copier.  Easy to set up, copy order instant, can work with almost signal formats, image signal, s upport to translate other language to English Work with all type of channel or group, even channel have "Restrict Saving Content", work with  multi channel, multi MT5 Work as remote copier: with signal have ticket number, it will copy exactly via ticket number. Support to backtest signal. How to
MT4 to Telegram Signal Provider は使いやすく、完全にカスタマイズ可能なツールで、Telegramに信号を送信し、あなたのアカウントを信号提供者に変えることができます。 メッセージのフォーマットは 完全にカスタマイズ可能です! しかし、簡単な使用のために、あらかじめ定義されたテンプレートを選択し、メッセージの特定の部分を有効または無効にすることもできます。 [ デモ ]   [ マニュアル ] [ MT5バージョン ] [ Discordバージョン ] [ Telegramチャンネル ] セットアップ ステップバイステップの ユーザーガイド が利用可能です。 Telegram APIの知識は必要ありません。開発者が必要なものをすべて提供します。 主要機能 購読者に送信される注文の詳細をカスタマイズする機能 例えばブロンズ、シルバー、ゴールドなど、階層型のサブスクリプションモデルを作成できます。ゴールドサブスクリプションでは、すべての信号が得られますなど。 ID、シンボル、またはコメントによる注文のフィルタリング 注文が実行されたチャート
TradePanel MT4
Alfiya Fazylova
4.91 (87)
Trade Panel は、多機能の取引アシスタントです。 このアプリケーションには手動取引用に設計された 50 以上の機能が含まれており、ほとんどの取引アクションを自動化できます。 購入する前に、デモ アカウントでデモ バージョンをテストできます。 デモ版 こちら 。 詳細な説明は こちら 。 アプリケーションの主な機能: 任意のシンボル(外国為替、CFD、先物など)で機能します。 無制限の文字数での同時作業。 取引ごとのリスクの自動計算とストップロスとテイクプロフィットの比率の設定。 OCO注文を行うことができます(一方が他方をキャンセルします-1つの注文を実行すると別の注文がキャンセルされます)。 タスクを含む行を設定できます(ポジションを開く、保留中の注文を開く、またはグループごとに注文を閉じる)。 仮想テイクプロフィットとストップロスを設定できます。 成行注文を反転またはロックできます。 6種類のトレーリングストップ。 ストップロスを損益分岐点に設定する機能があります。 ポジションを部分的にクローズする機能があります(利益または損失の一部をクローズします)。 価格が特定のライ
Tired of complex order placement and manual calculations? Trade Dashboard is your solution. With its user-friendly interface, placing orders becomes effortless, by a single click, you can open trades, set stop loss and take profit levels, manage trade lot size, and calculate risk to reward ratios, allowing you to only focus on your strategy. Say goodbye to manual calculations and streamline your trading experience with Trade Dashboard. Download   demo version  right now. You can find details
あなたの外国為替ポートフォリオを管理してください。あなたが立っている場所、何が働いているのか、そして何があなたに痛みを引き起こしているのかを即座に見てください! ここで利用可能なMT5バージョン:https:// www.mql5.com/en/market/product/58658 Trade Managerダッシュボードは、外国為替市場での現在の各ポジションが一目でわかるように設計されており、リスク管理と通貨へのエクスポージャーを理解しやすくします。 複数のポジションで徐々に市場に参入するトレーダー、またはそれらのトレーディンググリッドとバスケット戦略にとって、これは重要な情報です。ターミナル内の複数の位置を監視することは、管理が難しいことがよくあります。 不十分なリスクの活用と使用:報酬は、新しいトレーダーや一部の経験豊富なトレーダーが直面する主要な問題です。トレードマネージャーは、各通貨へのエクスポージャーを個別に示し、一度に両方向に取引しないようにします。 特徴: オープントレード-通貨ペアでソートされた現在のオープントレードをすべて表示します。ペアだけでなく
Trade Manager は、リスクを自動的に計算しながら、取引を迅速に開始および終了するのに役立ちます。 過剰取引、復讐取引、感情的な取引を防止する機能が含まれています。 取引は自動的に管理され、アカウントのパフォーマンス指標はグラフで視覚化できます。 これらの機能により、このパネルはすべてのマニュアル トレーダーにとって理想的なものとなり、MetaTrader 4 プラットフォームの強化に役立ちます。多言語サポート。 MT5バージョン  |  ユーザーガイド + デモ Trade Manager はストラテジー テスターでは機能しません。 デモについてはユーザーガイドをご覧ください。 危機管理 % または $ に基づくリスクの自動調整 固定ロットサイズを使用するか、ボリュームとピップに基づいた自動ロットサイズ計算を使用するオプション RR、Pips、または価格を使用した損益分岐点ストップロス設定 トレーリングストップロス設定 目標に達したときにすべての取引を自動的に終了するための 1 日あたりの最大損失 (%)。 過度のドローダウンからアカウントを保護し、オーバートレードを防ぎま
Trade copier MT4
Alfiya Fazylova
4.67 (30)
Trade Copierは、取引口座間の取引をコピーして同期するように設計された専門的なユーティリティです。 コピーは、同じコンピューターまたはvps にインストールされている、サプライヤーのアカウント/端末から受信者のアカウント/端末に行われます。 購入する前に、デモ アカウントでデモ バージョンをテストできます。 デモ版 こちら 。 詳細な説明は こちら 。 主な機能と利点: MT5ネッティングアカウントを含む、MT4> MT4、MT4> MT5、MT5> MT4のコピーをサポートします。 高いコピー速度(0.5秒未満)。 ベンダーモードと受信者モードは同じ製品内に実装されています。 チャートから直接リアルタイムでコピーを制御できる、簡単で直感的なインターフェイス。 接続が切断されたり、端末が再起動されたりしても、設定と位置が失われることはありません。 コピーするシンボルを選択できます。また、受信者のシンボルを置き換えることもできます(例:EURUSD> USDJPY)。 バックコピーをサポートします。 特定の注文のみのコピーを有効にする機能。 取引開始価格の最大差と最大遅延時間を
The top-selling EAs on the market cost a lot and one day they are suddenly gone. This is because one strategy will not work in the forex market all the time. Our product is unique from all others in the MQL Marketplace because our EA comes with 34+ built-in indicators that allow adding more strategies every time.  You build your strategy and keep updating it. If one strategy does not work, simply build another all using only one EA. This is All-In-One EA in this market place. You can use as trad
-25% discount ($199 -> $149) Advanced trading tool: One click smart orders that execute under your conditions Developed by trader for trading community:  position size calculator (lot size), open position after price action, strategy builder, set and forget trading, mobile notifications... Risk Management -  Risk percentage position size calculator, gain percentage, target risk reward ratio, spread and commissions are included in calculations 7 Advanced order types   - Set and forget trading
Exp COPYLOT CLIENT for MT4
Vladislav Andruschenko
4.66 (67)
MetaTrader4のコピー機を取引します。     それは任意の口座からの外国為替取引、ポジション、注文をコピーします。 それは最高の貿易コピー機の1つです     MT4 - MT4、MT5 - MT4     のために     COPYLOT MT4     バージョン(または     MT4 - MT5  MT5 - MT5     のために     COPYLOT MT5     バージョン)。 MT5のバージョン 完全な説明   +DEMO +PDF 購入する方法 インストールする方法     ログファイルの取得方法     テストと最適化の方法     Expforex のすべての製品 のコピー機 バージョン       MetaTrader 5 ターミナル(   МТ5 - МТ5、МТ4 - МТ5   )-   コピーロットクライアントMT5 独自のコピーアルゴリズムにより、すべての取引がマスターアカウントからクライアントアカウントに正確にコピーされます。 また、動作速度が速いことでも知られています。タフなエラー処理。 強力な機能セット。 プログ
KT Equity Protector MT4
KEENBASE SOFTWARE SOLUTIONS
3 (2)
KT Equity Protector EA consistently monitors the account equity and closes all the market and pending orders once the account equity reached a fixed equity stop loss or profit target.  After closing all trading positions, the EA can close all open charts to stop other expert advisors from opening more trading positions. Equity Stop-Loss If your current account balance is $5000 and you set an equity stop loss at $500. In this case, the KT Equity Protector will close all the active and pending
取引パネルは注文の管理に限定されています - ボタンを使用して開かれたものと、ユーザーによって開かれたものの両方です。 シンプルで便利なコレクション。 バイヤーを補完します。 Gold Stuff インジケーターと併用することをお勧めします。 単一注文として取引を設定し、距離のあるグリッドを構築します。 標準グリッドを作成するには、10000 などの大きな距離を設定するだけです。 リアルタイム結果はこちらからご覧いただけます。 設定と個人的なボーナスを得るために、購入後すぐに私に連絡してください!   設定 新しいシリーズを開く - 注文の新しいシリーズのオン/オフの開始。 Lot miltiplier - 次の注文のロット乗数。 TP - ピップで利益を得る。 SL - 最初の注文からのピップ単位のストップロス。 トレイル スタート - トレーリング ストップの有効化。 トレイル ステップ - トレーリング ストップを有効にしたときの価格からの距離。 DD 削減アルゴリズム - 利益のある最後の注文が損失のある最初の注文シリーズでクローズされる場合のドローダウン削減
DrawDown Limiter MT4
Haidar, Lionel Haj Ali
5 (9)
Drawdown Limiter EA You are in the right place if you were searching for Drawdown control, Drawdown limiter, Balance protection, Equity Protection or Daily Drawdown Limit related to Prop Firm, FTMO, or Funded account trading, or if you want to protect your trading account. Have you suffered from controlling your drawdown when trading funded accounts? This EA is meant for you. Prop firms usually set a rule called “Trader Daily Drawdown”, and if it is not respected, you are disqualified.  I am an
VirtualTradePad mt4 Extra
Vladislav Andruschenko
4.88 (60)
ワンクリックで取引できるトレーディングパネル。ポジションと注文の操作!チャートまたはキーボードから取引。 手動取引用の取引パネル。チャート(チャートウィンドウ)またはキーボードから取引できます。開閉、リバース、ロックポジションと注文を処理する МetaТrader4のメインオーダーのトレーディングコントロールパネル:売買、売却、売却、売却、売却、閉じる、削除、修正、トレーリングストップ、ストップロス、takeproft MT5のバージョン 完全な説明   +DEMO +PDF 購入する方法 インストールする方法     ログファイルの取得方法     テストと最適化の方法     Expforex のすべての製品 シンボルウィンドウからの取引とキーボードからの取引! あなたはMetaTrader 4ターミナル - バーチャルコントロールパネルVirtualTradePadのためのユニークなプラグインを持っています。 Description on English 注意!  ストラテジーテスターの 取引方法を学びたい場合は、無料の TesterPad ユーティリティをチェック
The most advanced news filter and drawdown limiter on MQL market NEW: Take a Break can be backtested against your account history! Check the " What's new " tab for details. Take a Break has evolved from a once simple news filter to a full-fledged account protection tool. It pauses any other EA during potentially unfavorable market conditions and will continue trading when the noise is over. Typical use cases: Stop trading during news/high volatility (+ close my trades before). Stop trading when
The product will copy all  Discord  signal   to MT4   ( which you are member  ) , also it can work as remote copier.  Easy to set up. Work with almost signal formats, support to translate other language to English Work with multi channel, multi MT4. Work with Image signal. Copy order instant, auto detect symbol. Work as remote copier: with signal have ticket number, it will copy exactly via ticket number. How to setup and guide: Let read all details about setup and download Discord To MetaTrade
あなたがメンバーである任意のチャンネル(プライベートおよび制限されたチャンネルを含む)からのシグナルを、直接あなたのMT4にコピーします。 このツールは、ユーザーを念頭に置いて設計されており、取引を管理および監視するために必要な多くの機能を提供しています。 この製品は、使いやすく視覚的に魅力的なグラフィカルインターフェースで提供されています。設定をカスタマイズして、数分で製品を使用開始できます! ユーザーガイド + デモ  | MT5版 | Discord版 デモを試したい場合は、ユーザーガイドを参照してください。 Telegram To MT5レシーバーは、ストラテジーテスターでは機能しません! Telegram To MT4の特長 一度に複数のチャンネルからシグナルをコピー プライベートおよび制限されたチャンネルからシグナルをコピー BotトークンやチャットIDは不要です(必要な場合は引き続き使用できます) リスク%または固定ロットを使用して取引 特定のシンボルを除外 すべてのシグナルをコピーするか、コピーするシグナルをカスタマイズするかを選択 すべてのシグナルを認識する
Mentfx Mmanage
Anton Jere Calmes
5 (16)
The added video will show you the full functionality, effectiveness, and simplicity of this trade manager. Drag and Drop Trade Manager. Draw your entry and have the tool calculate the rest. Advanced targeting and close portions of a trade directly available in tool (manage trades while you sleep). Market order or limit order on either side with factored spread. Just draw the entry, the tool does the rest. Hotkey setup to make it simple. Draw where you want to enter, and the stop loss, the tool c
Trade Copier Pro is a tool to copy trade remotely between multiple MT4/MT5 accounts at different computers/locations over internet. This is an ideal solution for signal provider, who want to share his trade with the others globally on his own rules. One provider can copy trades to multiple receivers and one receiver can get trade from multiple providers as well. The provider can even set the subscription expiry for each receiver, so that receiver will not be able to receive the signal after that
The Expert Advisor will help you forward all pop-up alert with screenshot from  MetaTrader 4 to Telegram channel/ group, also forward all notifications to Telegram. Parameters  -  Telegram Bot Token - create bot on Telegram and get token.  -  Telegram Chat ID  - input your Telegram user ID,  group / channel ID  -  Forward Alert - default true, to forward alert.  -  Send message as caption of Screenshot - default false, set true to send message below Screenshot  How to setup and guide  - Telegram
Grid Manual MT4
Alfiya Fazylova
4.71 (17)
「Grid Manual」は、注文のグリッドを操作するための取引パネルです。 ユーティリティはユニバーサルで、柔軟な設定と直感的なインターフェイスを備えています。 それは、損失を平均化する方向だけでなく、利益を増やす方向でも注文のグリッドで機能します。 トレーダーは注文のグリッドを作成して維持する必要はありません。 すべてが「Grid Manual」によって行われます。 注文を開くだけで十分であり、「Grid Manual」は注文のグリッドを自動的に作成し、非常に閉じるまでそれに付随します。 ユーティリティの主な機能と機能 ユーティリティは、モバイル端末から開かれた注文を含め、あらゆる方法で開かれた注文を処理します。 「制限」と「停止」の2種類のグリッドで機能します。 グリッド間隔の計算には、固定と動的(ATRインジケーターに基づく)の2つの方法で機能します。 オープンオーダーグリッドの設定を変更できます。 チャート上の各注文グリッドの損益分岐点を表示します。 各注文グリッドの利益率を表示します。 ワンクリックでグリッドから収益性の高い注文を閉じることができます。 ワンクリックで各注文
MT4のエキスパートアドバイザーリスクマネージャーは非常に重要であり、私の意見ではすべてのトレーダーにとって必要なプログラムです。 このエキスパートアドバイザーを使用すると、取引口座のリスクを管理することができます。リスクと利益の管理は、金銭的およびパーセンテージの両方で実行できます。 エキスパートアドバイザーが機能するには、それを通貨ペアチャートに添付し、許容可能なリスク値を預金通貨または現在の残高の%で設定するだけです。 PROMO BUY 1 GET 2 FREE -   https://www.mql5.com/en/blogs/post/754725 アドバイザ機能 このリスクマネージャーは、リスクの管理を支援します。 -取引のために -1日あたり - 1週間 - ひと月ほど 制御することもできます 1)取引時の最大許容ロット 2)1日あたりの最大注文数 3)1日あたりの最大利益 4)エクイティを引き受ける利益を設定する それだけではありません。設定で自動設定を指定した場合、アドバイザーはデフォルトのSLとTPを設定することもできます。
MT4 Alert Signal Trader  is an EA that helps you trade MT4 Alert popup. Some indicators can provide signals by showing an alert popup containing signal texts. This EA will read and trade these signal texts. The alert texts should contain at least 2 elements:  (1) a symbol text   (ex: "EURUSD") and  (2) a command type   (ex: "Buy", "Sell", "Close") that trigger EA's trading activities. Some other contents that may have or not are open price, stop loss, take profit values... The EA needs an aweso
OrderManager をご紹介:MT4用の革新的なユーティリティ 新しく設計されたOrder Managerユーティリティを使用して、MetaTrader 4での取引をプロフェッショナルなものにしましょう。シンプルさと使いやすさに焦点を当てたこのユーティリティは、各取引に関連するリスクを簡単に定義し、視覚化できます。これにより、情報に基づいた意思決定が可能になり、取引戦略を最適化できます。OrderManagerに関する詳細は、マニュアルをご参照ください。 [ マニュアル ] [ MT5 バージョン ] [ Telegram チャンネル ] 主な特長: リスク管理:取引のリスクを素早く簡単に定義し、より良い意思決定を行い、取引パフォーマンスを向上させます。 視覚表現:オープンなポジションとそれに関連するリスクをグラフィカルに表示し、明瞭かつ簡潔な理解が可能です。 注文変更:数回のクリックで注文を簡単に変更またはクローズし、取引プロセスを効率化し、貴重な時間を節約します。 手のひらの上の最新ニュース:ボタン一つで最新の市場ニュースに常にアクセスできます。 MT4トレーダーにと
-  Version MT5  (Coming soon) An instrument capable of instantly calculating position size or risk based on a specified stop-loss level is critically important for both professional traders and beginners. Trading utility  TRADE PRO   provides fast and accurate calculations, helping you make decisions in conditions of limited time and increased market volatility. Main functions: Original. Simple. Effective. Original and convenient opening of the main trading panel: Simply hover your mouse over th
FREE SIGNAL CHANEL:  https://t.me/redfox_daily_forex_signals Time saving and fast execution Whether you’re traveling or sleeping, always know that Telegram To Mt4 performs the trades for you. In other words, Our   Telegram MT4 Signal Trader  will analyze the trading signals you receive on your selected Telegram channels and execute them to your Telegram to MT4 account. Reduce The Risk Telegram To Mt4   defines the whole experience of copying signals from   Telegram signal copier to mt4  p
ADAM EA Special Version for FTMO  Our 1st EA created using ChatGPT technology Trade only GOOD and checked PROP FIRMS  Default parameters for Challenge $100,000 Tested on EURUSD and GBPUSD only  Use 15MIN Time Frame Close all deals and Auto-trading  before Weekend at 12:00 GMT+3  Friday For Prop Firms MUST use special Protector  https://www.mql5.com/en/market/product/94887 Signal using ADAM  https://www.mql5.com/en/signals/2190554 --------------------------------------------------------------
作者のその他のプロダクト
このインジケーターは、さまざまなタイムスケールでの多くのチャートのレビューをより迅速かつ簡単に行えるように設計されています。 複数のチャートで時間と価格を追跡 1 つのチャートでシンボルを変更すると、同じシンボルの他のすべてのチャートも変更されます。 使いやすく、すぐにマスターできます このインジケーターを使用すると、同じシンボルで開いている他のすべてのチャートで、マウス ポインターが現在のチャートにある価格と時間を特定できます。これにより、複数のチャートで情報をすばやく確認できますが、通常は同じ場所を特定するのに時間がかかります。 開いているすべてのチャートで時間だけを追跡することもできます。これにより、発散ハンティング時に簡単にナビゲートできます。 1 つのチャートでシンボルを変更すると、同じシンボルの他のすべてのチャートが新しいシンボルに切り替わり、時間枠の設定が維持されます。 使い方 チャートを確認するとき、傾向と取引レベルを特定するために、いくつかの時間枠を見るのが好きです。このツールを作成したのは、それを支援するためであり、長期にわたっていくつかのチャートを見渡すビジュア
This indicator draws the prior Highs and Lows for multiple timeframes, and can display potential Take Profit and Stop Loss levels. In Rob Smith's # The Strat  terms, these are potential entry points, or alternatively potential targets for open positions. I like to use them in both ways. On a lower timeframe, say 5 minutes to get a good entry on a daily or weekly level, and then as a potential target. Very small stops required giving an excellent risk/reward ratio. Key Features  - Levels from Ho
TheStrat Monitor
Robert Gerald Wood
3 (2)
If you've not already learnt about The Strat trading strategy , go google it now. I promise it won't be a waste of your time, and you will likely learn some new tricks whether you use it or not. OK, so now you know what TheStrat is, you will be able to understand what this indicator can do for you. Key Features In short, the Indicator will: Show Timeframe Continuity for all supported timeframes Supports two timeset views, Day trader and Swing trader Show when Full Timeframe Continuity is in pl
This indicator draws the prior Highs and Lows for multiple timeframes, and can display potential Take Profit and Stop Loss levels. In Rob Smith's # The Strat   terms,   these are potential entry points, or alternatively potential targets for open positions. I like to use them in both ways. On a lower timeframe, say 5 minutes to get a good entry on a daily or weekly level, and then as a potential target. Very small stops required giving an excellent risk/reward ratio. Please watch the DEMO video
TheStrat Candles
Robert Gerald Wood
4.5 (2)
この指標は、以下に基づいて各ろうそくの上または下にラベルを描画します。     ロブ・スミス     ストラト   それらがチャート上で時間の経過とともに発展するにつれて。 価格が変化するにつれて、ろうそくは 3 つの状態を切り替えることができます。ローソク足が最初に開いたとき、それが前のローソク足の高値と安値の中に完全に収まっている場合、タイプ 1 として開始されます。タイプ 2 であり、値動きが不安定で方向性がない場合、前のローソク足の反対側を壊してタイプ 3 になる可能性があります。 キャンドル 各キャンドルは、前のキャンドルとの関係によって定義されます。 タイプ 1 - ろうそくの内側 - ろうそくは完全に前のろうそくの高値と安値の範囲内にあります。ろうそくの内側は、市場が優柔不断であることを示しています。 タイプ 2 - トレンド ローソク足 - ローソク足は、前のローソク足の高値または安値のいずれかの上または下に伸びますが、両方ではありません。 タイプ 3 - ろうそくの外側 - ろうそくは前のろうそくの高値と安値の両方を破っています。外側のローソク
This indicator is designed to make reviews of many charts on different timescales quicker, and easier to do. Track Time and Price across multiple charts Change Symbol on one chart and all other charts of the same symbol will be changed too. Easy to use, quick to master The indicator allows you to identify the price and time where the mouse pointer is on the current chart, across all other charts open on the same Symbol. This allows you to quickly see information on multiple charts whereas normal
This indicator will draw patterns based on Rob Smith's The Strat as they emerge in real time on your chart. As price evolves, TheStrat offers 18 distinct price action patterns that can help you get good entries in the market. Each pattern involves two or three candles, and this indicator will draw a bounding box around the candles and name the pattern. The indicator also shows when a potential setup is forming, known by stratters as an Actionable signal. Candles Each candle is defined by i
This indicator will draw a label above or below each candle based on   Rob Smith's   The Strat   as they develop over time on your chart. As price evolves, a candle can switch between three states. When the candle first opens, if it sits completely within the previous candles high and low, then it will start as a Type 1. As time moves on, if it breaks either the high or low of the previous candle, it will be come a type 2, and should the price action be volatile and directionless, it may then
The Strat を使用して取引する場合、複数の時間枠に注意することが重要です。 このインジケーターは、各時間枠の現在のローソク足の毎日、毎週、毎月、および四半期ごとの状態を示します。 円のアイコンは、その時間枠のろうそくが現在インサイド、または TheStrat 用語でタイプ 1 であることを示します。 Inside Day ローソク足が値動きを強化しており、レンジのブレイクアウトを探しています。 上向きまたは下向きの三角形のアイコンは、トレンド キャンドル、または TheStrat 用語ではタイプ 2 です。トレンドろうそくは強気または弱気のいずれかであり、以前のろうそくの範囲を突破し、現在一方向にトレンドになっていることを示します. 正方形のアイコンはアウトサイド キャンドル、またはストラト用語でタイプ 3 です。これは 2 つのことを示しています。1 つはその時間枠での方向性について価格が未定であり、おそらく非常に途切れ途切れであるということです。もう 1 つは、より短い時間枠では短い反転取引を行う良い機会がある可能性が高いということです。正方形は強気または弱気の色になり、ど
Rob Smith の TheStrat について学んでいるときにこの単純なインジケーターを作成しましたが、とても役立つと思いました。共有したいと思います。役に立つと思われる場合は、私が MQL5 で公開した他の指標を見てください。 このインジケーターは、より高い時間枠から選択した価格レベルを示す単一の線をチャートに描画するだけです。 設定を使用すると、表示される時間枠を完全に制御できますが、デフォルトでは 、スケールを 1 ステップ上げるだけで、より高い時間枠自体が計算されます。たとえば、H1 チャートを開くと、H4 チャートのデータが表示されます。 設定 トラックタイムフレーム 価格レベルが引き出される時間枠を選択します。現在のデフォルト設定のままにしておくと、適切な時間枠が選択されます。線は常に上向きに調整されるため、チャートを確認して時間枠を変更する場合、これは非常に役立ちます。 トラックバリュー 下記の標準価格からお選びいただけます。デフォルトは始値です。 PRICE_CLOSE 終値 PRICE_OPEN 始値 PRICE_HIGH 期間中の最高価格 PRICE_LO
FREE
This script allows you to toggle the "Show Trade Levels" option, but for the current chart only. Normally, you can only change the setting using the Options -> Chart menu for ALL charts, but this script allows you to do it for a SINGLE chart. I'm using it when I take screenshots, because most of the time I'm not trying to show the trades, just some functionality of one of my other tools. Iif you need that functionality, then this script is very helpful! If the script helps you, please let me
FREE
A simple script that can delete all the drawing objects on a chart, or just the objects of a specific type. Settings: DeleteObjectsOfType By default the value will be blank which means ALL drawing objects on the chart will be deleted. If you only wish to delete specific types of drawing object, change this setting to the type of object to delete. For example, Fibonacci Retracement, Text, Label or Trend Line. Please see the demonstration video for more information.
FREE
FTFC は、Rob Smith の The Strat で定義されている Full Timeframe Continuity を指します。 このインジケーターはチャートに 2 本の線を引きます。四半期、月次、週次、日次、または時間次の開始レベルの最高値の 1 つと、これらの値の最低値の 2 つ目です。これにより、取引が一方向に非常に強くなる可能性が高いチャネルより上または下のチャネルが得られます。ライン間では、価格アクションが途切れ途切れになり、より広いストップを使用する必要がある場合があります. 高値と安値の中間点を示すために、3 番目の破線も描画されます。これは、市場が価格を特定の方向に押し上げようとするため、サポートまたはレジスタンスを見つけるのに適した場所です。色を NONE に設定して選択すると、この行をオフにすることができます。 設定 四半期ごとのレベルを含める 一部の人々はそれを無視することを好むため、四半期の始値を計算に含めることを選択できます。 IncludeCurrentTimeframeOpen true の場合、現在表示されている時間枠が H1、D1、W1
市場はラウンド数を非常に好み、下落市場ではサポートとして機能し、価格が上昇するとレジスタンスとして機能することがよくあります。 この指標は、ラウンド値で価格レベルを描画するように設計されています。これは自動的に行われますが、それをオーバーライドして表示するレベルを決定するオプションもあります。 ラウンド レベルは、10、20、30 などの 10 のステップと同じくらい単純にすることができます。また、外国為替を使用している場合は、0.1 または 0.01 での変化を見たいと思うかもしれません。 インジケーターは、メジャーとマイナーの 2 つのクラスの線をそれぞれ異なる形式で描画します。これにより、レベルの 2 つの異なる変化の間の変化を同時に見ることができます。 アラート このインジケーターには、価格が設定可能な距離内にある場合に、メジャー、マイナー、または両方の価格レベルでアラートを鳴らす機能が含まれています。 自動セットアップ デフォルトでは、指標はメジャー価格とマイナー価格の両方の適切なレベルを決定します。これは、いつでも画面に表示する行数を制御する構成可能な Densi
The Strat を使用して取引する場合、複数の時間枠に注意することが重要です。 このインジケーターは、各時間枠の現在のローソク足の毎日、毎週、毎月、および四半期ごとの状態を示します。 円のアイコンは、その時間枠のろうそくが現在インサイド、または TheStrat 用語でタイプ 1 であることを示します。 Inside Day ローソク足が値動きを強化しており、レンジのブレイクアウトを探しています。 上向きまたは下向きの三角形のアイコンは、トレンド キャンドル、または TheStrat 用語ではタイプ 2 です。トレンドろうそくは強気または弱気のいずれかであり、以前のろうそくの範囲を突破し、現在一方向にトレンドになっていることを示します. 正方形のアイコンはアウトサイド キャンドル、またはストラト用語でタイプ 3 です。これは 2 つのことを示しています。1 つはその時間枠での方向性について価格が未定であり、おそらく非常に途切れ途切れであるということです。もう 1 つは、より短い時間枠では短い反転取引を行う良い機会がある可能性が高いということです。正方形は強気または弱気の色になり、ど
ピボット レベルは、すべての市場で認められている確立された技術レベルです。 このインジケーターは、任意のシンボルについて、現在の四半期ごと、月ごと、週ごと、日ごと、および 4 時間ごとのピボットをチャートに描画します。また、各期間のサポート レベルとレジスタンス レベルを表示し、レベル 1 ~ 4 から表示するものを選択することもできます。     次の中からピボットのタイプを選択します。 標準 カマリリャ デマーク ウッディ フィボナッチ 元の仕様に従って、DeMark ピボットには単一のサポート レベルとレジスタンス レベルがあることに注意してください。 インジケーター ウォールは、ラインが価格に触れた場合、ラインの描画方法を変更します。これは非常に役立ち、ラインのサポートまたは抵抗の強さは、一度触れると大幅に減少します. 期間ごとに、予測されたピボット レベルを表示するように選択できます。これは通常のピボットと同じ計算を使用しますが、現在不完全な時間枠で機能します。そのため、価格がその範囲の大部分をすでにカバーしている、その期間の終わりに向かって使用するのが最適です。 設定
平均真の範囲(ATR)は、設定された期間における価格の変動量を測定するために一般的に使用される指標です。しかし、それが与える値はいかなる種類の境界内でも定義されていないため、ストップロスや利益計算以外の目的で使用することはほとんど不可能です。 このインジケーターは標準のATRインジケーターですが、極端な値を確認できるようにパーセンタイル境界を導入しています。 パーセンタイルとスプリットメディアンと呼ばれるものから選択できます パーセンタイルレベル パーセンタイルレベルは1%、5%、20%、50%、80%、95%、99%で描画され、これらは価格が他のすべての値との関係である場所を示しています。たとえば、5%レベルは、境界線より下では、ATR読み取り値の5%のみが低くなり、99%は、そのレベルより上のATR値のうち、値の1%のみが高くなることを示します。 80%を超えると、新しい取引のためにポジションサイズを小さくすることを選択できます。また、95%を超えると、勢いが変わる前に利益を得る良い機会になる可能性があります。 分割中央値 Split Medians設
範囲の枯渇は、価格が現在の期間の予想される範囲を満たすか超えると発生します。これらのレベルでは、価格は期間の初期に比べて勢いを失い始めるため、新しいポジションをとっていないことを確認するのに良いポイントです. このインジケーターは、チャート上でこれが発生する可能性が高い場所を示し、日次、週次、月次の期間のレベルを示します。 価格がこれらの枯渇レベルを超えている場合は、動きの背後にある勢いが非常に強く、より高い時間枠レベルに向かっている可能性が高いことを示しています. インジケーターは、好みに応じて、Average True Range (ATR) または Average Range (ADR) 計算を使用できます。デフォルトでは、外国為替チャートでよりうまく機能することがわかっているため、ATR を使用しますが、ADR は株式ベースのインデックスとシンボルで優位に立っています。 インジケーターには、以下で説明するいくつかの描画モードがあり、ニーズに合わせて調整できます。 設定 計算モード レベルの計算には、AverageTrueRange (ATR) または AverageDai
FTFC は、Rob Smith の The Strat で定義されている Full Timeframe Continuity を指します。 このインジケーターはチャートに 2 本の線を引きます。四半期、月次、週次、日次、または時間次の開始レベルの最高値の 1 つと、これらの値の最低値の 2 つ目です。これにより、取引が一方向に非常に強くなる可能性が高いチャネルより上または下のチャネルが得られます。ライン間では、価格アクションが途切れ途切れになり、より広いストップを使用する必要がある場合があります. 高値と安値の中間点を示すために、3 番目の破線も描画されます。これは、市場が価格を特定の方向に押し上げようとするため、サポートまたはレジスタンスを見つけるのに適した場所です。色を NONE に設定して選択すると、この行をオフにすることができます。 設定 四半期ごとのレベルを含める 一部の人々はそれを無視することを好むため、四半期の始値を計算に含めることを選択できます。 IncludeCurrentTimeframeOpen true の場合、現在表示されている時間枠が H1、D1、W
This indicator will draw patterns based on   Rob Smith's   The Strat   as they emerge in real time on your chart. As price evolves,   TheStrat   offers 18 distinct price action patterns that can help you get good entries in the market. Each pattern involves two or three candles, and this indicator will draw a bounding box around the candles and name the pattern. The indicator also shows when a potential setup is forming, known by stratters as an Actionable signal. Candles Each candle is de
ストラトの取引戦略 についてまだ学んでいない場合は、今すぐグーグルで検索してください。時間を無駄にしないことを約束します。使用するかどうかに関係なく、いくつかの新しいトリックを学ぶことができます。 OK、これで TheStrat とは何かがわかったので、このインジケーターが何をしてくれるかを理解できるようになります。 主な機能 つまり、インジケーターは次のことを行います。 サポートされているすべての時間枠の時間枠の連続性を表示 デイトレーダーとスイングトレーダーの2つのタイムセットビューをサポート 連続する 4 つの時間枠で完全な時間枠の継続性が適用されている場合に表示します 各時間枠の現在のろうそくの状態を表示します すべての時間枠で現在のパターンがあれば表示します 有効なパターンと実行可能なパターンの両方を表示 5 秒ごとに更新 (1 秒から設定可能) パネルをクリックして、選択した銘柄と時間枠のチャートを開くことができます チャートを開くために使用するチャート テンプレートを選択できます 表示するグループとそのグループ内のシンボルを選択します インジケーターは、ブローカーがサ
ピボット レベルは、すべての市場で認められている確立された技術レベルです。 このインジケーターは、任意のシンボルについて、現在の四半期ごと、月ごと、週ごと、日ごと、および 4 時間ごとのピボットをチャートに描画します。また、各期間のサポート レベルとレジスタンス レベルを表示し、レベル 1 ~ 4 から表示するものを選択することもできます。     次の中からピボットのタイプを選択します。 標準 カマリリャ デマーク ウッディー フィボナッチ 元の仕様に従って、DeMark ピボットには単一のサポート レベルとレジスタンス レベルがあることに注意してください。 インジケーター ウォールは、ラインが価格に触れた場合、ラインの描画方法を変更します。これは非常に役立ち、ラインのサポートまたは抵抗の強さは、一度触れると大幅に減少します. 期間ごとに、予測されたピボット レベルを表示するように選択できます。これは通常のピボットと同じ計算を使用しますが、現在不完全な時間枠で機能します。そのため、価格がその範囲の大部分をすでにカバーしている、その期間の終わりに向かって使用するのが最適です。 設定
市場はラウンド数を非常に好み、下落市場ではサポートとして機能し、価格が上昇するとレジスタンスとして機能することがよくあります。 この指標は、ラウンド値で価格レベルを描画するように設計されています。これは自動的に行われますが、それをオーバーライドして表示するレベルを決定するオプションもあります。 ラウンド レベルは、10、20、30 などの 10 のステップと同じくらい単純にすることができます。また、外国為替を使用している場合は、0.1 または 0.01 での変化を見たいと思うかもしれません。 インジケーターは、メジャーとマイナーの 2 つのクラスの線をそれぞれ異なる形式で描画します。これにより、レベルの 2 つの異なる変化の間の変化を同時に見ることができます。 アラート このインジケーターには、価格が設定可能な距離内にある場合に、メジャー、マイナー、または両方の価格レベルでアラートを鳴らす機能が含まれています。 自動セットアップ デフォルトでは、指標はメジャー価格とマイナー価格の両方の適切なレベルを決定します。これは、いつでも画面に表示する行数を制御する構成可能な DensityIn
Average True Range (ATR) は、設定された期間における価格の変動量を測定する一般的に使用される指標です。しかし、それが与える値はいかなる種類の境界内でも定義されていないため、ストップロスまたはテイクプロフィットの計算以外に使用することはほとんど不可能です. この指標は標準的な ATR 指標ですが、パーセンタイル境界を導入したので、極値を確認できます。 パーセンタイルと、分割中央値と呼ばれるものから選択できます パーセンタイル レベル パーセンタイル レベルは 1%、5%、20%、50%、80%、95%、99% で描かれ、これらは価格が他のすべての値に関連してどこにあるかを示します。たとえば、5% レベルは、ラインより下では ATR 読み取り値の 5% のみが低くなることを示し、99% は、そのレベルを超える ATR 値のうち、値の 1% のみが高くなることを示します。 80% を超えると、新しい取引のポジション サイズを下げ始めることを選択できます。また、95% を超えると、モメンタムが変化する前に利益を得るのに適した時期になる可能性があります。 分割中央値 Sp
範囲の枯渇は、価格が現在の期間の予想される範囲を満たすか超えると発生します。これらのレベルでは、価格は期間の初期に比べて勢いを失い始めるため、新しいポジションをとっていないことを確認するのに良いポイントです. このインジケーターは、チャート上でこれが発生する可能性が高い場所を示し、日次、週次、月次の期間のレベルを示します。 価格がこれらの枯渇レベルを超えている場合は、動きの背後にある勢いが非常に強く、より高い時間枠レベルに向かっている可能性が高いことを示しています. インジケーターは、好みに応じて、Average True Range (ATR) または Average Range (ADR) 計算を使用できます。デフォルトでは、外国為替チャートでよりうまく機能することがわかっているため、ATR を使用しますが、ADR は株式ベースのインデックスとシンボルで優位に立っています。 インジケーターには、以下で説明するいくつかの描画モードがあり、ニーズに合わせて調整できます。 設定 計算モード レベルの計算には、AverageTrueRange (ATR) または AverageDai
フィルタ:
Christian Astillero
1203
Christian Astillero 2022.03.08 14:52 
 

Perfect

Robert Gerald Wood
4259
開発者からの返信 Robert Gerald Wood 2022.04.01 12:01
Thank You!
CasiousD
784
CasiousD 2021.10.30 19:39 
 

2nd indicator I have from this author. Took some getting used to understanding how it interacts with other indicators already on the chart, but once I figured it out (I can be slow sometimes), works perfectly. As with the other indicator I have from this author (Multi Chart Crosshairs), this is going to make my market analysis so much easier! Thank you again!

Payman
663
Payman 2021.04.16 15:05 
 

its really cool because its the only copier that also copies the objects description i found. i wish i could exclude certain objects like buttons and labels. but anyways its already awesome. thanks

Robert Gerald Wood
4259
開発者からの返信 Robert Gerald Wood 2021.04.16 15:08
Hello again Payman, you're now my biggest fan :)
Being able to exclude object of a type is a good idea, definitely adding that to the to-do list for the next version. Thank you!
tr4ppist
97
tr4ppist 2021.04.15 17:41 
 

BEST cloner ever tried, and i have tried a lot of cloners. This clones ALL, perfectly. Download this and don't waste your time on others

Robert Gerald Wood
4259
開発者からの返信 Robert Gerald Wood 2021.04.15 17:43
Thats really kind of you. Thanks for taking the time to leave a review, I appreciate it :).
レビューに返信
バージョン 1.2 2022.11.13
Added option to copy Indicator window objects as well as those in the main chart window. Rely's on the second chart already having the Indicators attached, and in the same order as the source chart.

New Option: CopyIndicatorWindowObjects (true/false)

By default the option is set to false, so it will not affect existing users unless they take action and set the option to true.
バージョン 1.1 2021.04.15
Fixed bug where the text for the first fibo level was not cloned correctly.