Anchored Linear Regression Channel

アンカード線形回帰チャネル(ALRC)

概要:

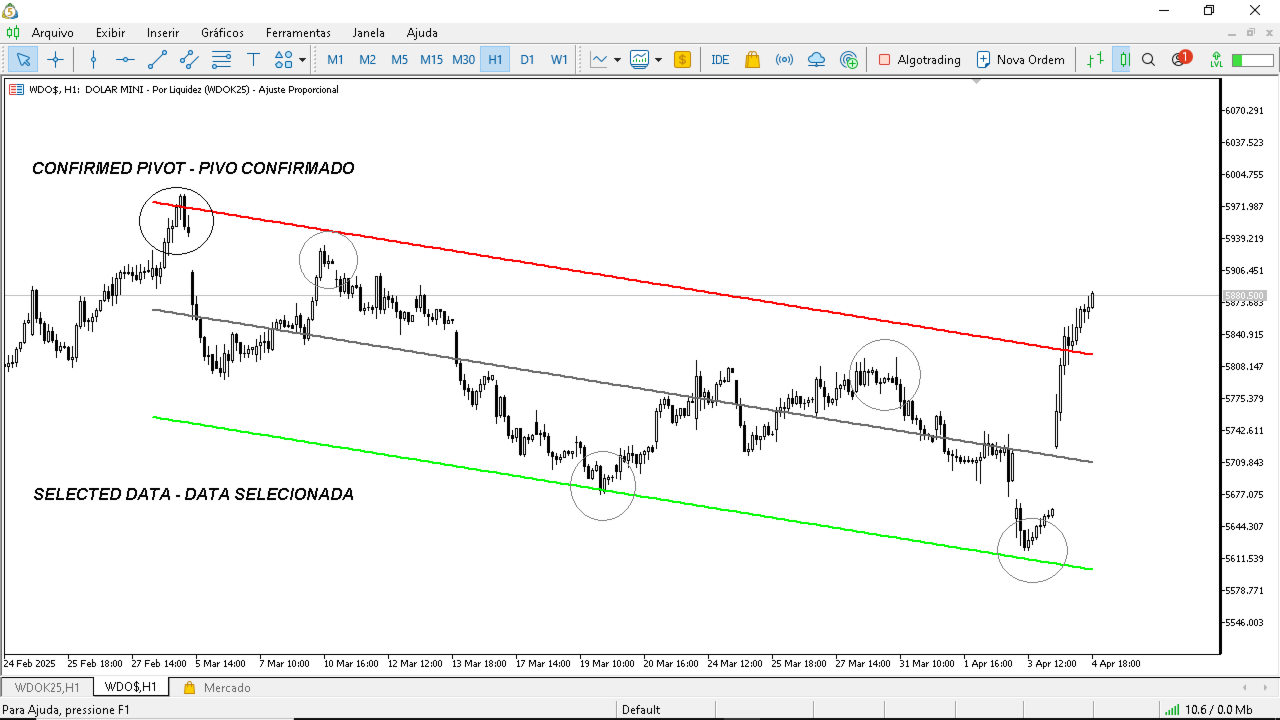
**アンカード線形回帰チャネル(ALRC)**は、従来の線形回帰チャネルを進化させた高度なテクニカル分析ツールです。**確認されたピボットポイントにチャネルをアンカー(固定)**できることで、チャート上の重要な構造的ポイントに対する価格の動きをより正確かつ信頼性の高い形で捉えることができます。

主な特徴:

  • 確認済みピボットへのアンカー: 重要なピボットを手動で選択してチャネルを固定し、マーケットで検証されたイベントに基づいた分析を可能にします。

  • トレンドの明確な視覚化: アンカーチャネル内での価格の動きを観察することで、反転、ブレイクアウト、チャネルの拡張などを把握できます。

  • 高い信頼性: 確認されたイベントを起点にすることで、より信頼性の高いトレードシグナルを提供します。

主な活用方法:

  • チャネル内における動的なサポートとレジスタンスゾーンの特定

  • トレンド反転の初期兆候を捉える

  • チャネルの境界線を利用したリスク管理の強化

カスタマイズ可能なパラメーター:

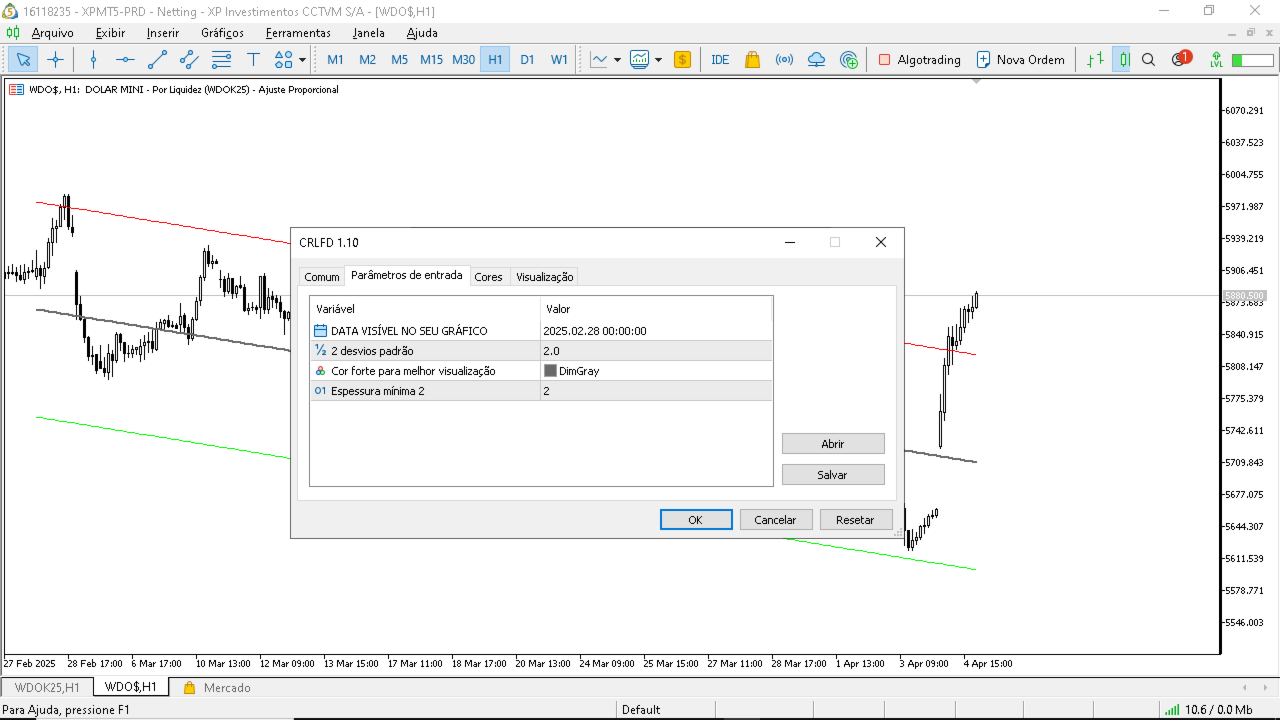
  • アンカーピボット: 識別されたピボットを起点としてチャネルを設定

  • 回帰期間: 回帰計算に含めるローソク足の本数を設定

  • チャネル偏差: トレーディング戦略に応じてチャネルの幅を調整

対応プラットフォーム: ALRCはMetaTrader 5と完全互換で、さまざまな銘柄や時間足でテスト済み。高いパフォーマンスと柔軟性を備えています。


おすすめのプロダクト
Displays trends in current chart. You can display trends of multiple timeframes in one chart by inserting this indicator as often as you want. Key features: displays trend line by finding highs and lows counts number of high/low of current trend in different color (long/short) allows you to display multiple timeframe trends in one chart Settings: Indicator Name: if you want to show M5 and H1 on one chart add TITrend twice to your current chart and rename M5 to "TITrendM5" and H1 to "TITrendH1" C
Hurst Cycles Diamonds Description This indicator is an alternative version inspired by the pioneering work of David Hickson and the Hurst Cycles Notes indicator developed by Grafton. The main objective is to provide a clear and intuitive view of the Hurst cycles. Credits Original Concept : David Hickson - Hurst Cycles Theory Inspiration : Grafton - Hurst Diamond Notation Pivots Alternative Version : Fillipe dos Santos Main Features Identifies and displays pivots in multiple time cycles Visual t
# Multi-Timeframe Trend Sync Pro (MTTS Pro) ## Synchronize Multiple Timeframes and Trade with Trend Confluence **MTTS Pro** is an advanced technical indicator developed for traders seeking precision in multi-timeframe analysis. By consolidating information from multiple timeframes simultaneously, the indicator identifies points of high confluence where multiple timeframes confirm the same market direction. --- ## MAIN FEATURES ### **Simultaneous Multi-Timeframe Analysis** - Monitor up t
My Pivot is an Indicator based on Pivot Lines and Support-Resistance zones. This Indicator will Plot 11 SR zones including Pivot Line which will definitely help you to understand the exact SR zones of the Market. Steps to Setup the Indicator: Install the Custom Indicator; Set all the Lines Color, Width and Styles; Set visualization to All Timeframe; and DONE It can be used for: All Pairs: Forex, Cryptocurrencies, Metals, Stocks, Indices.  All Timeframe All Brokers All type of Trading S
Marca Dagua
Erison Francisco De Sales
3 (1)
Adiciona marca d'água com nome do ativo em negociação. Pode ser ajustado definindo tamanho da fonte e coloração do texto. Testado com vários ativos do mercado B3 e Forex  Adione ao gráfico e configure de acordo com a necessidade. Caso tenha problemas sinta-se a-vontade para nos avisar e providenciaremos a correção logo que possível. ______________________________
FREE
SupportResistanceは、以前のろうそくの高値と安値に基づく動的なサポートとレジスタンスのインジケーターです。 計算パラメータは設定可能です。 前のキャンドルの最大値と最小値を参照として使用することも、前のキャンドルのグループの最大値と最小値を使用することもできます。 インジケーターは、抵抗を示すために赤い線を使用し、サポートを示すために緑の線を使用します。 サポートまたはレジスタンスが壊れた場合、その線は点線で示され、再び関連するようになったときにのみ復元されます。 サポートまたは抵抗が壊れた後、反対の線が到達すると、最後の有効な値で新しいサポートまたは新しい抵抗が見つかります。 過去の最大値または最小値の場合、有効なサポートまたはレジスタンスラインはありません。
The indicator,   Support and Resistance Detect Signal   automatically detects support and resistance levels and trend lines, emitting a signal whenever the condition is met, as configured. It reads support and resistance drawn manually or automatically built into the chart by other external indicators. Note:   Support and Resistance Detect Signal   is compatible with almost all external indicators that draw on the chart, support and resistance levels, in addition to trend lines. Discover our
Keltner Channels (ou   Canais de Keltner ) é mais um indicador de   volatilidade   utilizado pela   análise técnica. Também chamado de   envelope , esse canal foi criado por Chester Keltner para monitorar os seus investimentos no mercado futuro de café na década de 1960. Porém, com o passar do tempo, passou também a ser utilizado para outros ativos e, atualmente, é uma das ferramentas mais utilizadas pelos traders. Nesta versão customizada foram adicionados novas opções de método de média movel
TendencyLine
Samuel De Souza Ferreira
TendencyLine Indicator - Market Trend Analysis (An exclusive indicator by PPF - Past Project Future) General Description TendencyLine is a technical indicator developed by PPF - Past Project Future to help traders identify the prevailing market trend. It overlays a trend line based on a user-selected moving average on the price chart and displays a colored histogram that signals the trend direction. Main Features Trend Identification: The indicator differentiates between bullish and bear
FREE
Auto Fractal Support And Resistance is a powerful multi-timeframe indicator designed for traders who want to trade lower timeframes with higher timeframe accuracy. When your mouse cursor is on a line you can easily see fractal describtion and index of fractal candle  and timeframe of that fractal candle.  This indicator automatically detects H1 and D1 fractal levels and draws clean horizontal support and resistance lines on any lower timeframe chart (M1, M5, M15, M30). Now you can see where the
ピボットポイントフィボRSJは、フィボナッチレートを使用してその日のサポートラインとレジスタンスラインを追跡するインジケーターです。 この壮大な指標は、フィボナッチレートを使用してピボットポイントを通じて最大7レベルのサポートとレジスタンスを作成します。 価格がこのサポートとレジスタンスの各レベルを尊重する方法は素晴らしいです。そこでは、オペレーションの可能な入口/出口ポイントを認識することができます。 特徴 最大7レベルのサポートと7レベルの抵抗 レベルの色を個別に設定します 入力 ピボットタイプ ピボットフィボRSJ1 =フィボ比1の計算 ピボットフィボRSJ2 =フィボ比2の計算 ピボットフィボRSJ3 =フィボ比3の計算 ピボットフィボクラシック=クラシックピボット計算 最小ピボットレベル ピボット3レベル ピボット4レベル ピボット5レベル ピボット6レベル ピボット7レベル それでも質問がある場合は、ダイレクトメッセージで私に連絡してください: https://www.mql5.com/ja/users/robsjunqueira/
FREE
Info:   marcobarbosabots Pivot lines are an easy way to see market trend. The indicator provides the pivot line and three first support and Resistance lines. Calculations used was: Resistance 3 = High + 2*(Pivot - Low) Resistance 2 = Pivot + (R1 - S1) Resistance 1 = 2 * Pivot - Low Pivot point = ( High + Close + Low )/3 Suport 1 = 2 * Pivot - High Suport 2 = Pivot - (R1 - S1) Suport 3 = Low - 2*(High - Pivot) You can use the calculated values ​​on an EA too, just make sure the indicator is a
Entry and exit signals from the Double 7's Strategy by Larry Connors in his book "Short Term Trading Strategies That Work". Larry claims this strategy predicted the market's direction over 80% of the time since 1995. Picking up the gains and being exposed in the market less than 25% of the time. Good for swing trading on Daily charts of SPY, Nasdaq, China's FXI, Brazil's EWZ and the majority of the equity ETFs and World Indices. How does it work? The indicator activates the buy signal when we
Cybertrade Auto Fibonacci retraction and projection  - MT5 Auto Fibonacci is an indicator that automatically plots the Fibonacci retracement and projection based on the number of bars you select in the indicator setting. You can customize nine different levels of retraction and three levels of projection. It works on periods longer than the period visible on the chart. All values ​​are available in the form of buffers to simplify possible automations. This indicator is the same one we use in ou
FREE
Bullhouse WavePrice
Luiz Vinicius Pereira Rocha -
Wave Price Indicator The Wave Price indicator is an advanced technical analysis tool that visualizes price movements in wave formations using a ZigZag approach. It helps traders identify significant price patterns, trends, and potential reversals by breaking down price action into meaningful waves. Price Wave Analysis : Visualizes price movements in clear wave patterns ZigZag-based Calculation : Filters out market noise and focuses on significant price moves Color-Coded Waves : Aqua: Bullish wa
The THREE DRAGONS is a technical indicator that portrays three mystical Chinese dragons flying through the price chart: 1. The Green Dragon (SeaGreen): - The most agile and fastest of the three - Reacts quickly to market direction changes - Usually leads the movements 2. The Red Dragon (Tomato): - Moves with balance between speed and caution - Confirms movements initiated by the Green Dragon - Its interactions with the Green Dragon may indicate opportunities 3. The Black Dragon (Black): - Th
FREE
Perfect indicator to use No Forex or Binary Options You can use it manually or use it automated on the mt2trading platform or similar 90% winrate indicator Common questions Which brokers does this work with? IQOption.com Binary.com Alpari.com Specter.ai Instaforex.com clmforex.com GCOption.com Is it necessary to leave my pc on all day using automated mode? > although our platform must constantly run on your laptop / PC, if you want it to work while you are away, it is not necessary to leave your
Vwap Custom Date
Sidnei Da Silva Santos Junior
About the VWAP Custom Date This indicator can be calculated from a specified date and hour, being not only a Day Trading indicator but also Swing Trading indicator. What is the VWAP indicator? The volume weighted average price (VWAP) is a trading benchmark used by traders that gives the average price a security has traded at throughout the day, based on both volume and price. It is important because it provides traders with insight into both the trend and value of a security. Large institution
Chessmark
Matheus Oliveira Rossi
Trend Indicator  This indicator is about long buy and long sell using a simple visualization of trend.  The green candle after a long sell period means a good moment to buy. A red candle after a long sequence of buyers means a good moment for sell. After all, you can use all time-frames on this indicator. * * If you prefer a better visualization, use long period on chart. Ex: 1H and 4H.   
This Indicator draws Fibonacci Extension levels in two different ways. You can select whether to draw Fibonacci Extension levels based on your favourite ZigZag settings or you can let the indicator to draw Fibonacci Extension  level based on given number of Bars or Candles.  You can also set Mobile and Email notification for your favourite Extension  levels individually. With this indicator you will not have to feel lonely as the it can generate Voice alerts, which will keep you focused on your
MetaTraderでは、複数の   水平線   を描画し、それぞれの価格レベルを追跡するのは面倒な作業になることがあります。このインジケーターは、価格アラートの設定、サポートとレジスタンスの表示、その他の手動用途のために、等間隔で複数の水平線を自動で描画します。 このインジケーターは、短期間で売買による利益を狙いたい初心者のFXトレーダーに最適です。水平線は、相場がトレンド中またはレンジ相場である場合に、エントリーの可能性があるゾーンを見つける手助けをしてくれます。 機能 入力設定に基づいて、瞬時に複数の水平線を描画可能。 各水平線を区別しやすいように、カラフルなカラーテーマを採用。 複数の取引セッションのレンジを追跡するのに必須のツール。 価格が水平線にタッチした際にアラートを送信。 アラート間に間隔を設定でき、過度な通知を防止。 完全にカスタマイズ可能。 解説 このインジケーターは、入力設定で指定されたデータと指示に従って水平線を描画します。価格がこれらの水平線でどのように反応するかを観察することで、重要なサポート・レジスタンス付近でのトレード機会を見極めることができます。
Key Features Visual Risk/Reward Planning Spawns interactive rectangles on the chart for Buy and Sell setups. Pink Box:   Represents your Risk (Entry to Stop Loss). Green Box:   Represents your Reward (Entry to Take Profit). The Green box automatically adjusts its size based on your preferred Reward Ratio (e.g., 1:2). Auto-Lot Calculation Automatically calculates the correct   Lot Size   based on your Account Balance and defined Risk Percentage. Takes into account the symbol's Tick Value and Cont
Taylor Pivot
Pablo Filipe Soares De Almeida
注意事項: 本インジケーターは Taylor Pivot のみを表示 します。 ROC インジケーターは含まれておらず 、個別には表示されません。 Taylor Pivot  は、もともと Taylor によって開発され、その後プロのトレーダーである Linda Raschke が著書の中で広めた、古典的な短期トレード手法に基づいたインジケーターです。Raschke はこのアプローチを、短期的な市場の方向性をシンプルに特定する方法として強調しており、1 日あたり 1 回のポジション判断(買いまたは売り)に集中することで、頻繁なデイトレードと比べて心理的ストレスを軽減できるとしています。中心となる考え方は、翌セッションでの継続やフォロースルーを想定し、日足のクローズ時点でポジションを構築することで、初期の反転やマーケットテストを活用し、利益の出ているトレードをオーバーナイトで保有して追加の値動きを捉えることです。 この手法の核となるのは、日足タイムフレームにおける 2 期間の Rate of Change(ROC)から算出される短期ピボットポイントの計算です。このピボットは、直近の終値
KT Pivot Points MT5
KEENBASE SOFTWARE SOLUTIONS
KT Pivot Points は、最新の市場データに基づいて、日足・週足・月足のピボットレベルをチャート上に自動で表示します。ピボットポイントは、特にFX市場において、テクニカル分析で広く利用されている指標の一つです。 特徴 価格がピボットレベルに到達した際にアラートを送信します。  各種類のピボットレベルに対して完全なカスタマイズが可能です。   シンプルな表示で、日足・週足・月足のピボットレベルを一目で確認できます。 最小限のCPUリソースを使用し、高速な計算を実現します。 チャート上の他のインジケーターとも互換性があります。 ピボットポイントとは ピボットポイントは、前の取引日の高値、安値、終値の平均から算出されます。  この計算により、将来のサポートおよびレジスタンスレベルを予測でき、価格がこれらのレベル付近でどのように動くかを判断する手助けとなります。 また、価格がピボットポイントの上にあるときは強気傾向、下にあるときは弱気傾向とされるのが一般的です。 ピボットの計算式 ピボットレベルの計算には、前日、週、または月の高値、安値、終値が使用されます。 P = (H +
Super Trend Indicator – Trend Following Tool Description: The Super Trend Indicator is a trend-following tool designed to assist traders in identifying market trends. Utilizing the Average True Range (ATR), it dynamically adjusts to market volatility and generates visual signals. The indicator plots lines directly on the chart, changing color based on trend direction. Crosses between the price and indicator line may suggest potential trend shifts. Key Features: Dynamic trend detection using ATR.
HV Models is an Indicator that containes 4 methods for calculating historical volatility of the selected asset. Volatility is one of the fundamental values ​​describing changes in the underlying asset. In statistics, it usualy describes as a standard deviation. The price chart has 4 values ​​(Open High Low Close) when we calculate volatility using a standard indicator, only one of these values ​​is used as a result we get one-sided volatility picture. The presented indicator uses 4 volatility ca
Fibonacci Sessions インジケーターは、精密なスキャルピングと日中取引戦略のために設計された強力なトレーディングツールです。  ニューヨーク、ロンドン、アジアの各セッションの主要なフィボナッチレベルを自動的にプロットし、トレーダーに主要市場セッションにおける価格変動の明確なビューを提供します。  各セッションでは、価格が最も反応するユニークな「ゴールデンゾーン」が強調表示されます。  これにより、反転、ブレイクアウト、継続パターンのための非常に信頼性の高いゾーンが作成されます。  インジケーターは、価格がどのように一つのゴールデンゾーンから別のゴールデンゾーンへと頻繁に移動するかを視覚的に示し、トレーダーが安定したチャンスを捉えるのに役立ちます。  XAUUSDのM5タイムフレームに最適化されており、他の通貨ペアや世界の指数でも優れたパフォーマンスを発揮します。  ゴールド、通貨ペア、または株価指数を取引する場合でも、このセッションベースのフィボナッチマッピングは、高確率の取引ゾーンを特定する上で追加の優位性を提供します。  赤い線: 極限利益ターゲットレベル。  黄色
FREE
A lot of professional traders use high quality divergence signals as a part of their strategy to enter a position. Spotting correct divergences quickly can often be hard, especially if your eye isn’t trained for it yet. For this reason we’ve created a series of easy to use professional oscillator divergence indicators that are very customisable so you get only the signals you want to trade. We have this divergence indicator for RSI, MACD, Stochastics, CCI and OBV. RSI:   https://www.mql5.com/en/
HiLo Activator v1.02 by xCalper The HiLo Activator is similar to moving average of previous highs and lows. It is a trend-following indicator used to display market’s direction of movement. The indicator is responsible for entry signals and also helps determine stop-loss levels. The HiLo Activator was first introduced by Robert Krausz in the Feb. 1998 issue of Stocks & Commodities Magazine.
FiveStarFX Gold Reversal Edge Professional automated trading solution designed for structured execution and controlled risk management in the Gold market. Built for traders who value discipline, precision, and consistency. Key Features Fully automated trading One trade at a time (controlled exposure) Fixed Stop Loss and Take Profit Smart Break-Even protection Profit lock with buffer Step-based trailing management Spread protection system Works on any broker Trade Management The E
FREE
このプロダクトを購入した人は以下も購入しています
SuperScalp Pro — 高度なマルチフィルター対応スキャルピングインジケーターシステム SuperScalp Pro は、クラシックな Supertrend と複数のインテリジェントな確認フィルターを組み合わせた高度なスキャルピング用インジケーターシステムです。M1〜H4 のすべての時間足で効率的に機能し、特に XAUUSD、BTCUSD、および主要なFX通貨ペアに適しています。単体のシステムとして、また既存の取引戦略へ柔軟に統合して使用できます。 本インジケーターは 11 以上のフィルターを統合しており、短期・長期の EMA、トレンド判定に用いる 3 本の EMA、EMA スロープ(EMA slope)、RSI、ADX、出来高、VWAP、ボリンジャーバンドのブレイクアウト、MACD ダイバージェンスフィルターなどを含みます。スマートキャンドルフィルターはローソク足の終値を確認して弱いシグナルを排除し、3 本の EMA と MACD ダイバージェンスを組み合わせたトレンド認識メカニズムにより勝率の高いシグナルの選別を支援します。 SuperScalp Pro は ATR に基
Azimuth Pro
Ottaviano De Cicco
5 (6)
発売プロモーション Azimuth Proは先着100名様限定で 299ドル でご提供します。最終価格は 499ドル となります。 リテールとインスティテューショナルのエントリーの違いはインジケーターではなく、ロケーションにあります。 多くのトレーダーは、モメンタムを追いかけたり、遅行シグナルに反応して、任意の価格レベルでエントリーします。機関投資家は、需給が実際にシフトする構造的なレベルに価格が到達するのを待ちます。 Azimuth Proはこれらのレベルを自動的にマッピングします:スイングアンカーVWAP、マルチタイムフレーム構造ライン、高確率ロケーションにのみ出現するABCパターン。 Azimuth Proは、構造分析とインテリジェントな自動化の両方を求めるプロフェッショナルトレーダー向けに構築されています。 Azimuthが外科的精度で市場構造をマッピングする一方、Azimuth Proはインテリジェンスレイヤーを追加します:トレーディングスタイルの自動検出、スマート設定された移動平均線、20年のデータでバックテストされた最適化パラメータ。その結果、お使いの銘柄と
Entry In The Zone and SMC Multi Timeframe is a real-time market analysis tool developed based on Smart Money Concepts (SMC). It is designed to analyze market structure, price direction, reversal points, and key zones across multiple timeframes in a systematic way. The system displays Points of Interest (POI) and real-time No Repaint signals, with instant alerts when price reaches key zones or when signals occur within those zones. It functions as both an Indicator and a Signal System (2-in-1), c
ARICoin is a powerful trading companion designed to generate high-probability entry signals with dynamic TP/SL/DP levels based on volatility. Built-in performance tracking shows win/loss stats, PP1/PP2 hits, and success rates all updated live. Key Features: Buy/Sell signals with adaptive volatility bands Real-time TP/SL/DP levels based on ATR Built-in MA Filter with optional ATR/StdDev volatility Performance stats panel (Success, Profit/Loss, PP1/PP2) Alerts via popup, sound, push, or email Cust
このインジケーターを購入された方には、以下の特典を 無料 で提供しています: 各トレードを自動で管理し、ストップロスとテイクプロフィットを設定し、戦略ルールに基づいてポジションを決済する補助ツール 「Bomber Utility」 様々な銘柄に合わせたインジケーターの設定ファイル(セットファイル) 「最小リスク」、「バランスリスク」、「待機戦略」 の3つのモードで使用できる Bomber Utility 用の設定ファイル このトレーディング戦略をすぐに導入・設定・開始できる ステップバイステップのビデオマニュアル ご注意: 上記の特典を受け取るには、MQL5のプライベートメッセージシステムを通じて販売者にご連絡ください。 オリジナルのカスタムインジケーター 「Divergence Bomber(ダイバージェンス・ボンバー)」 をご紹介します。これは、MACDのダイバージェンス(乖離)戦略に基づいた 「オールインワン」型のトレーディングシステム です。 このテクニカルインジケーターの主な目的は、価格とMACDインジケーターの間に発生するダイバージェンスを検出 し、将来の価格の動きを示す
このインジケーターを購入すると、プロ仕様のトレードマネージャーを無料で差し上げます。 まず第一に、このトレーディングシステムがノンリペイント、ノンリドロー、ノンラグのインジケーターであることを強調する価値がある。これにより、手動取引とロボット取引の両方に理想的なものになっています。 オンラインコース、マニュアル、プリセットのダウンロード。 「スマートトレンドトレーディングシステム MT5」は、新規および経験豊富なトレーダー向けにカスタマイズされた包括的なトレーディングソリューションです。10以上のプレミアムインジケーターを組み合わせ、7つ以上の堅実なトレーディング戦略を備えており、多様な市場状況に対応する多目的な選択肢となっています。 トレンドフォロー戦略:トレンドを効果的に乗り越えるための正確なエントリーとストップロス管理を提供します。 リバーサル戦略:潜在的なトレンドの反転を特定し、トレーダーがレンジ相場を活用できるようにします。 スキャルピング戦略:高速で正確なデイトレードおよび短期取引のために設計されています。 安定性:すべてのインジケーターはノンリペイント、ノンリドロー、ノ
CGE Trading Suite
Carl Gustav Johan Ekstrom
5 (1)
CGE Trading Suite delivers the analytical edge typically reserved for professional trading desks. The platform integrates a full suite of analytical tools into one seamless workflow: dynamic grid mapping, liquidity behavior analysis, ECM, trend lines, MIDAS, trade cycles, and directional channel projections. Together, these provide a unified view of market structure and momentum. Directional clarity is further enhanced by the capital flow index, which measures currency basket strength to identif
RelicusRoad Pro: 定量的市場オペレーティングシステム 【期間限定】無制限アクセス 70% OFF - 2,000人超のトレーダーと共に なぜ多くのトレーダーは「完璧な」インジケーターを使っても失敗するのでしょうか? それは、文脈を無視して 単一の概念 だけでトレードしているからです。文脈のないシグナルは単なるギャンブルです。勝ち続けるには、 根拠の重なり(コンフルエンス) が必要です。 RelicusRoad Proは単なる矢印インジケーターではありません。完全な 定量的市場エコシステム です。独自のボラティリティモデリングを用いて、価格が推移する「適正価値の道(Fair Value Road)」をマッピングし、ノイズと真の構造的ブレイクを判別します。 推測はやめましょう。機関投資家レベルの「ロード・ロジック」でトレードを。 コアエンジン:「Road」アルゴリズム システムの中心となる Road Algo は、市場環境にリアルタイムで適応するダイナミックなボラティリティチャネルです。 安全ライン(平衡点) と、価格が数学的に反転しやすい 拡張レベル を投影します。 Si
FX Trend NG:次世代マルチマーケット・トレンドインテリジェンス 概要 FX Trend NG は、複数の時間足に対応したプロフェッショナル向けトレンド分析およびマーケット監視ツールです。 市場全体の構造を数秒で把握することができます。 複数のチャートを切り替える必要はありません。どの銘柄がトレンド中なのか、どこでモメンタムが弱まっているのか、そしてどの時間足で強い整合性があるのかを瞬時に確認できます。 ローンチ特別オファー – FX Trend NG を $30(6ヶ月) または $80 永久ライセンス でご利用いただけます。 すでに Stein Investments のユーザーですか? -> メッセージを送信 して、プライベートグループへアクセスしてください。 セットアップや詳細情報が必要ですか? -> Stein Investments 公式ページ をご覧ください。 1. FX Trend NG が他と異なる理由 3ステート・トレンドロジック ― Buy と Sell だけではない • 多くのインジケーターは Buy または Sell の2状態のみを表示します。
Meridian Pro
Ottaviano De Cicco
5 (1)
Meridian Pro:MT5用プロフェッショナル・マルチタイムフレーム・トレンドマトリックス 概要 Meridian Pro は Merkava Labs が開発したマルチタイムフレーム・トレンドマトリックスで、方向性の状態、強度、モメンタムの状況、マトリックスの合意をひとつのコンパクトなパネルに集約します。ひとつのアダプティブエンジンがM1からW1まで一貫して適用されます。シンボルごとの調整は不要。インジケーターの積み重ねも不要。すべてのアセットとすべてのタイムフレームをカバーするひとつの構造化された読み取りです。 発売キャンペーン — Meridian Proを USD 99 (導入価格)で入手。通常価格:USD 149 。 1. Meridian Proが他と異なる理由 ひとつのエンジン、バラバラなインジケーターのダッシュボードではない 多くのMTFダッシュボードは、タイムフレームごとに生のインジケーター値を繰り返すだけです。Meridian Proはマトリックス全体でひとつのアダプティブ・トレンドエンジンを使用するため、パネルの各行が同じ構造化フレームワークから導出されます
Power Candles – あらゆる市場に対応した強度ベースのエントリーシグナル Power Candles は、Stein Investments が長年培ってきた強度分析を価格チャート上に直接反映します。価格だけに反応するのではなく、各ローソク足は実際の市場の強さに基づいて色分けされ、モメンタムの蓄積、強度の加速、明確なトレンド転換を瞬時に把握できます。 すべての市場に共通する単一ロジック Power Candles は すべての取引シンボル で自動的に動作します。現在のシンボルが Forex か非 Forex 市場かを自動判別し、内部で適切な強度モデルを適用します。 Forex および Gold :FX Power のデルタ値を使用(絶対値レンジ最大 100) 指数、暗号資産、CFD :IX Power の強度値を使用(絶対値レンジ最大 50) 必要な強度計算は Power Candles に直接組み込まれています。ローソク足のカラーリングやシグナルロジックに、追加のインジケーターは不要です。 価格ノイズではなく「強度状態」 各ローソク足は、以下の 9 つの明確に定義された強
AriX
Temirlan Kdyrkhan
1 (4)
AriX Indicator for MT5 A powerful trend-following and signal-evaluation tool AriX is a custom MT5 indicator that combines Moving Averages and ATR-based risk/reward logic to generate clear buy/sell signals. It visualizes dynamic SL/TP levels, evaluates past trade outcomes, and displays win/loss statistics in a clean on-chart panel. Key features include: Buy/Sell signals based on MA crossovers ATR-based SL/TP1/TP2/TP3 levels with visual lines and labels Signal outcome tracking with real-time stat
[ My Products ] , [ My Channel ]   ,  [ LIVE SIGNAL ] HFT Spike Detector HFT Spike Detector は、高頻度取引(HFT)による急激な価格変動をリアルタイムで分析・測定するために開発されたプロフェッショナルなティック監視ツールです。 目的は、ブローカーによって引き起こされる異常なスリッページ、流動性のギャップ、ミリ秒単位の価格スパイクを数値データで検出できるようにすることです。 リアルタイムのティックフローと約定条件を分析するため、バックテストで正確に評価することはできません。 このEAは、自動化のために用意されたセットファイルと一緒に使用するために購入できます: VolumeHedger EA 動作原理 この Expert Advisor は、受信するすべてのティックをリアルタイムで分析し、以下を行います: 価格変動速度 1秒あたりのティック密度 スリッページの大きさ 同方向のマイクロフロー 測定し、チャート上のパネルに表示します。 これにより、スプレッドを除いた実際の執行品質を確認できま
まず第一に、この取引インジケーターは再描画されず、再描画されず、遅延しないことを強調する価値があります。これにより、手動取引とロボット取引の両方に理想的なものになります。 ユーザーマニュアル:設定、入力、戦略。 アトミックアナリストは、価格の強さとモメンタムを利用して市場でより良いエッジを見つけるためのPA価格アクションインジケーターです。ノイズや誤ったシグナルを除去し、取引ポテンシャルを高めるための高度なフィルターを備えています。複雑なインジケーターの複数のレイヤーを使用して、アトミックアナリストはチャートをスキャンし、複雑な数学的計算をシンプルなシグナルと色に変換します。これにより、どのような初心者トレーダーでも理解して使用し、一貫した取引の決定を行うことができます。 「アトミックアナリスト」は、新規および経験豊富なトレーダー向けにカスタマイズされた包括的な取引ソリューションです。プレミアムインジケーターとトップノッチの機能を1つの取引戦略に組み合わせ、すべてのタイプのトレーダーにとって汎用性のある選択肢にします。 デイリートレーディングとスキャルピング戦略:高速で正確なデイ
マーケットメーカーのためのツール。 Meravith は次の機能を提供します: すべての時間足を分析し、現在有効なトレンドを表示します。 強気と弱気の出来高が等しくなる流動性ゾーン(出来高均衡)を強調表示します。 異なる時間足のすべての流動性レベルをチャート上に直接表示します。 テキスト形式の市場分析を生成し、参考情報として表示します。 現在のトレンドに基づいて目標値、サポートレベル、ストップロスを計算します。 取引のリスクリワード比を算出します。 口座残高に基づいてポジションサイズを計算し、潜在的な利益を推定します。 また、市場に大きな変化があった場合には警告を表示します。 インジケーターの主要ライン: 強気/弱気の出来高エグゾーストライン ― 目標値として機能します。 市場のトレンドを示すライン。市場が強気か弱気かによって色が変わり、トレンドのサポートとして機能します。主にその色が市場センチメントを示します。 出来高均衡ライン(Eq)。Eq(Volume Equilibrium)ラインはシステムの中核です。これは買い手と売り手の出来高のバランスポイントを表します。市場の流動性を示し
FX Power: 通貨の強弱を分析して、より賢い取引を実現 概要 FX Power は主要通貨と金の実際の強弱をあらゆる市場状況で理解するための必須ツールです。強い通貨を買い、弱い通貨を売ることで、 FX Power は取引の意思決定を簡素化し、高い確率の取引機会を見出します。トレンドを追従する場合でも、極端なデルタ値を使用して反転を予測する場合でも、このツールはあなたの取引スタイルに完全に適応します。ただ取引するだけではなく、 FX Power で賢く取引をしましょう。 1. なぜ FX Power がトレーダーにとって非常に有益なのか 通貨と金のリアルタイム強弱分析 • FX Power は主要通貨と金の相対的な強弱を計算し、マーケットダイナミクスに関する明確な洞察を提供します。 • どの資産がリードしているか、または後れを取っているかを監視して、取引するペアを賢く選びましょう。 マルチタイムフレームの包括的なビュー • 短期、中期、長期のタイムフレームで通貨と金の強弱を追跡し、マーケットトレンドに基づいて取引戦略を調整できます。 • スキャルピングからスイングトレード
OmniSync Projection
Antonio-alin Teculescu
5 (1)
Chronos Fractal Engine is an innovative price projection indicator for MetaTrader 5, designed to transform your technical analysis by intelligently identifying and projecting historical price patterns. Built upon an advanced correlation algorithm and the fractal principles of the market, this powerful tool visualizes potential future price movements, giving you a unique edge in your trading decisions. What is Chronos Fractal Engine? At its core, the Chronos Fractal Engine employs a sophisticat
Currency Strength Dashboard Pro MetaTrader 5 用の リアルタイム通貨強度分析プロフェッショナルダッシュボード 。 このインジケーターは、 8つの主要通貨 (EUR、USD、GBP、JPY、CHF、AUD、CAD、NZD)の強さを計算し、 28の通貨ペア を同時に複数の時間足で分析・表示します。 ダッシュボードにより、トレーダーは 市場全体の状況を一目で把握 でき、余計な計算や複数のチャートを切り替える必要がありません。 計算方法 このインジケーターは、 高度な数学的通貨強度分析手法 に基づいています。 これは、類似インジケーターで一般的に使用されている RSIベースの手法 と比較して、より正確で客観的です。 この方法は 28の通貨ペアすべての相互関係を同時に分析 し、市場における実際の力関係をよりクリーンで偏りのない形で表示します。 リアルタイムダッシュボード メインテーブルには 8つの通貨 の完全なデータが表示されます。 Rank(順位) — 通貨の総合強度による順位。 1(最も強い)〜8(最も弱い) 。 Strength(強度) — 現在
優れたテクニカルインジケーター「Grabber」をご紹介します。これは、すぐに使える「オールインワン」トレーディング戦略として機能します。 ひとつのコードに、市場のテクニカル分析ツール、取引シグナル(矢印)、アラート機能、プッシュ通知が強力に統合されています。 このインジケーターを購入された方には、以下の特典を無料で提供します: Grabberユーティリティ:オープンポジションを自動で管理するツール ステップバイステップのビデオマニュアル:インジケーターのインストール、設定、取引方法を解説 カスタムセットファイル:インジケーターをすばやく自動設定し、最大限の成果を出すための設定ファイル 他の戦略はもう忘れてください!Grabberだけが、あなたを新たなトレードの高みへと導いてくれるのです。 Grabber戦略の主な特徴: 推奨タイムフレーム:M5〜H4 対応通貨ペア・資産:どれでも使用可能ですが、私が実際に検証した以下を推奨します(GBPUSD、GBPCAD、GBPCHF、AUDCAD、AUDUSD、AUDSGD、AUDCHF、NZDUSD、NZDCAD、EURCAD、EURUSD、E
Bill Williams Advanced is designed for automatic chart analysis using Bill Williams' "Profitunity" system. The indicator analyzes four timeframes at once. Manual (Be sure to read before purchasing) Advantages 1. Analyzes the chart using Bill Williams' "Profitunity" system. Signals are displayed in a table in the corner of the screen and on the price chart. 2. Finds all known AO and AC signals, as well as zone signals. Equipped with a trend filter based on the Alligator. 3. Finds "Divergence Bar
Quantum TrendPulse を ご紹介します。これは、   SuperTrend   、   RSI   、および Stochastic のパワーを 1 つの包括的なインジケーターに組み合わせて、取引の可能性を最大限に引き出す究極の取引ツールです。精度と効率を求めるトレーダー向けに設計されたこのインジケーターは、市場のトレンド、勢いの変化、最適なエントリー ポイントとエグジット ポイントを自信を持って特定するのに役立ちます。 主な特徴: SuperTrend 統合: 現在の市場動向に簡単に追従し、収益性の波に乗ることができます。 RSI精度: 買われすぎと売られすぎのレベルを検出し、市場の反転のタイミングに最適で、SuperTrendのフィルターとして使用されます。 確率的精度: 確率的振動を活用して、変動の激しい市場で隠れたチャンスを見つけます。SuperTrend のフィルターとして使用されます。 マルチタイムフレーム分析:   M5 から H1 または H4 まで、さまざまなタイムフレームで市場を常に把握します。 カスタマイズ可能なアラート: カスタム取引条件が満たされ
ご紹介     Quantum Breakout PRO は 、ブレイクアウト ゾーンの取引方法を変革する画期的な MQL5 インジケーターです。 13年以上の取引経験を持つ経験豊富なトレーダーのチームによって開発されました。     クォンタム ブレイクアウト プロ   は、革新的でダイナミックなブレイクアウト ゾーン戦略により、あなたのトレーディングの旅を新たな高みに押し上げるように設計されています。 クォンタム ブレイクアウト インジケーターは、5 つの利益ターゲット ゾーンを備えたブレイクアウト ゾーン上のシグナル矢印と、ブレイクアウト ボックスに基づいたストップロスの提案を提供します。 初心者トレーダーにもプロのトレーダーにも適しています。 量子EAチャネル:       ここをクリック 重要!購入後、インストールマニュアルを受け取るためにプライベートメッセージを送ってください。 推奨事項: 時間枠: M15 通貨ペア: GBPJPY、EURJPY、USDJPY、NZDUSD、XAUUSD アカウントの種類: ECN、Raw、またはスプレッドが非常に低い R
トレンド スクリーナー インジケーターでトレンド取引の力を解き放ちます。ファジー ロジックと複数通貨システムを活用した究極のトレンド取引ソリューションです。 ファジー ロジックを活用した革新的なトレンド インジケーターである Trend Screener を使用して、トレンド取引を向上させます。 これは、13 を超えるプレミアム ツールと機能、および 3 つの取引戦略を組み合わせた強力なトレンド追跡インジケーターであり、Metatrader をトレンド アナライザーにする多用途の選択肢となります。 期間限定オファー : トレンド スクリーナー インジケーターは、わずか 100 ドルで生涯ご利用いただけます。 (元の価格 50$ ) (オファー延長) Trend Screener の 100% 非再描画精度の揺るぎない精度を体験して、取引の決定が過去の価格変動の影響を受けないようにしてください。 マルチタイムフレームおよびマルチ通貨機能の多用途性を解放し、比類のない自信を持って外国為替、商品、暗号通貨、インデックスの世界を取引できるようにします。 Trend Screener の包括的な
Market Structure Order Block Dashboard MT5 は、 MT5(MetaTrader 5)用インジケーター です。 市場構造 と ICT / Smart Money Concepts に基づき、 HH/HL/LH/LL 、 BOS 、 ChoCH に加えて、 Order Blocks 、 Fair Value Gaps (FVG) 、 流動性 (EQH/EQL、sweeps)、 セッション / Kill Zones 、 Volume Profile を表示し、コンパクトなコンフルエンス・ダッシュボードを提供します。 重要: これは 分析ツール です。自動売買は行いません(EAではありません)。 購入者特典(ボーナス) 購入後、私のストアから 2つのボーナスインジケーター を(選択して)受け取ることができます。 ボーナスの受け取り方法: 1) 本商品のページに正直なレビューを投稿してください。 2) MQL5のメッセージで、 BONUS MSOB + 選んだ 2つのインジケーター名 を送ってください。 主な機能 市場構造: HH/HL/LH/LL
Crystal Heikin Ashi Signals - Professional Trend & Signal Detection Indicator Advanced Heikin Ashi Visualization with Intelligent Signal System for Manual & Automated Trading Final Price: $149 ---------> Price goes up $10 after every 10 sales . Limited slots available — act fast . Overview Crystal Heikin Ashi Signals is a professional-grade MetaTrader 5 indicator that combines pure Heikin Ashi candle visualization with an advanced momentum-shift detection system. Designed for both manual traders
The Trend Forecaster indicator utilizes a unique proprietary algorithm to determine entry points for a breakout trading strategy. The indicator identifies price clusters, analyzes price movement near levels, and provides a signal when the price breaks through a level. The Trend Forecaster indicator is suitable for all financial assets, including currencies (Forex), metals, stocks, indices, and cryptocurrencies. You can also adjust the indicator to work on any time frames, although it is recommen
現在33%オフ 初心者にもエキスパートトレーダーにも最適なソリューション このインジケーターは独自の機能と新しい公式を多数内蔵しており、ユニークで高品質かつ手頃な取引ツールです。このアップデートでは、2つの時間枠ゾーンを表示できるようになります。より長いTFだけでなく、チャートTFとより長いTF(ネストゾーンを表示)の両方を表示できます。すべてのSupply Demandトレーダーの皆さんのお気に召すはずです。:) 重要情報の公開 Advanced Supply Demandの可能性を最大化するには、 https://www.mql5.com/ja/blogs/post/720245 にアクセスしてください。   エントリーまたはターゲットの正確なトリガーポイントを正確に特定できれば取引がどのように改善されるか想像してみてください。新しい基盤となるアルゴリズムに基づいて構築されているため、買い手と売り手の間の潜在的な不均衡をさらに簡単に特定できます。これは、最も強い需要と供給のゾーンと、過去のパフォーマンス(古いゾーンを表示)がグラフィカルに表現されるためです。これらの機能は、最適な
Smart Stop Indicator – チャート上で実現するインテリジェントなストップロス精度 概要 Smart Stop Indicator は、ストップロスを勘や感情ではなく、明確で体系的に設定したいトレーダーのために設計されています。本ツールは、クラシックなプライスアクション(高値更新・安値切り下げ)と最新のブレイクアウト認識ロジックを組み合わせ、次に来るべき論理的なストップレベルを正確に特定します。トレンド相場、レンジ、急速なブレイクアウト局面のいずれであっても、最適な SL ゾーンとその状態(“new”、“broken”、“valid”)をチャート上に直接表示します。さらに今回、SL 距離の %ADR 表示も新たに追加されています。 主な特徴 マーケット構造に基づく自動ストップ配置 • 市場構造とリアルタイムの値動きに基づき、意味のあるストップロスレベルを自動検出します。 スマートなブレイクアウト感知 • 急激な方向転換やブレイクアウトにも柔軟に対応し、早すぎるストップ調整を避けます。 SL %ADR の表示 • ストップロスまでの距離を ADR(Averag
このインジケーターは、反転ポイントと価格戻りゾーンを正確に表示します。     主要プレーヤー 。新たなトレンドが形成される場所を把握し、最大限の精度で意思決定を行い、すべての取引をコントロールします。 TREND LINES PRO インジケーターと組み合わせることで、その潜在能力を最大限に発揮します。 VERSION MT4 インジケーターが示す内容: 新しいトレンドの始まりに活性化する反転構造と反転レベル。 リスクと報酬の比率を最小限に抑えた利益 確定 と 損失停止の レベルの表示     RR 1:2   。 インテリジェントな削減ロジックによるストップロス。 指定されたインジケーターから 2 つのトレンド タイプの反転パターンを表示します。 指標: トレンドを追う   TREND LINES PRO   (世界的なトレンドの変化) TREND PRO   (クイックトレンド変更) シンプルで効果的   スキャナー   リアルタイムトレンド(新機能)。 マルチタイムフレームのインストゥルメント フィルタリング。 画面   利益     LOGIC AI信号の後。 当日プラス方
Matrix Arrow Indicator MT5
Juvenille Emperor Limited
5 (19)
マトリックスアローインジケーターMT5は、すべてのシンボル/商品(外国為替、商品、暗号通貨、インデックス、株式)で使用できる100%再描画されていないマルチタイムフレームインジケーターに続くユニークな10in1トレンドです。マトリックスアローインジケーターMT5は、初期段階で現在のトレンドを判断し、最大10の標準インジケーターから情報とデータを収集します。 平均方向移動指数(ADX) 商品チャネルインデックス(CCI) クラシック平研アシキャンドル 移動平均 移動平均収束発散(MACD) 相対活力指数(RVI) 相対力指数(RSI) 放物線SAR ストキャスティクス ウィリアムズのパーセント範囲 すべてのインジケーターが有効な買いまたは売りシグナルを与えると、対応する矢印がチャートに印刷され、次のろうそく/バーの開始時に強い上昇トレンド/下降トレンドを示します。ユーザーは、使用するインジケーターを選択し、各インジケーターのパラメーターを個別に調整できます。マトリックスアローインジケーターMT5は選択されたインディケーターからのみ情報を収集し、それらのデータのみに基づいてアローを印刷
フィルタ:
レビューなし
レビューに返信