Stochastics crossover scanner MT5

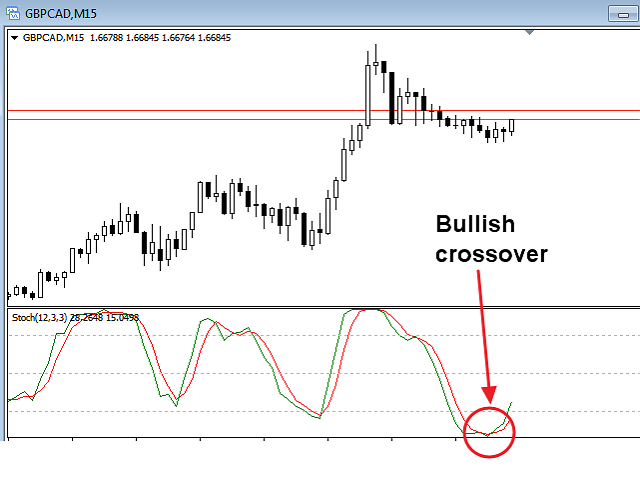
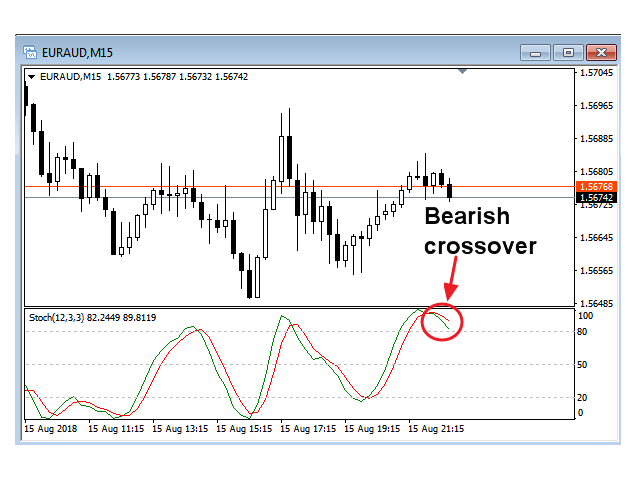
このマルチタイムフレームおよびマルチシンボルインジケーターは、ストキャスティクスシグナルラインがストキャスティクスメインラインと交差する時期を識別します。代替手段として、ストキャスティクスが買われ過ぎ/売られ過ぎの領域から(シグナルラインがメインラインを横切ることなく)離れるときに警告することもできます。ボーナスとして、ボリンジャーバンドやRSIの買われ過ぎ/売られ過ぎのクロスもスキャンできます。このインジケーターを独自のルールやテクニックと組み合わせることで、独自の強力なシステムを作成 (または強化) することができます。

特徴

  • 相場監視ウィンドウに表示されているすべてのシンボルを同時に監視できます。インジケーターを 1 つのチャートに適用すると、市場全体を瞬時に監視できます。
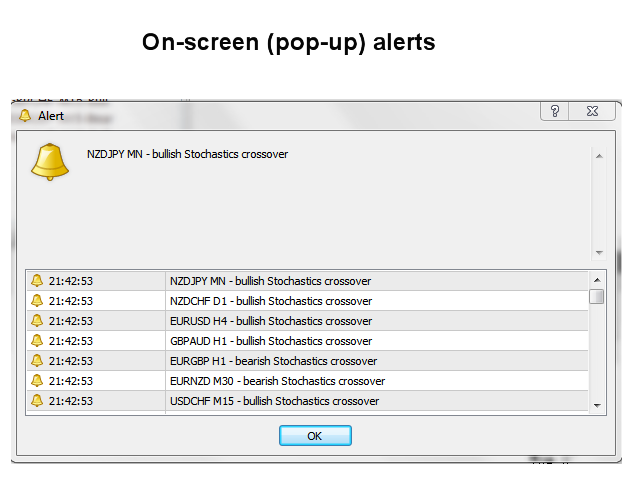
  • M1 から MN までのすべてのタイムフレームを監視でき、クロスオーバーが特定されたときにリアルタイムのアラートを送信します。すべての Metatrader ネイティブ アラート タイプがサポートされています。
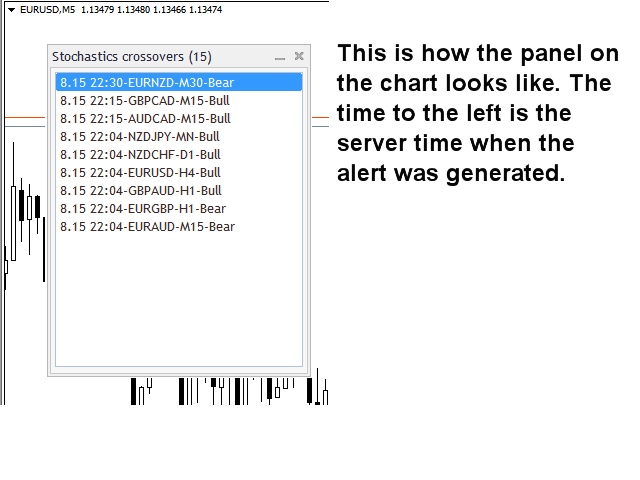
  • インジケーターには対話型パネルが含まれています。説明については、別のスクリーンショットを参照してください。
  • インジケーターはシグナルをテキスト ファイルに書き込むことができます またはグローバル変数に これは、エキスパートアドバイザー (EA) による自動取引に使用できます。例えばこの商品

入力パラメータ

入力パラメータの説明と説明は、 ここにあります

重要

多機能のため、インジケーターがインストールされているチャートには売買アドバイスも線や矢印も描画されないことに注意してください。代わりに、オブジェクトはチャート パネルでシグナルをクリックすると開くチャート上に描画されます。

スキャナーを妨げる可能性のある他のインジケーターやエキスパートアドバイザーのない、クリーンな (空の) チャート上にインジケーターを配置することを強くお勧めします。


おすすめのプロダクト
I recommend you to read the   product's blog  (manual) from start to end so that it is clear from the beginning what the indicactor offers. This multi time frame and multi symbol trend indicator sends an alert when a strong trend or trend reversal has been identified. It can do so by selecting to build up the dashboard using Moving average (single or double (both MA:s aligned and price above/below both)), RSI, Bollinger bands, ADX, Composite index (Constance M. Brown), Awesome (Bill Williams), 
MTF Market Structure ZigZag is a multi-timeframe structure indicator for MetaTrader 5. It maps ZigZag-based swing structure from up to four selected timeframes onto the active chart and helps traders read trend continuation and structural shifts more clearly. The indicator can display: ZigZag swing lines market structure labels: HH, HL, LH, LL BOS (Break of Structure) events CHoCH (Change of Character) events optional horizontal break lines shifted to the right BOS and CHoCH are confirmed by can
Apex Level MT5
Solomon Ndirangu Macharia
Apex Level MT5 is a high discipline, stable and long term growth momentum EA designed to exploit significant price levels in the market. It doesn't guess where the market might go, it waits for the market to commit to a direction and then follows the flow and by focusing on daily liquidity expansion, the EA avoids the noise of midday trading which results in a cleaner equity curve and high quality setups. EA philosophy Quality over Quantity: The Ea focuses on the most important breakout levels o
DYJ WITHDRAWAL PLAN:トレンド転換型自動売買システム 一、DYJ WITHDRAWAL PLANとは? DYJ WITHDRAWAL PLAN   は、市場のトレンドが転換する瞬間を自動で捉えて、 売買(エントリー&決済)   を行う トレンド転換型自動売買システム です。 本システムは、 あらゆる取引商品 、 すべてのブローカー に対応しており、 FX(外国為替)   や   合成指数(Synthetic Index)   など幅広い市場で利用可能です。 二、主要な機能と特徴 市場のトレンド転換を自動で検出 し、最適なタイミングで売買を実行します。 どの取引商品、どのブローカー でもスムーズに稼働します。 分かりやすい 基本設定項目 : テイクプロフィット(TP/利益確定) ストップロス(SL/損切り) グリッド間隔 目標利益 最低証拠金 取引開始後、リアルタイムで各商品の利益状況を表示 します。 各商品の 自動利益追跡機能 、および グローバル利益追跡機能 を搭載し、口座全体の利益状況も一目瞭然です。 三、AI搭載のマニュアル取引サポート DYJ WITHDR
Double Fractal Entry Bot trades automatically using fractal breakouts or rebounds. It detects precise entry points, places SL and TP based on market structure, and includes logic to manage risk and avoid false signals. Simple, smart, and powerful. This product is also available for MetaTrader 4 =>  https://www.mql5.com/en/market/product/143609 Double Fractal Entry Bot is an intelligent trading robot based on the proven logic of the Double Fractal Entry indicator. It analyzes price using upper a
Moving pivot Average Fibonacci The  indicator compares the selected period with its counterpart from the previous period. The indicator determines the moving Fibonacci levels for the day or any time interval to assess the price movement range from the time average. The indicator helps predict the expected high or low for the day based on historical time data. The pivot line can be considered an average trend line and use it in a variety of trading strategies. If you have any question about the
Signal Eskiya, in addition to channel lines, reflects entry signals in the form of arrows. Trading strategies using the channel indicator belong to the classic methods of technical analysis, are easy to execute, and therefore available even to beginners. Price ranges work equally well on any trading assets and timeframes, they can be used both independently and with additional confirmation from oscillators and market volumes. American traders say: “Trend is your friend”, which means “Trend is
Title: Dynamic SR Levels Pro Short Description: A next-generation, multi-timeframe Support & Resistance indicator that automatically detects, adapts, and invalidates key price zones based on real-time market volatility. Stop guessing, start seeing. Full Description: Tired of manually drawing support and resistance lines that quickly become outdated? Dynamic SR Levels Pro is the ultimate solution for traders who demand precision, adaptability, and a clean, clutter-free chart. This is not just ano
Haven Market Structure PRO - あなたのプロフェッショナル市場アナリスト ご紹介するのは  Haven Market Structure PRO  です。これは単なるインジケーターではなく、プライスアクションとスマートマネーの主要概念に基づいた、価格動向の分析を自動化するための完全なシステムです。このPROバージョンは、チャートを最大限にコントロールし、市場の全体像を把握したいと考えるトレーダーのために作成されました。 その他の製品 ->  こちら 市場構造の理解は、収益性の高い取引の基盤です。このインジケーターは最も重要な構造要素を自動的に特定し、あなたが慎重な取引判断を下すための時間を確保します。 インジケーターの主要シグナル BOS (Break of Structure / 構造の突破)  – 価格が前の高値(上昇トレンド中)または安値(下降トレンド中)を突破したときに発生します。これは  現在のトレンドの強さの確認  となります。 CHoCH (Change of Character / 性質の変化)  – 価格が逆方向に構造を突破したときに起こり
I  recommend you to read the   product's blog  (manual) from start to end so that it is clear from the beginning what the indicator offers. This multi time frame and multi symbol indicator scans for engulfing and tweezer formations.  The indicator can also be used in single chart mode. Combined with your own rules and techniques, this indicator will allow you to create (or enhance) your own powerful system. Features Can monitor all symbols visible in your Market Watch window at the same time. A
Adaptive SR Zones – Breakout Edition Adaptive SR Zones is a next-generation MetaTrader 5 indicator that automatically maps support and resistance zones and tracks breakout activity in real time. Designed for traders who rely on market structure and zone confluence, it combines multi-timeframe analysis , breakout confirmation logic , and customizable alerts into one powerful tool. No repainting. Core Features Dynamic Support & Resistance Mapping Detects zones from swing highs/lows and reaction po
Liquidity Map  Overview The Liquidity Map indicator is an advanced visualization tool based on ICT Smart Money Concepts . It automatically identifies daily Buy Zones , Sell Zones , and Liquidity Levels , showing where price is likely to reverse or continue based on institutional order flow. It calculates key levels from the daily session — such as the previous day’s high, low, and midpoint — then derives a premium (sell bias) and discount (buy bias) structure. When price trades into these mapped
The indicator ‘Probability Range Bands’ gives a prediction of the amount, how much the asset is moving from its current price. The range bands give probabilities, that the candle close will not exceed this certain price level. It is also called the expected move for the current candle close.   This Indicator is based on statistical methods, probabilities and volatility. Asset price is assumed to follow a log-normal distribution. Therefore, log returns are used in this indicator to determine the
Linha PCM Fimathe
Anderson Maicon De Vargas Odorcik
1 (1)
Manual de Instalação e Configuração Para que você tenha a melhor experiência profissional, siga estes passos simples para preparar o seu terminal: 1. Ativação no Terminal (Ajuste de Segurança) Antes de começar, precisamos garantir que o MetaTrader permita que você manipule a ferramenta livremente: Pressione Ctrl + O para abrir as Opções . Vá na aba Gráficos . Marque a opção: "Selecionar objetos com um clique do mouse" . Isso permitirá que você ajuste a régua de medição de forma instantânea. 2. V
Rectangle Editor – Control total sobre tus zonas Rectangle Editor es una herramienta avanzada diseñada para traders que utilizan zonas, bloques o áreas de interés en su operativa. Permite , editar y gestionar rectángulos directamente en el gráfico de forma rápida, precisa y profesional. El indicador facilita la manipulación de objetos rectangulares en el gráfico, permitiendo: Dibujar zonas de oferta y demanda Marcar Order Blocks Delimitar Fair Value Gaps (FVG) Definir zonas de ent
FREE
Santa Trend
Marco Aurelio Cestari
4.4 (5)
Santa Trend Indicator  is an efficient way to forecast and detect the trend in any market. Advantages Generates instant buy and sell signals. Provides an alternate exit strategy to your existing trading system. Never repaints, never backpaints, never recalculates. Works in all symbols and all timeframes. Perfect trend filter for any strategy or expert advisor. Fully compatible with Expert Advisor (EA) development. Does not lag.
FREE
アップデート版の無料公開中です。 140ダウンロードありがとうございます。 動画は   Ver. 034.30   原資1, 000ドル/レバレッジ25倍 テストの一例です。 Ver. 034.33  リリース致しました。 継続して内部で調整していますが、 枚数の設定は外してエントリーできる維持率の限度を調整することで資金管理します。 以前に比較してエントリー数が増加すると共に一時的なドローダウンは増加することがあります。余剰資金を多めにするか、レバレッジを高く設定する必要があります。 エントリーできない不具合について このページの最後に まとめています。改善の都度アップデートします。 基本事項 プラットフォーム:MetaTrader 5 通貨ペア:EUR-USD チャート:5分足 EUR-USD  の5分足のチャートを表示して、セットします。 1分足と同等という認識になりましたので5分足とします。 ブローカーによって調整が必要な場合がございます。 MT5に慣れていらっしゃらない方向け MT4メインでお使いのために慣れていらっしゃらない方もおられるかと存じます。 最もメジャーな
FREE
Simple indicator to calculate fibonacci retracement levels on time. Add to chart and move trend line to set the fibonacci retracement levels. Inputs Levels  - levels for which to calculate values, separated by space, default are fibonacci levels Show time  - if true, time will be shown on levels Show date  - if true, date will be shown on levels Show fibonacci level  - if true, value of levels will be shown Fibonacci lines color  - color of levels Trend line color  - color of trend line which de
FREE
I recommend you to read the  product's blog  (manual) from start to end so that it is clear from the beginning what the indicator offers. This multi time frame and multi symbol supply and demand zone dashboard indicator sends alerts when the price has reached a supply/demand zone. It is also possible to use it to be alerted about regular double tops/bottoms instead of zones. It can be used with all time frames from M1 to MN. Maximum 9 time frames can be shown in the dashboard at the same time. 
Most traders buy oversold and sell overbought. This system does the exact opposite — on purpose. In strong trending markets, price can stay overbought or oversold for a very long time. We deliberately enter when the market is already “stretched” because that is exactly when the trend is strongest and most likely to continue. We put a tight Stop Loss (eg. 3 ATR) and hold the position till the trend ends. This is the same style of the famous Turtles traders.
Send me a message so I can send you the setfile 複数の構成が可能な堅牢なロボット 以下のスクリーンショットの設定を使用して、10 分間の時間枠で BTC を使用します。 エキスパート ロボットを購入すると、ボットを継続的に改善するために変更を要求する権利があります。 主な特徴 移動平均クロスオーバー戦略: EA は 2 つの移動平均 (MA1 と MA2) を使用して取引シグナルを生成します。 より速い MA (MA1) がより遅い MA (MA2) より上または下にクロスオーバーすると、取引がトリガーされます。 マーチンゲール戦略: 取引で損失が発生した場合、次の取引のロット サイズは乗数 (martingaleMultiplier) によって増加されます。 マーチンゲール シーケンスは、トレードが成功した後、またはマーチンゲール ステップの最大数 (maxMartingale) に達したときにリセットされます。 リスク管理: ストップロス(SL)とテイクプロフィット(TP)のレベルは設定可能です。 利益を確定し
Opening Range Pro WHAT DOES THIS INDICATOR DO? The Opening Range indicator marks the highest and lowest price reached during a specific time window that you define (for example, the first 15 minutes of the New York session). Once that window closes, it draws two horizontal lines — one at the high and one at the low — extending across the rest of the trading day, so you can see at a glance whether price is above or below the range, and use those levels as reference for your trading decisions.
Product Title: Break of Structure (BOS) Signal Indicator (Price Action / SMC) Product Description: Effortlessly identify potential trend continuations with the Break of Structure (BOS) Signal Indicator for MetaTrader 5. Designed for traders using Price Action and Smart Money Concepts (SMC) , this indicator automatically detects and marks potential BOS events directly on your chart. Break of Structure is a key concept where price moves decisively beyond a prior swing high or low, often suggesting
SMC Workflow Auto EA
Choawana Malaikitsanachalee
English – Product Description (V1.42) SMC Workflow Auto EA — SR / OB / FVG with BOS–CHOCH Confirmation Smart-Money-Concepts Expert Advisor that trades only when a clean SMC setup appears: Order-Block retest after Break of Structure (BOS / CHOCH) confirmation, with optional SR and Fair Value Gap (FVG) confluence. The EA uses pending limit orders, fixed SL/TP or RR-based exits, step-lock trailing and strict risk-controls designed to pass broker validation. What it does Detects swing structure usi
FREE
Crow fvg pro ema
Cristobal Hidalgo Soriano
CROW FVG PRO + EMA Professional Fair Value Gap (FVG) indicator for MetaTrader 5 designed for traders looking for a clean, fast and functional market visualization. CROW FVG PRO + EMA automatically detects bullish and bearish FVG zones displaying professional visual areas with midpoint (50%) line, customizable borders and an optional fast EMA directly integrated into the chart. Perfect for: Scalping Intraday trading Momentum trading Trend continuation Liquidity pullbacks Main Features: Automatic
FREE
Heatmap Volume BarColor is a MetaTrader 5 companion indicator that colors your candlesticks on the main chart according to volume intensity. It uses the same volume logic as Heatmap Volume but applies the color directly to the candles, so you read volume strength without looking down at a separate window. Features On-chart candle coloring: paints each candle by how abnormal its volume is, measured in standard deviations from the volume moving average. Shared logic with Heatmap Volume: the same
FREE
SpikeHunter
Franklin Cornelio Perez Colina
Este es un indicador que trabaja en indices BOOM 1000 y su equivalente en Weltrade Gain 1200. Basicamente trabaja en temporalidad de 15 minutos y su objetivo es cazar spikes. Se recomienda la temporalidad de 15 minutos por que genera un poco mas de precision. Se recomienda indices que general altos spikes, como el BOOM 1000. Lo interesante de cazar spikes es que se puede gestionar el riesgo. La configuracion ideal para BOOM 1000 y Gain 1200  es la que esta por defecto.
**   All Symbols   x   All Time frames   scan just by pressing scanner button ** After 18 years of experience in the markets and programming, Winner indicator is ready. I would like to share with you! ***  Contact me to send you " Trend Finder indicator " free, instruction and add you in "M1 Signal Scanner group" for sharing or seeing experiences with other users. Introduction: M1 Signal Scanner   is the indicator designed scalping M1 time frame to detect Small trend switching in the direction
Adaptive Grid Engine Pro v1.70 is a next‑generation grid trading system designed for professional traders. It combines Multi‑Series Grid, Trend State Machine, ATR‑based dynamic spacing, Exponential TP This EA is engineered for XAUUSD, indices, and major forex pairs, supporting both single‑series and multi‑series trading with advanced trend logic. Gold Configuration –   Adaptive Grid Engine AGE Pro Symbol: XAUUSD Timeframe: M1 Account Type: Cent Account (≈ 20,000 USDC starting balance) Files: Ada
The Wamek Support and Resistant (WSR) Indicator is a remarkable tool that stands out in the world of technical analysis. It sets itself apart by cleverly combining price action and leading indicators to delineate support and resistance levels with a high degree of accuracy. Its unique feature is its adaptability; users can fine-tune the indicator by adjusting input parameters, enabling them to create customized support and resistance levels that suit their trading strategies. Notably, one of WSR
このプロダクトを購入した人は以下も購入しています
Neuro Poseidon is a new indicator by Daria Rezueva. It combines precise trading signals with adaptive TP/SL levels - creating best possible trades as a result! Message me and get  Neuro Poseidon Assistant  as a gift to automize your trading process! What makes it stand out? 1. Proven profitability on all assets and timeframes 2. Only confirmed BUY and SELL signals present on the chart 3. Adaptive TP & SL levels generated by the software for each trade 4. Easy to understand - suitable for al
SuperScalp Pro
Van Minh Nguyen
4.67 (27)
SuperScalp Pro – 高度なマルチフィルタースキャルピングインジケーターシステム SuperScalp Pro は、クラシックな Supertrend と複数のインテリジェント確認フィルターを組み合わせた高度なスキャルピングインジケーターです。M1 から H4 まで複数の時間足で効率的に動作し、XAUUSD、BTCUSD、主要 Forex 通貨ペア向けに最適化されています。 このインジケーターは明確な Buy / Sell シグナルを提供し、ATR に基づいてエントリー価格、Stop Loss、Take Profit を自動計算します。Fibonacci Take Profit 機能により、重要な価格帯で早期決済し、到達時に通知を送信します。 初期設定では Fibonacci Take Profit が有効化されており、より安定した取引体験を重視しています。チャートに適用するだけですぐ利用可能です。上級者向けに、すべてのパラメータは自由にカスタマイズできます。 完全なドキュメントは製品ブログにあります: [User Guide] SuperScalp Pro Auto T
まず正直に言いましょう。 どんなインジケーターも、それ単体であなたを利益化させることはできません。もしそう言う人がいるなら、それは夢を売っているだけです。完璧な売買シグナル(矢印)を表示するインジケーターは、いくらでも“完璧に見せる”ことができます。正しい過去の区間を拡大して、勝ちトレードだけを切り取ればいいだけです。私たちはそれをしません。 SMC Intraday Formula はツールです。 市場構造を読み取り、最も高い確率の価格ゾーンを特定し、今この瞬間のスマートマネーの痕跡をシンプルな言葉で正確に示します。最終判断はあなたが行います。トレードを実行するのもあなたです。しかし今は「希望」ではなく「精度」でエントリーできます。 私たちはこのインジケーターを、ゴールド(XAUUSD)および主要FX通貨ペアで約3年間、日々のスキャルピングに使用してきました。M1、M5、M15、M30の主要ツールです。これは未来を予測しようとするのではなく、今まさに形成されている高確率セットアップを示し、その理由を説明します。 他のすべてのインジケーターと何が違うのか? ほとんどのトレーディングイ
この製品は 2026 年の市場向けに更新され、最新の MT5 ビルドに最適化されています。 価格更新のお知らせ: Smart Trend Trading System は現在 $99 で提供されています。 次の 30 件の購入 後、価格は $199 に上がります。 特別オファー: Smart Trend Trading System を購入後、私にプライベートメッセージを送ることで、 Smart Universal EA を無料 で受け取り、Smart Trend のシグナルを自動売買に変えることができます。 Smart Trend Trading System は、リペイントなし、再描画なし、遅延なしの完全なトレーディングシステムです。よりクリーンなシグナル、より明確なトレンド方向、そしてより整理された取引方法を求めるトレーダー向けに作られています。 Online course , manual and download presets . このシステムは、トレンド検出、反転ゾーン、Smart Cloud、トレーリングストップロジック、サポートとレジスタンス、ローソク足の色分け、ア
Entry In The Zone and SMC Multi Timeframe is a real-time 2-in-1 market analysis tool that combines market structure analysis and a No Repaint BUY / SELL signal system into a single indicator, built on Smart Money Concepts (SMC) — a widely adopted framework used by professional traders to understand market structure. This indicator helps you see the market more clearly, make decisions based on structure rather than guesswork, and focus on high-probability zones where price is more likely to react
トレンドキャッチャーインジケーター トレンドキャッチャーインジケーターは、開発者独自の適応型トレンド分析指標を組み合わせることで、市場価格の動きを分析します。短期的なノイズを除去し、根底にあるモメンタムの強さ、ボラティリティの拡大、価格構造の挙動に焦点を当てることで、真の市場方向性を特定します。また、移動平均線、RSI、ボラティリティフィルターなどの平滑化およびトレンドフィルタリング機能を備えたカスタマイズ指標も使用します。 実際の運用状況のモニタリングやその他の製品については、こちらをご覧ください: https://www.mql5.com/en/users/mechanic/seller ご注意ください。私はTelegramでEAや設定を販売していません。詐欺です。すべての設定はブログで無料で公開しています。 重要!ご購入後すぐにご連絡ください。手順とボーナスをお送りします!
Quantum TrendPulse を ご紹介します。これは、   SuperTrend   、   RSI   、および Stochastic のパワーを 1 つの包括的なインジケーターに組み合わせて、取引の可能性を最大限に引き出す究極の取引ツールです。精度と効率を求めるトレーダー向けに設計されたこのインジケーターは、市場のトレンド、勢いの変化、最適なエントリー ポイントとエグジット ポイントを自信を持って特定するのに役立ちます。 主な特徴: SuperTrend 統合: 現在の市場動向に簡単に追従し、収益性の波に乗ることができます。 RSI精度: 買われすぎと売られすぎのレベルを検出し、市場の反転のタイミングに最適で、SuperTrendのフィルターとして使用されます。 確率的精度: 確率的振動を活用して、変動の激しい市場で隠れたチャンスを見つけます。SuperTrend のフィルターとして使用されます。 マルチタイムフレーム分析:   M5 から H1 または H4 まで、さまざまなタイムフレームで市場を常に把握します。 カスタマイズ可能なアラート: カスタム取引条件が満たされ
このインジケーターを購入された方には、以下の特典を 無料 で提供しています: 各トレードを自動で管理し、ストップロスとテイクプロフィットを設定し、戦略ルールに基づいてポジションを決済する補助ツール 「Bomber Utility」 様々な銘柄に合わせたインジケーターの設定ファイル(セットファイル) 「最小リスク」、「バランスリスク」、「待機戦略」 の3つのモードで使用できる Bomber Utility 用の設定ファイル このトレーディング戦略をすぐに導入・設定・開始できる ステップバイステップのビデオマニュアル ご注意: 上記の特典を受け取るには、MQL5のプライベートメッセージシステムを通じて販売者にご連絡ください。 オリジナルのカスタムインジケーター 「Divergence Bomber(ダイバージェンス・ボンバー)」 をご紹介します。これは、MACDのダイバージェンス(乖離)戦略に基づいた 「オールインワン」型のトレーディングシステム です。 このテクニカルインジケーターの主な目的は、価格とMACDインジケーターの間に発生するダイバージェンスを検出 し、将来の価格の動きを示す
PrimeScalping is a powerful trading companion designed to generate high-probability entry signals with dynamic TP/SL/DP levels based on volatility. Built-in performance tracking shows win/loss stats, PP1/PP2 hits, and success rates — all updated live. Key Features: Buy/Sell signals with adaptive volatility bands Real-time TP/SL/DP levels based on ATR Built-in MA Filter with optional ATR/StdDev volatility Performance stats panel (Success, Profit/Loss, PP1/PP2) Alerts via popup, sound, push, or e
Power Candles V3 - 自己最適化型強弱インジケーター Power Candles V3は 、通貨や銘柄の強さを、適用されたすべてのチャート上で実行可能なトレードプランに変換します。単にローソク足を色分けするだけでなく、バックグラウンドでリアルタイムの自動最適化を実行し、目の前の銘柄に対して最適なストップロス、テイクプロフィット、およびシグナルの閾値を提示します。ワンクリックで実取引に適用でき、エントリーポイント、ストップロス、テイクプロフィットのラインが正確な価格位置にチャート上に表示され、方向性を示すアラートがリアルタイムで発動します。 このツールは、Stein Investmentsのエコシステムの一部です。  18種類以上のツールをすべて閲覧し、AIを活用したセットアップの推奨事項を入手し、  https://stein.investments でコミュニティに参加しましょう クローズしたバーごとに3,000回以上のトレードシミュレーション。9つの強さの状態。2つの戦略を並行してテスト。勝率の高い設定をワンクリックで適用。 なぜこれが必要なのか ほとんどの強
FX Trend NG:次世代マルチマーケット・トレンドインテリジェンス 概要 FX Trend NG は、複数の時間足に対応したプロフェッショナル向けトレンド分析およびマーケット監視ツールです。 市場全体の構造を数秒で把握することができます。 複数のチャートを切り替える必要はありません。どの銘柄がトレンド中なのか、どこでモメンタムが弱まっているのか、そしてどの時間足で強い整合性があるのかを瞬時に確認できます。 ローンチ特別オファー – FX Trend NG を $30(6ヶ月) または $80 永久ライセンス でご利用いただけます。 すでに Stein Investments のユーザーですか? -> メッセージを送信 して、プライベートグループへアクセスしてください。 セットアップや詳細情報が必要ですか? -> Stein Investments 公式ページ をご覧ください。 1. FX Trend NG が他と異なる理由 3ステート・トレンドロジック ― Buy と Sell だけではない • 多くのインジケーターは Buy または Sell の2状態のみを表示します。
Gann Made Easy   は、ミスター・ギャンの理論を使用した取引の最良の原則に基づいた、プロフェッショナルで使いやすい外国為替取引システムです。 W・D・ガン。このインジケーターは、ストップロスとテイクプロフィットレベルを含む正確な買いと売りのシグナルを提供します。 PUSH通知を利用して外出先でも取引可能です。 ご購入後、取引方法の説明と優れた追加インジケーターを無料で入手するには、私にご連絡ください! おそらく、ギャンの取引手法についてはすでに何度も聞いたことがあるでしょう。通常、ギャンの理論は初心者のトレーダーだけでなく、すでにある程度の取引経験がある人にとっても非常に複雑なものです。なぜなら、ギャンの取引手法は理論的にはそれほど簡単に適用できるものではないからです。私はその知識を磨き、最良の原則を私の外国為替インジケーターに組み込むために数年を費やしました。 このインジケーターは非常に簡単に適用できます。必要なのは、それをチャートに添付し、簡単な取引推奨事項に従うだけです。このインジケーターは常に市場分析の仕事を行い、取引の機会を探します。適切なエントリーポイントを検
この製品は 2026 年の市場向けに更新され、最新の MT5 ビルドに最適化されています。 価格更新のお知らせ: Atomic Analyst は現在 $99 で提供されています。 次の 30 件の購入 後、価格は $199 に上がります。 特別オファー: Atomic Analyst を購入後、私にプライベートメッセージを送ることで、 Smart Universal EA を無料 で受け取り、Atomic Analyst のシグナルを自動売買に変えることができます。 Atomic Analyst は、リペイントなし、再描画なし、遅延なしの Price Action トレーディングインジケーターで、手動取引、シグナルの明確化、EA 自動化のために設計されています。 User manual: settings, inputs and strategy. 価格行動、強さ、モメンタム、マルチタイムフレーム方向、高度なフィルターを分析し、トレーダーがノイズを減らし、弱いセットアップを避け、より構造化された取引判断を行えるようにします。 このインジケーターは、複雑な市場計算をシンプルな視覚シ
開発者からのお知らせ: 129ドル で購入できるライセンスは残り 1つ です。売り切れ後、価格は 149ドル に変更されます。 M1 Quantum は、M1専用のプロフェッショナルトレーディングシステムであり、ストップロス、テイクプロフィット、スマートな資金管理を内蔵した、迅速かつ正確な取引シグナルを提供します。 M1 Quantum は、 連続勝利 に重点を置いて口座を素早く成長させるために設計されたプロフェッショナルな資金管理を備えています。 M1 Quantum インジケーター の主な特徴 M1時間足 およびすべての 主要通貨ペア 向けに設計 すべての取引にストップロスとテイクプロフィットを設定 資金管理 を実装し、トレーダーが簡単に取引できるようサポート 高い勝率と高い 連続勝利 リペイントなし、遅延なし あらゆるトレーダーにとって理解しやすい M1 Quantum を使用するには、 M1 Quantum Assistant が必要です。この強力なツールは、M1 Quantum をご購入いただいたすべてのお客様に 無料 で提供されています。 M1 Quantum Assis
この製品は 2026 年の市場向けに更新され、最新の MT5 ビルドに最適化されています。 価格更新のお知らせ: Smart Price Action Concepts は現在 $200 で提供されています。 次の 30 件の購入 後、価格は $299 に上がります。 特別オファー: 購入後、私にプライベートメッセージを送ることで、 無料ボーナス + ギフト を受け取ることができます。 まず、このトレーディングツールはリペイントなし、再描画なし、遅延なしのインジケーターであり、プロフェッショナルな取引に最適であることを強調しておきます。 Online course , and manual Smart Price Action Concepts Indicator は、初心者から経験豊富なトレーダーまで使える非常に強力なツールです。20 種類以上の便利なインジケーターを 1 つにまとめ、Inner Circle Trader Analysis や Smart Money Concepts Trading Strategies などの高度な取引アイデアを組み合わせています。このインジケ
Market Structure Order Block Dashboard MT5 は、市場構造と主要な価格反応ゾーンをチャート上で直接読み取りたいトレーダー向けに設計された MT5 インジケーターです。BOS、ChoCH、オーダーブロック、Fair Value Gap (FVG)、流動性、Kill Zones、Volume Profile、そして素早い分析のためのコンパクトなダッシュボードを組み合わせています。 本インジケーターは、市場構造、ICT、Smart Money の概念を意思決定の枠組みとして使用するトレーダーを対象としています。トレンド継続、反転の可能性、価格の不均衡、流動性ターゲット、注目ゾーンをより構造的に特定する助けとなります。 購入者向けの付属リソース 購入後、MQL5 のプライベートメッセージにてご依頼いただくと、完全な PDF ユーザーガイドとパラメータ設定のヒントを提供いたします。MQL5 のプライベートメッセージによる直接的な技術サポート。 バージョン 1.20 では 2 つの重要な追加機能があります: Pending BOS / Pending Cho
ARIPoint
Temirlan Kdyrkhan
1 (1)
ARIPoint is a powerful trading companion designed to generate high-probability entry signals with dynamic TP/SL/DP levels based on volatility. Built-in performance tracking shows win/loss stats, PP1/PP2 hits, and success rates all updated live. Key Features: Buy/Sell signals with adaptive volatility bands Real-time TP/SL/DP levels based on ATR Built-in MA Filter with optional ATR/StdDev volatility Performance stats panel (Success, Profit/Loss, PP1/PP2) Alerts via popup, sound, push, or email Cu
GoldenX Entryは、MT5向けのインジケーターであり、適応型Smart Entry Trendアルゴリズム、シグナルスコアリングシステム、マーケットレジーム検出機能、およびボラティリティフィルターを備えています。各シグナルには、計算されたエントリーレベル、3つのテイクプロフィット(TP1、TP2、TP3)、およびストップロスレベルが含まれます。本インジケーターは、異なる市場環境に適応するために設計された複数の分析レイヤー上に構築されており、マルチレイヤー分析システムと内蔵オプティマイザーおよび統計トラッキングシステムを組み合わせています。リスク・リワード(RR)指標および過去のトレード履歴に基づく定量分析を提供します。 使い始めは簡単です — 選択した時間足でオプティマイザーを実行し、そのままチャート上でインジケーターを使用します。 コア機能 GoldenX Entryは、シグナルエンジンとトレード管理機能、そして過去統計トラッキングを1つのチャートに統合しています: - 内蔵オプティマイザー: オプティマイザーはチャート上でワンクリックで実行できます。200通りのパラメー
Azimuth Pro
Ottaviano De Cicco
5 (7)
Azimuth Pro V2:MT5向けシンセティック・フラクタル構造分析と確認済みエントリー 概要 Azimuth Pro は Merkava Labs によるマルチレベルスイング構造インジケーターです。4つのネストされたスイングレイヤー、スイングアンカーVWAP、ABCパターン検出、3タイムフレーム構造フィルタリング、そして確定バーでの確認済みエントリー — 1つのチャートで、ミクロスイングからマクロサイクルまでを網羅するワークフロー。 これはブラインドシグナル製品ではありません。ロケーション、コンテキスト、タイミングを重視するトレーダーのための構造ファーストワークフローです。 V2発売記念オファー — Azimuth Pro V2をUSD 399で(次の100本)。最終価格:USD 499。 1. V2での変更点 シンセティック・マルチタイムフレームエンジン 上位タイムフレーム分析をMeridian Proと同じ独自のシンセティックアーキテクチャで一から再構築。よりクリーンなHTFコンテキスト、安定したライブ動作、従来のMTF同期問題なし。シンセティックエンジンは 固定比率タ
GEM Signal Pro GEM Signal Pro は、MetaTrader 5 向けのトレンドフォロー型インジケーターです。より明確なシグナル、より整理されたトレードセットアップ、そして実用的なリスク管理をチャート上で確認したいトレーダーのために設計されています。 単純な矢印だけを表示するのではなく、GEM Signal Pro はトレード全体の考え方を、より見やすく分かりやすい形で表示します。条件が確認されると、インジケーターはエントリー価格、ストップロス、利確目標をチャート上に表示し、トレードセットアップをより効率的に確認できるようにします。 動作の仕組み このインジケーターは、まず内部ロジックに基づいて有効なシードシグナルを検出します。 確認条件が満たされると、GEM Signal Pro はチャート上に完全なセットアップを表示します。これにより、トレーダーはトレード構造をより明確に把握し、手作業による分析を減らすことができます。 チャート上のトレードレベル 確認済みシグナルに対して、GEM Signal Pro は以下を表示できます。 エントリー価格 ストップロス テ
Crystal Heikin Ashi Signals - Professional Trend & Signal Detection Indicator Advanced Heikin Ashi Visualization with Intelligent Signal System for Manual & Automated Trading Final Price: $149 ---------> Price goes up $10 after every 10 sales . Limited slots available — act fast . Overview Crystal Heikin Ashi Signals is a professional-grade MetaTrader 5 indicator that combines pure Heikin Ashi candle visualization with an advanced momentum-shift detection system. Designed for both manual traders
Reversion King Indicator
Eugen-alexandru Zibileanu
5 (4)
新たな王者が登場 - インジケーター + 注文管理表示(TP1 + TP2 + TP3)+ オプションのTelegramシグナル送信機能付き(無料) (完全なトレード&シグナルシステム) ゴールド向け最高のEA: Gold Slayer このインジケーターには、高度な戦略、カスタマイズ可能な注文管理システム、そしてエンベロープ拡張を組み合わせた平均回帰システムが搭載されています。さらに、RSIなど複数のインテリジェントな確認フィルターによって、高確率の反転エントリーをBUY・SELLシグナルとして検出します。 単にトレードを学ぶだけでなく、複数ポジションを効果的に管理し、過去に利益を出しているオープンポジションで損失トレードをカバーする方法も学べます。 M5向けに構築・最適化されており、流動性が高くシグナルの精度が安定しているBTCUSDとXAUUSDで優れたパフォーマンスを発揮します。 このインジケーターは、ATRを基に自動計算されたエントリー、ストップロス、テイクプロフィットレベルを備えた明確なLong・Shortシグナルを提供するため、リスク管理が最初から組み込まれています。 マ
KURAMA GOLD SIGNAL PRO(MT5版)— 7層フィルター・自動TP/SL・品質スコア・サイン履歴保存搭載 XAUUSD完全トレードシステム リアルタイムでリペイントしません。サインが出た瞬間、矢印・エントリー・TP・SLはその場で固定され、後から動きません。あなたがトレードするのは、この「リアルタイムで出たサイン」です。さらにv7.20では、実際に通知されたサインを自動保存し、再起動後もそのまま復元します。 購入者限定特典 買い切りライセンスをご購入いただいた方に、AI Zone Radar($59相当)+完全PDFマニュアルを無料プレゼント。本体価格に$59相当の特典が付いてきます。購入後にMQL5でメッセージをお送りください。 AI Zone Radar: https://www.mql5.com/en/market/product/175834 ゴールドトレーダーのコミュニティで実際に使用され、精度と使いやすさで高く評価されています。 あな
Quant Direction は、3次元の市場分析ツールです。完全に客観的なアルゴリズムベースの市場分析を提供し、様々なパラメータにわたる正確なパーセンテージ偏差を同時に算出します。高度なAI搭載モデリングツールで開発され、厳密なテストを経て開発されたこのアルゴリズムは、かつてない精度で市場を分析するように設計されています。プラットフォーム上では、あらゆる通貨ペアや金融商品を分析できます。 短期取引、デイトレード、スイングトレードなど、どのような取引スタイルに も、Quant Directionは最適な選択肢です。 オペレーターの本当の利点 Quant Directionの真の利点は、感情、眼精疲労、過剰分析を完全に排除できる点にあります。方向性を探るために何十ものチャートを手作業で精査したり、自分の好みを常に疑ったりする必要がなくなります。このシステムは、8つの時間間隔(5ヶ月から月単位まで)をミリ秒単位で処理します。あらゆる瞬間に市場を支配している主体を正確に明らかにし、常に成功確率が最も高い方向で取引できるようにします。 市場分析の3つの側面 このアルゴリズムは市場を3つの
優れたテクニカルインジケーター「Grabber」をご紹介します。これは、すぐに使える「オールインワン」トレーディング戦略として機能します。 ひとつのコードに、市場のテクニカル分析ツール、取引シグナル(矢印)、アラート機能、プッシュ通知が強力に統合されています。 このインジケーターを購入された方には、以下の特典を無料で提供します: Grabberユーティリティ:オープンポジションを自動で管理するツール ステップバイステップのビデオマニュアル:インジケーターのインストール、設定、取引方法を解説 カスタムセットファイル:インジケーターをすばやく自動設定し、最大限の成果を出すための設定ファイル 他の戦略はもう忘れてください!Grabberだけが、あなたを新たなトレードの高みへと導いてくれるのです。 Grabber戦略の主な特徴: 推奨タイムフレーム:M5〜H4 対応通貨ペア・資産:どれでも使用可能ですが、私が実際に検証した以下を推奨します(GBPUSD、GBPCAD、GBPCHF、AUDCAD、AUDUSD、AUDSGD、AUDCHF、NZDUSD、NZDCAD、EURCAD、EURUSD、E
ご紹介     Quantum Breakout PRO は 、ブレイクアウト ゾーンの取引方法を変革する画期的な MQL5 インジケーターです。 13年以上の取引経験を持つ経験豊富なトレーダーのチームによって開発されました。     クォンタム ブレイクアウト プロ   は、革新的でダイナミックなブレイクアウト ゾーン戦略により、あなたのトレーディングの旅を新たな高みに押し上げるように設計されています。 クォンタム ブレイクアウト インジケーターは、5 つの利益ターゲット ゾーンを備えたブレイクアウト ゾーン上のシグナル矢印と、ブレイクアウト ボックスに基づいたストップロスの提案を提供します。 初心者トレーダーにもプロのトレーダーにも適しています。 量子EAチャネル:       ここをクリック 重要!購入後、インストールマニュアルを受け取るためにプライベートメッセージを送ってください。 推奨事項: 時間枠: M15 通貨ペア: GBPJPY、EURJPY、USDJPY、NZDUSD、XAUUSD アカウントの種類: ECN、Raw、またはスプレッドが非常に低い R
SmartScalping is a powerful trading companion designed to generate high-probability entry signals with dynamic TP/SL/DP levels based on volatility. Built-in performance tracking shows win/loss stats, PP1/PP2 hits, and success rates — all updated live. Key Features: Buy/Sell signals with adaptive volatility bands Real-time TP/SL/DP levels based on ATR Built-in MA Filter with optional ATR/StdDev volatility Performance stats panel (Success, Profit/Loss, PP1/PP2) Alerts via popup, sound, push, or e
RelicusRoad Pro: 定量的市場オペレーティングシステム 【期間限定】無制限アクセス 70% OFF - 2,000人超のトレーダーと共に なぜ多くのトレーダーは「完璧な」インジケーターを使っても失敗するのでしょうか? それは、文脈を無視して 単一の概念 だけでトレードしているからです。文脈のないシグナルは単なるギャンブルです。勝ち続けるには、 根拠の重なり(コンフルエンス) が必要です。 RelicusRoad Proは単なる矢印インジケーターではありません。完全な 定量的市場エコシステム です。独自のボラティリティモデリングを用いて、価格が推移する「適正価値の道(Fair Value Road)」をマッピングし、ノイズと真の構造的ブレイクを判別します。 推測はやめましょう。機関投資家レベルの「ロード・ロジック」でトレードを。 コアエンジン:「Road」アルゴリズム システムの中心となる Road Algo は、市場環境にリアルタイムで適応するダイナミックなボラティリティチャネルです。 安全ライン(平衡点) と、価格が数学的に反転しやすい 拡張レベル を投影します。 Si
Smart Stop Indicator – チャート上で実現するインテリジェントなストップロス精度 概要 Smart Stop Indicator は、ストップロスを勘や感情ではなく、明確で体系的に設定したいトレーダーのために設計されています。本ツールは、クラシックなプライスアクション(高値更新・安値切り下げ)と最新のブレイクアウト認識ロジックを組み合わせ、次に来るべき論理的なストップレベルを正確に特定します。トレンド相場、レンジ、急速なブレイクアウト局面のいずれであっても、最適な SL ゾーンとその状態(“new”、“broken”、“valid”)をチャート上に直接表示します。さらに今回、SL 距離の %ADR 表示も新たに追加されています。 主な特徴 マーケット構造に基づく自動ストップ配置 • 市場構造とリアルタイムの値動きに基づき、意味のあるストップロスレベルを自動検出します。 スマートなブレイクアウト感知 • 急激な方向転換やブレイクアウトにも柔軟に対応し、早すぎるストップ調整を避けます。 SL %ADR の表示 • ストップロスまでの距離を ADR(Averag
This indicator automatically detects  internal & swing market structure, Breaker block, Strong Imbalance, Liquidity Void, Volume imbalance. Features Full internal & swing market structure labeling in real-time Breaker block Strong Imbalance Liquidity Void volume imbalance After purchasing the indicator, the full source code is provided, and via indicator buffers it can be easily integrated into your Expert Advisors (EAs) for automated trading strategies.
作者のその他のプロダクト
The indicator identifies when a divergence occurs between price and an indicator or oscillator. It identifies both regular and hidden divergences. Combined with your own rules and techniques, this indicator will allow you to create (or enhance) your own powerful system. For higher probability setups I can recommend you to use my Supply Demand indicator and trade only if the divergence occurs inside a zone. Supply zone for bearish div and demand zone for bullish div. The optimal scenario is if it
FREE
このインジケーターは、チャート上に需要と供給のゾーンを描画します。独自のルールやテクニックと組み合わせることで、このインジケーターを使用して独自の強力なシステムを作成 (または強化) できます。さらに多くの機能を提供する 有料版 もぜひご確認ください。私の推奨は、少なくとも 25 バー後に最初のゾーン テストが発生する取引機会を探すことです。 特徴 ゾーンには 3 つの色があります (入力によって調整可能)。テストされていないゾーンは暗い色、テスト済みのゾーンは中くらいの色 、壊れたゾーンは明るい色です 。 各ゾーンにはゾーン外枠の価格とゾーンテストの金額が記載されています。 入力パラメータ 最初の極値を検索するための最大バックバー数 -     デフォルトは 3000 です。最初の極値を xx バー分遡って検索します。値が大きいほど、より多くのシステム リソースが必要になります 。遅いコンピューターの場合は、500 ~ 1000 の値が適している場合があります。 ゾーンテスト間のキャンドルの最小数 未テストの需要色 テスト済みの需要色 壊れた需要の色 未テスト供給色 テスト済みの供給
FREE
インディケータは、価格とオシレーター/インディケーターの間に発散が発生したときを識別します。これは、通常の分岐と隠れた分岐の両方を識別します。最強のセットアップのみをフィルターで除外できるRSIフィルターオプションがあります。インディケータは、巻き込みフォーメーション、ドンチアンチャネルブレイクアウト、または移動平均を超える価格を待つオプションも提供します (スクリーンショット#3を参照)     貿易機会を知らせる前に発散を確認する。独自のルールとテクニックを組み合わせることで、このインジケーターを使用して、独自の強力なシステムを作成(または強化)できます。 特徴 の終わりに     製品のブログ   インジケーターからトレードシグナルを取得するためにiCustom()関数を使用しているサンプルエキスパートアドバイザー(EA)のソースコードをダウンロードすることができます。 EAは完全に機能しますが、主な目的は、コードを使用して、独自に開発したEAに貼り付けることです。 限られた時間で   ただし、プログラミングサポートを提供することはできません。 謝罪いたします 次のオシレーター
I recommend you to read the   product's blog  (manual) from start to end so that it is clear from the beginning what the indicactor offers. This multi time frame and multi symbol indicator identifies double or triple top/bottom formations or a following neckline breakout (confirmed top/bottom). It offers filters for RSI overbought/oversold, candle patterns (pin bar, engulfing, tweezer, morning/evening star, three line strike) and divergences (MACD, OsMA, Awesome (AO), RSI, CCI, Stochastic) whic
I  recommend you to read the   product's blog  (manual) from start to end so that it is clear from the beginning what the indicator offers. This multi time frame and multi symbol indicator scans for engulfing and tweezer formations.  The indicator can also be used in single chart mode. Combined with your own rules and techniques, this indicator will allow you to create (or enhance) your own powerful system. Features Can monitor all symbols visible in your Market Watch window at the same time. A
I  recommend you to read the   product's blog  (manual) from start to end so that it is clear from the beginning what the indicator offers. This multi time frame and multi symbol indicator scans for engulfing and tweezer formations. The indicator can also be used in single chart mode. Combined with your own rules and techniques, this indicator will allow you to create (or enhance) your own powerful system. Features Can monitor all symbols visible in your Market Watch window at the same time. Ap
This multi time frame and multi symbol indicator identifies high-probability breakout patterns. It does this by identifying strong, symmetrical pennants and triangles. This pattern  DOES NOT  appear very often on higher timeframes. But when it does, it is a very high-probability setup. The indicator also includes an Inside bars scanner. It can for example be used to detect a special type of Inside bars formation which is formed by a Master candle (MC) followed by 4 inside candles (please see the
この需給ゾーンインジケーターはチャート上にゾーンを描画し、価格がゾーンに到達またはゾーンを超えたときにアラートを送信します。ゾーンの代わりに、通常のダブルトップ/ボトムについてアラートを受け取るために使用することもできます。 RSI、ADX、ボリューム、および発散フィルターを使用して、最も強力なセットアップのみをフィルターで除外することができます。独自のルールとテクニックを組み合わせることで、このインジケーターを使用して、独自の強力なシステムを作成(または強化)できます。この指標は、需要と供給にすでに精通している経験豊富なトレーダー向けであり、取引を終了または開始することを決定する際にどのように使用できるかを示しています。 特徴 次の分岐がサポートされています。       MACD、OsMA、RSI、CCI、確率論的および素晴らしい。 ゾーンには3色があります(入力で調整可能)。テストされていないゾーンの場合は暗い色、テストされたゾーンの場合は中程度、壊れたゾーンの場合は明るい色。 ゾーンの外側の境界線の価格とゾーンテストの量は、各ゾーンで書き込まれます。 インディケータは、エキス
I recommend you to read the   product's blog  (manual) from start to end so that it is clear from the beginning what the indicactor offers. This multi time frame and multi symbol divergence dashboard indicator sends an alert when one or two different divergences have been identified. It can be used with all time frames from M1 to MN. Maximum 9 time frames can be shown in the dashboard at the same time. It is possible to enable moving average, RSI or Bollinger bands trend filter to filter out on
このインジケーターは、チャート上に需要と供給のゾーンを描画します。独自のルールやテクニックと組み合わせることで、このインジケーターを使用して独自の強力なシステムを作成 (または強化) できます。さらに多くの機能を提供する 有料版 もぜひご確認ください。私の推奨は、少なくとも 25 バー後に最初のゾーン テストが発生する取引機会を探すことです。 特徴 ゾーンには 3 つの色があります (入力によって調整可能)。テストされていないゾーンは暗い色、テスト済みのゾーンは中くらいの色 、壊れたゾーンは明るい色です 。 各ゾーンにはゾーン外枠の価格とゾーンテストの金額が記載されています。 入力パラメータ 最初の極値を検索するための最大バックバー数 -     デフォルトは 3000 です。最初の極値を xx バー分遡って検索します。値が大きいほど、より多くのシステム リソースが必要になります 。遅いコンピューターの場合は、500 ~ 1000 の値が適している場合があります。 ゾーンテスト間のキャンドルの最小数 未テストの需要色 テスト済みの需要色 壊れた需要の色 未テスト供給色 テスト済みの供給
FREE
This indicator can send alerts when a Heiken Ashi Smoothed color change occurs. Combined with your own rules and techniques, this indicator will allow you to create (or enhance) your own powerful system. Features Can send all types of alerts. Option to delay the alert one or more bars in order to confirm the color (trend) change. Input parameters Candle shift for alert: Default is 1. Setting it to 0 will alert you on color change on the current candle. This should be regarded as a pending (uncon
FREE
I recommend you to read the   product's blog  (manual) from start to end so that it is clear from the beginning what the indicactor offers. This multi time frame and multi symbol indicator identifies double or triple top/bottom formations or a following neckline breakout (confirmed top/bottom). It offers RSI, pin bar, engulfing, tweezer, morning/evening star filters as well divergence filter options which makes it possible to filter out only the strongest setups. The indicator can also be used
The indicator identifies when a divergence occurs between price and an indicator or oscillator. It identifies bullish and bearish hidden or regular (classical) divergences. Combined with your own rules and techniques, this indicator will allow you to create (or enhance) your own powerful system. For higher probability setups I can recommend you to use my  Supply Demand indicator  and trade only if the divergence occurs inside a zone. Supply zone for bearish div and demand zone for bullish div. T
FREE
このマルチタイムフレームとマルチシンボルインジケーターは、次の5つのクロスを識別できます。 動きの速い平均が動きの遅い平均線と交差するとき。 価格が単一の移動平均に達したとき(上/下で閉じているか、ちょうど跳ね返った)。 三重移動平均フォーメーションが出現したとき(3つのMAすべてが連続して整列) MACDメインラインがシグナルラインと交差するとき。 信号線がMACDzero(0)線と交差するとき。 このインジケーターを独自のルールや手法と組み合わせると、独自の強力なシステムを作成(または強化)できます。 特徴 マーケットウォッチウィンドウに表示されている選択したシンボルを同時に監視できます。インジケーターを1つのチャートに適用し、市場全体を即座に監視します。 M1からMNまでのすべての時間枠を監視でき、クロスオーバーが識別されたときにリアルタイムのアラートを送信します。すべてのアラートタイプがサポートされています。 追加のトレンドフィルターとしてRSIを使用できます。 インジケータには、インタラクティブパネルが含まれています。アイテムをクリックすると、問題のシンボルと時間枠で新しいチ
可能であれば購入をご検討ください   私が開発を続ける MT5 バージョン (この MT4 バージョンの今後の更新はありません)。こちらもお読みになることをお勧めします     製品のブログ (マニュアル) を最初から最後まで参照して、EA が提供するものを最初から明確にします。 このエキスパートアドバイザー (EA) の主な戦略は、3 つの移動平均 (MA) が連続して整列し、互いに一定の距離にある場合に取引を行うことです (たとえば、一部の機関投資家が使用するあまり知られていない戦略に使用できます)。 、これには D1 時間枠の MA 10、20、および 30 が含まれます)。 EA は、H1 以降の時間枠で最適に機能します。トリプル MA 戦略 (使用される MA: に関係なく) は、長期的な戦略と見なす必要があります。悪い月が続くかもしれません。したがって、この EA は、頻繁な取引と短期的な一定の利益を求めるトレーダー向けではありません。デフォルト設定は EURUSD H1 用に最適化されています (2015.01.01 から 2022.03.31 までのバックテスト、22
This indicator can send alerts when a Heiken Ashi Smoothed color change occurs. Combined with your own rules and techniques, this indicator will allow you to create (or enhance) your own powerful system. Features Can send all types of alerts. Option to delay the alert one bar in order to confirm the color (trend) change. Input parameters Wait for candle close: 'true' or 'false'. Setting it to 'true' will delay the alert to the opening of the bar following the bar where the color change occurred.
FREE
この需給ゾーンインジケーターはチャート上にゾーンを描画し、価格がゾーンに到達またはゾーンを超えたときにアラートを送信します。ゾーンの代わりに、通常のダブルトップ/ボトムについてアラートを受け取るために使用することもできます。 RSI、ADX、ボリューム、および発散フィルターを使用して、最も強力なセットアップのみをフィルターで除外することができます。独自のルールとテクニックを組み合わせることで、このインジケーターを使用して、独自の強力なシステムを作成(または強化)できます。この指標は、需要と供給にすでに精通している経験豊富なトレーダー向けであり、取引を終了または開始することを決定する際にどのように使用できるかを示しています。 特徴 次の分岐がサポートされています。       MACD、OsMA、RSI、CCI、確率論的および素晴らしい。 ゾーンには3色があります(入力で調整可能)。テストされていないゾーンの場合は暗い色、テストされたゾーンの場合は中程度、壊れたゾーンの場合は明るい色。 ゾーンの外側の境界線の価格とゾーンテストの量は、各ゾーンで書き込まれます。 インディケータは、エキス
This multi indicator/oscillator (hereafter indicator), multi time frame and multi symbol indicator identifies when a divergence occurs between price and one, two or three indicators. It identifies both regular/classical (trend reversal) and hidden (trend continuation) divergences. It has RSI and MA trend filter options which makes it possible to filter out only the strongest setups. Combined with your own rules and techniques, this indicator will allow you to create (or enhance) your own powerfu
This multi indicator/oscillator (hereafter indicator), multi time frame and multi symbol indicator identifies when a divergence occurs between price and one, two or three indicators. It identifies both regular/classical (trend reversal) and hidden (trend continuation) divergences. It has RSI and MA trend filter options which makes it possible to filter out only the strongest setups. Combined with your own rules and techniques, this indicator will allow you to create (or enhance) your own powerfu
This multi time frame and multi symbol indicator scans for pin bars. Combined with your own rules and techniques, this indicator will allow you to create (or enhance) your own powerful system. Features Can monitor all symbols visible in your Market Watch window at the same time. Apply the indicator to just one chart and instantly monitor the entire market. Can monitors every time frame, from M1 to MN, and sends you a real-time alert when a pin bar is identified. All Metatrader native alert types
Features This is an indicator that recognizes a special type of Inside Bar formation which is formed by a Master candle followed by 4 smaller candles (please see the strategy explanation below). Plots buy/sell stop lines on the chart as well as well as take profit and stop loss levels. The TP/SL levels are based on the Average True Range (ATR) indicator. Object colors are changeable. Sends you a real-time alert when a Master candle formation is identified - sound / pop-up / email / push notifica
This indicator recognizes a special type of Inside Bar formation which is formed by a big Master candle followed by 4 smaller candles (please see the strategy explanation below). Features Plots buy/sell stop lines on the chart as well as well as take profit and stop loss levels. The TP/SL levels are based on the Average True Range (ATR) indicator. Object colors are changeable. Sends you a real-time alert when a Master candle formation is identified - sound / popup / email / push notification. On
ぜひ読んでみてください     製品のブログ (マニュアル)を最初から最後まで読んで、インジケーターが提供するものが最初から明確になるようにします。 このマルチタイムフレームおよびマルチシンボルインジケーターは、ピンバーをスキャンします。独自のルールとテクニックと組み合わせることで、このインジケーターを使用して独自の強力なシステムを作成 (または強化) できます。 特徴 マーケットウォッチウィンドウに表示されるすべてのシンボルを同時に監視できます。インジケーターを 1 つのチャートに適用するだけで、市場全体を即座に監視できます。 M1 から MN までのすべての時間枠を監視し、ピンバーが識別されるとリアルタイムのアラートを送信します。すべての Metatrader ネイティブ アラート タイプがサポートされています。 潜在的な反転を適切に識別するために、RSI をトレンド フィルターとして使用できます。 インジケーターにはインタラクティブ パネルが含まれています。別のスクリーンショットを参照してください。 買い/売りラインと TP/SL ライン (ATR 乗数に基づく) を表示するよ
This multi time frame and multi symbol indicator identifies high-probability breakout patterns. It does this by identifying strong, symmetrical pennants and triangles. This pattern DOES NOT appear very often on higher time frames. But when it does, it is a very high-probability setup. The indicator also includes an Inside bars scanner. It can for example be used to detect a special type of Inside bars formation which is formed by a Master candle (MC) followed by 4 inside candles (please see the
このマルチタイムフレームとマルチシンボルインジケーターは、ピンバー、朝/夕方の星、巻き込み、ピンセット、3つのラインストライク、内側のバー、ペナントと三角形をスキャンします。インジケーターはシングルチャートモードでも使用できます。このオプションの詳細については、製品の     ブログ 。独自のルールとテクニックを組み合わせることで、このインジケーターを使用して、独自の強力なシステムを作成(または強化)できます。 特徴 マーケットウォッチウィンドウに表示されているすべてのシンボルを同時に監視できます。インジケーターを1つのチャートに適用し、市場全体を即座に監視します。 M1からMNまでのすべての時間枠を監視し、パターンが識別されるとリアルタイムのアラート(ポップアップ、プッシュ、またはメール)を送信します。 潜在的な逆転を適切に特定するために、ピンバー、朝/夕方の星、巻き込み、ピンセットの形成のフィルターとしてRSIとボリンジャーバンドを使用できます。 主要なトレンドフィルターとして移動平均を使用し 、ボラティリティフィルターとしてADXを使用できます。 インジケーターにはインタラクティ
このマルチシンボルおよびマルチタイムフレームインジケーターは、次のローソク足パターンをスキャンします(パターンの説明についてはスクリーンショットを参照してください)。 3人の白人兵士(逆転>継続パターン) 3つの黒いカラス(反転>継続パターン) 強気と弱気のスリーラインストライク(反転パターン) インジケーター設定の厳密なオプションが有効になっている場合、パターンはより高い時間枠ではあまり頻繁に表示されません。しかし、そうする場合、それは非常に確率の高い設定です。 Thomas Bulkowski(国際的に有名な作家であり、ローソク足パターンの第一人者)によると、3ラインストライクはローソク足パターンの中で最高の全体的なパフォーマンスランクを持っています。このインジケーターを独自のルールや手法と組み合わせると、独自の強力なシステムを作成(または強化)できます。 特徴 マーケットウォッチウィンドウに表示されているすべてのシンボルを同時に監視できます。インジケーターを1つのチャートに適用し、市場全体を即座に監視します。 M1からMNまでのすべての時間枠を監視でき、パターンが識別されたときに
I recommend you to read the   product's blog  (manual) from start to end so that it is clear from the beginning what the indicactor offers. This multi time frame and multi symbol indicator can identify the following 5 crosses: when a fast moving average crosses a slow moving average line. when price has reached a single moving average (closed above/below or just bounced). when a triple moving average formation has appeared (all 3 MA:s in consecutive alignment). when the MACD main line crosses t
I recommend you to read the   product's blog  (manual) from start to end so that   it is clear from the beginning what the indicator offers. This multi oscillator, multi time frame and multi symbol indicator identifies when a divergence occurs between price and an oscillator/indicator. It identifies both regular/classical (trend reversal) and hidden (trend continuation) divergences. It has moving average, RSI/Bollinger, ADX, pin bar and engulfing filter options which makes it possible to filter
This multi time frame and multi symbol indicator identifies when the stochastics signal line (D) crosses the stochastics main line (K) as well as options  to scan for main line and signal line level crossovers.  As a bonus it can also scan for Bollinger bands and RSI overbought/oversold crosses. Combined with your own rules and techniques, this indicator will allow you to create (or enhance) your own powerful system. Features Can monitor all symbols visible in your Market Watch window at the sam
フィルタ:
レビューなし
レビューに返信