Stochastics crossover scanner MT5
- Indicatori
-
Jan Flodin
 Hello, my name is Jan and I have been developing automated trading tools for the last 9 years. I am originally from Sweden but have lived in the Czech Republic since 2003.
PRODUCTS - Versione: 1.4
- Aggiornato: 7 agosto 2023
- Attivazioni: 10
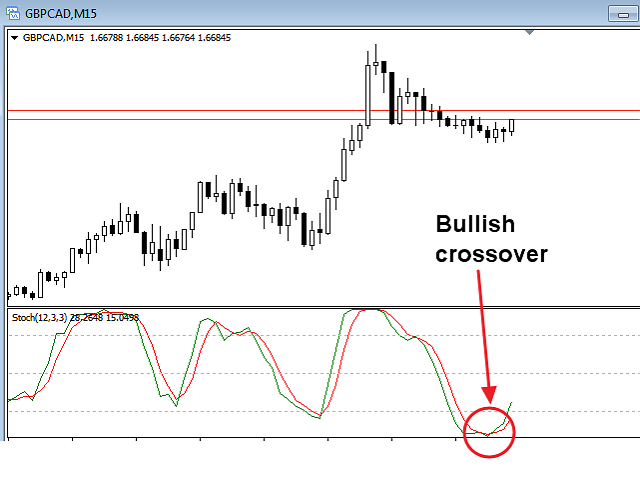
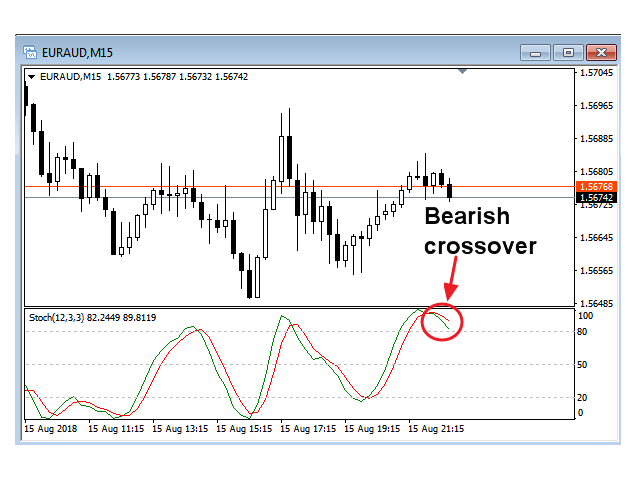
Questo indicatore multi time frame e multi simbolo identifica quando la linea del segnale stocastico attraversa la linea principale stocastica. In alternativa può anche avvisare quando lo stocastico sta lasciando (senza che la linea di segnale attraversi la linea principale) un'area di ipercomprato/ipervenduto. Come bonus può anche eseguire la scansione delle bande di Bollinger e degli incroci RSI ipercomprato/ipervenduto. Combinato con le tue regole e tecniche, questo indicatore ti permetterà di creare (o migliorare) il tuo potente sistema.
Caratteristiche
- Può monitorare contemporaneamente tutti i simboli visibili nella finestra Market Watch. Applica l'indicatore a un solo grafico e monitora istantaneamente l'intero mercato.
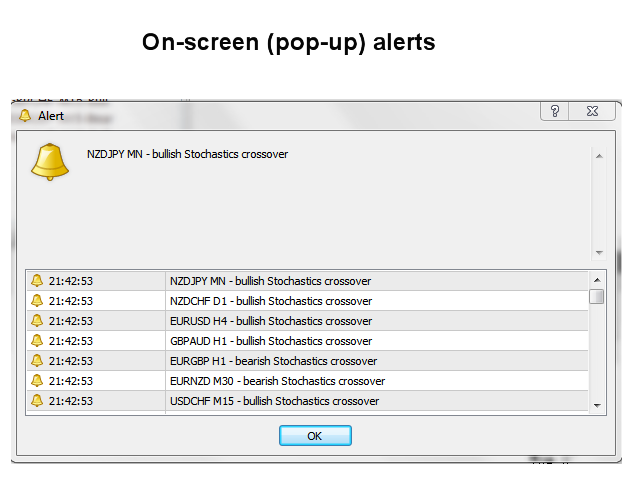
- Può monitorare ogni intervallo di tempo, da M1 a MN, e ti invia un avviso in tempo reale quando viene identificato un crossover. Sono supportati tutti i tipi di avvisi nativi di Metatrader.
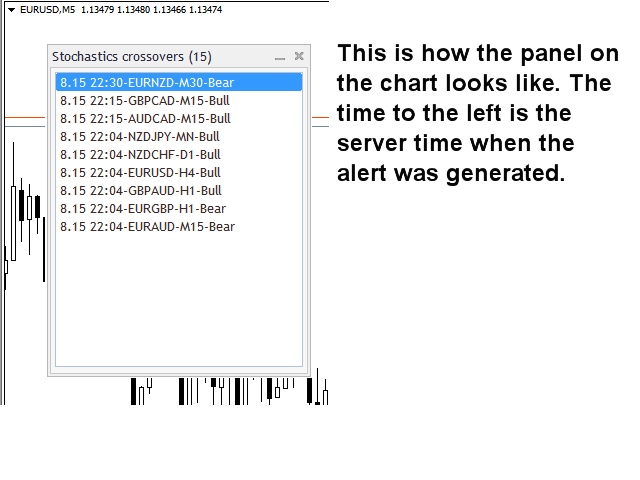
- L'indicatore include un pannello interattivo. Si prega di vedere lo screenshot separato per la spiegazione.
- L'indicatore può scrivere i segnali in un file di testo o alle variabili globali che può essere utilizzato da un Expert Advisor (EA) per il trading automatico . Ad esempio questo prodotto .
Parametri di input
La descrizione e la spiegazione dei parametri di ingresso sono disponibili qui .
Importante
Si noti che, a causa della multifunzionalità, sul grafico in cui è stato installato l'indicatore non verranno disegnati né consigli di acquisto e vendita né linee e frecce. Invece gli oggetti verranno disegnati sul grafico che si apre quando si fa clic su un segnale nel riquadro del grafico.
È altamente consigliabile posizionare l'indicatore su un grafico pulito (vuoto) senza altri indicatori o consulenti esperti su di esso che potrebbero interferire con lo scanner.