Multi oscillator divergence
- インディケータ
- バージョン: 3.3
- アップデート済み: 15 6月 2022
- アクティベーション: 10

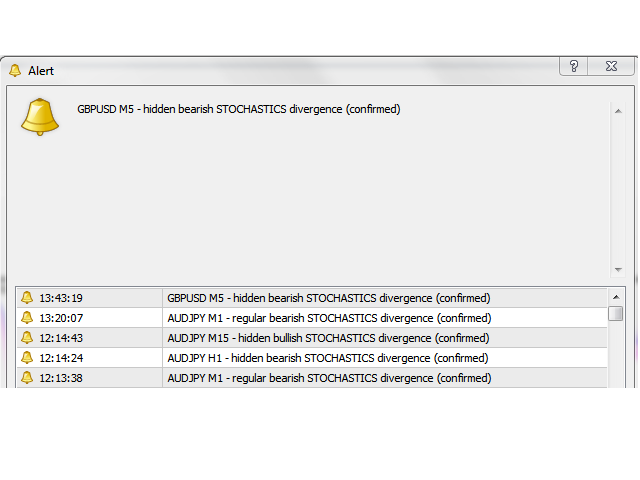
Great product, does exactly what’s required and provides timely alerts and a range of oscillator indicators to choose from. Jan provides excellent support and is very quick to reply. Thanks
i already buy this product today and still test, so far so good, im scalping trade, entry on m1 or m5 with sett indicator on m15 and m30. my result is good (for a while) now i want to test the Free EA related with this indi. i will back and give more star after test. Jan is good person, and fast response, i like it. Thanks Jan!! :)

ユーザーは評価に対して何もコメントを残しませんでした
ユーザーは評価に対して何もコメントを残しませんでした

Good signal when trader can combine with OB and OS in big TF.
Great product, does exactly what’s required and provides timely alerts and a range of oscillator indicators to choose from. Jan provides excellent support and is very quick to reply. Thanks
i already buy this product today and still test, so far so good, im scalping trade, entry on m1 or m5 with sett indicator on m15 and m30. my result is good (for a while) now i want to test the Free EA related with this indi. i will back and give more star after test. Jan is good person, and fast response, i like it. Thanks Jan!! :)

ユーザーは評価に対して何もコメントを残しませんでした
ユーザーは評価に対して何もコメントを残しませんでした
ユーザーは評価に対して何もコメントを残しませんでした

ユーザーは評価に対して何もコメントを残しませんでした

ユーザーは評価に対して何もコメントを残しませんでした

ユーザーは評価に対して何もコメントを残しませんでした

ユーザーは評価に対して何もコメントを残しませんでした

ユーザーは評価に対して何もコメントを残しませんでした
ユーザーは評価に対して何もコメントを残しませんでした

ユーザーは評価に対して何もコメントを残しませんでした

ユーザーは評価に対して何もコメントを残しませんでした
ユーザーは評価に対して何もコメントを残しませんでした

ユーザーは評価に対して何もコメントを残しませんでした
ユーザーは評価に対して何もコメントを残しませんでした
ユーザーは評価に対して何もコメントを残しませんでした
Good signal when trader can combine with OB and OS in big TF.