Opening Range Pro
- インディケータ
- バージョン: 2.1
- アクティベーション: 5
Opening Range Pro
WHAT DOES THIS INDICATOR DO?
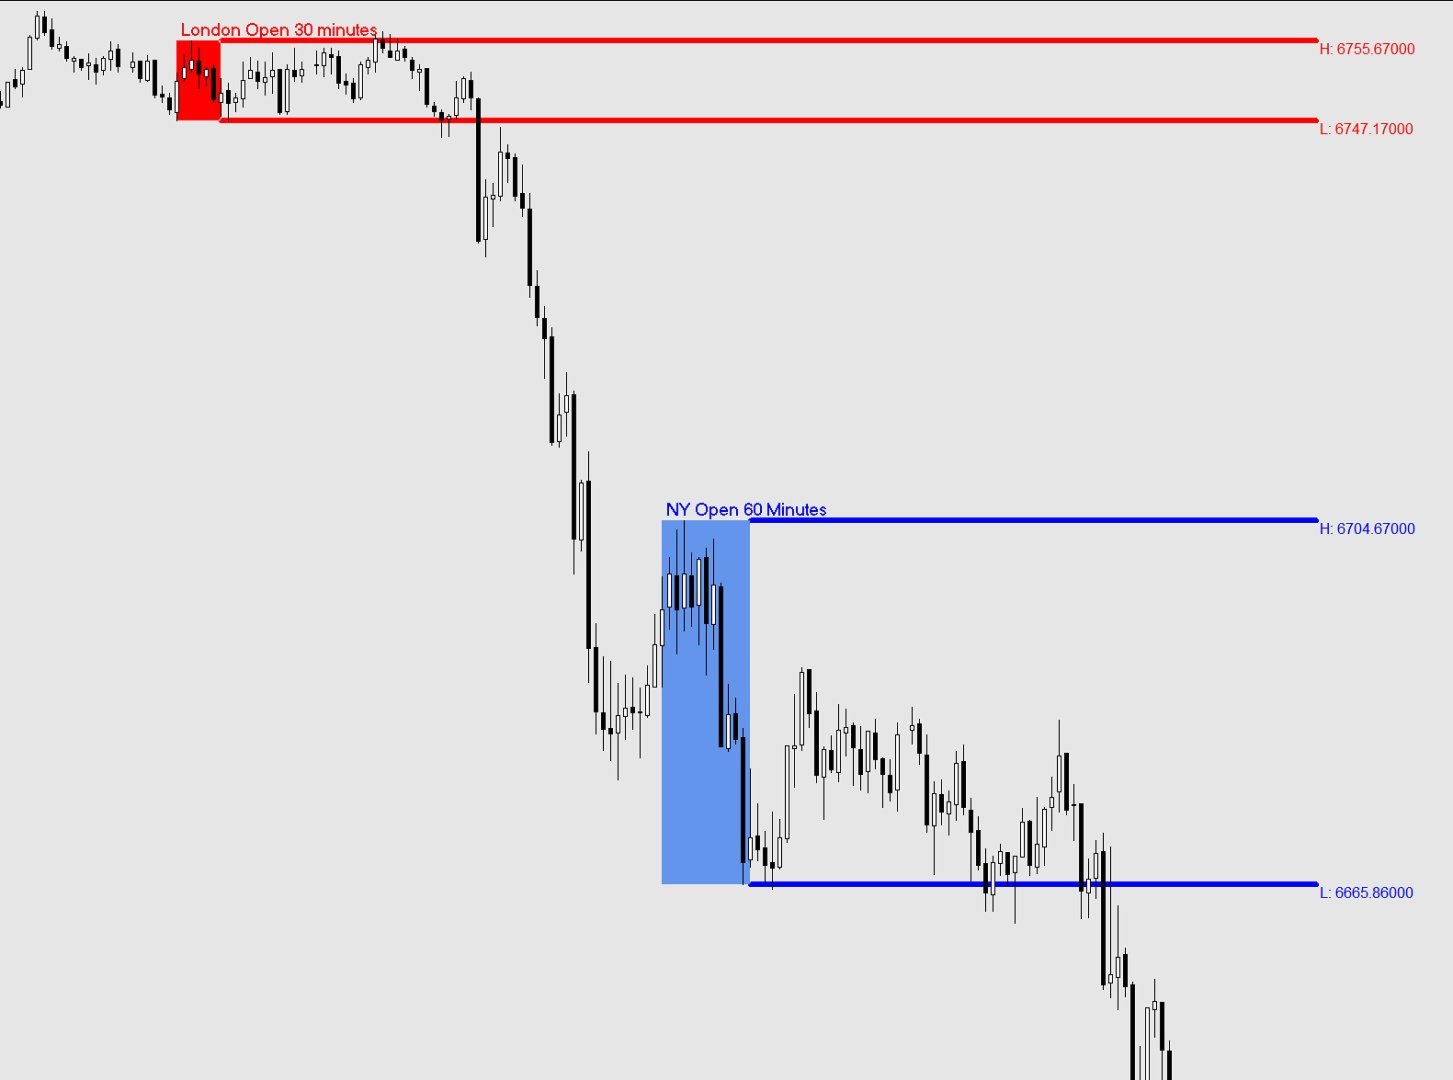
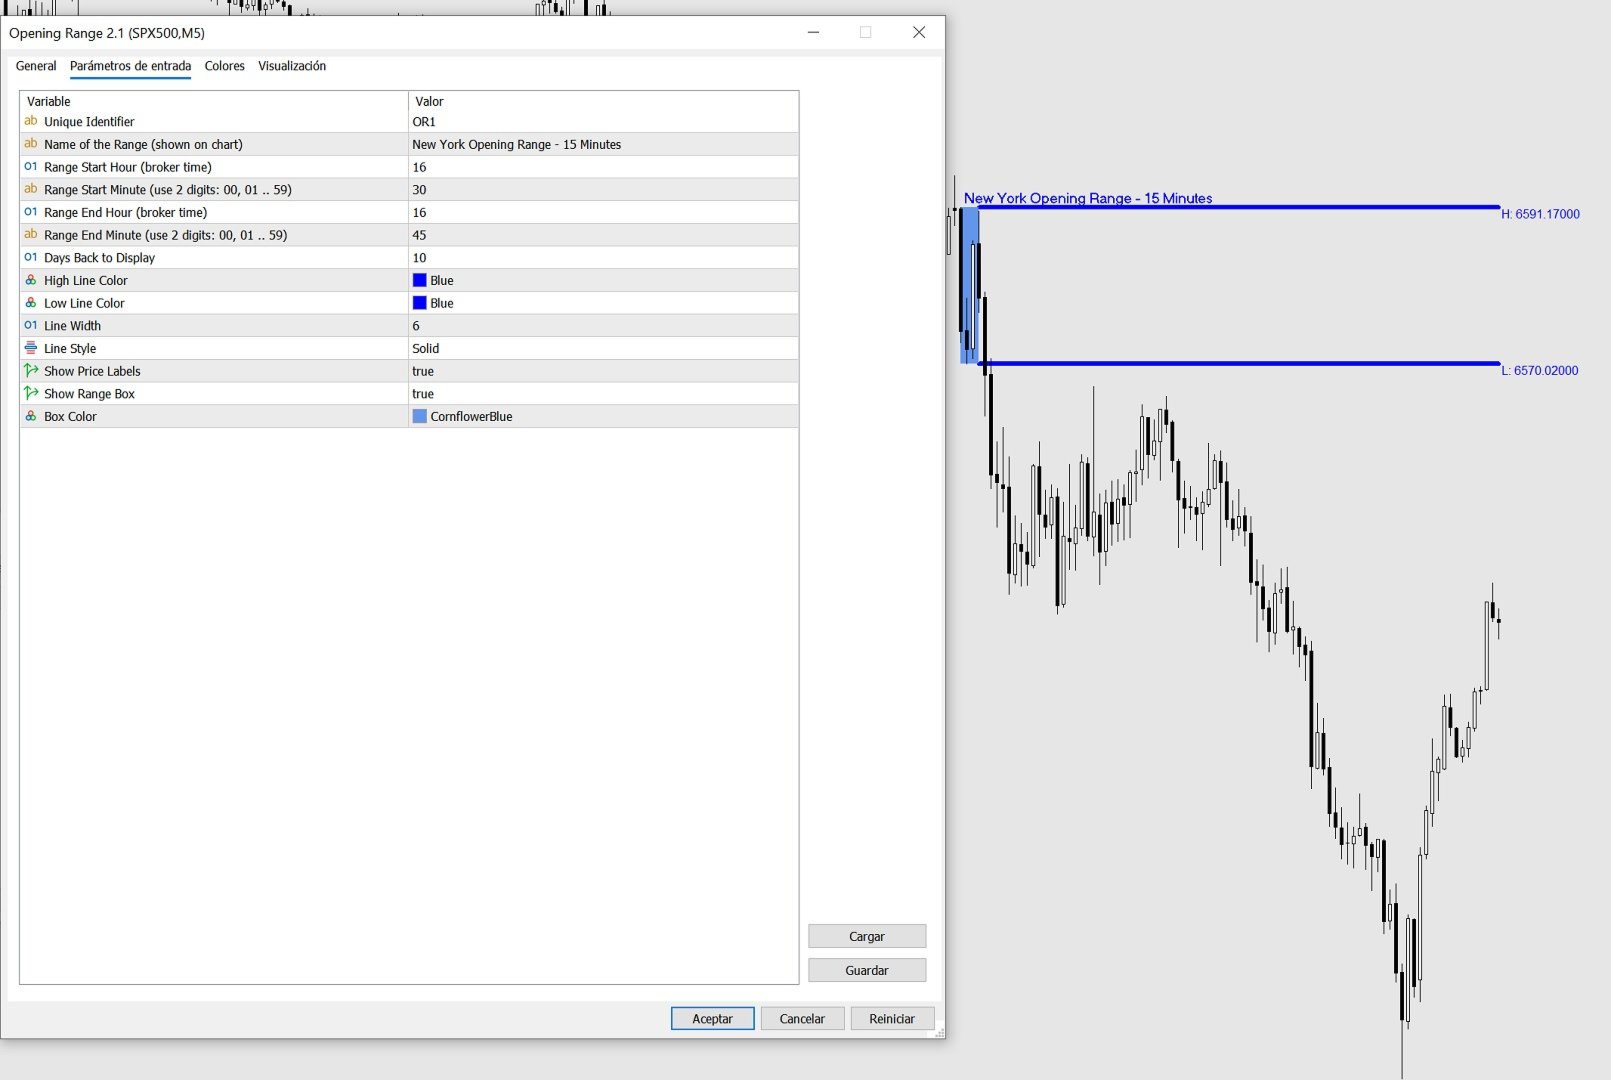
The Opening Range indicator marks the highest and lowest price reached during a
specific time window that you define (for example, the first 15 minutes of the
New York session). Once that window closes, it draws two horizontal lines — one
at the high and one at the low — extending across the rest of the trading day,
so you can see at a glance whether price is above or below the range, and use
those levels as reference for your trading decisions.
The indicator also draws a shaded box covering the formation period, and can
display the exact price of each level right on the chart.
All times used by the indicator are your broker's server time, which you can
see at the bottom of your MetaTrader platform.
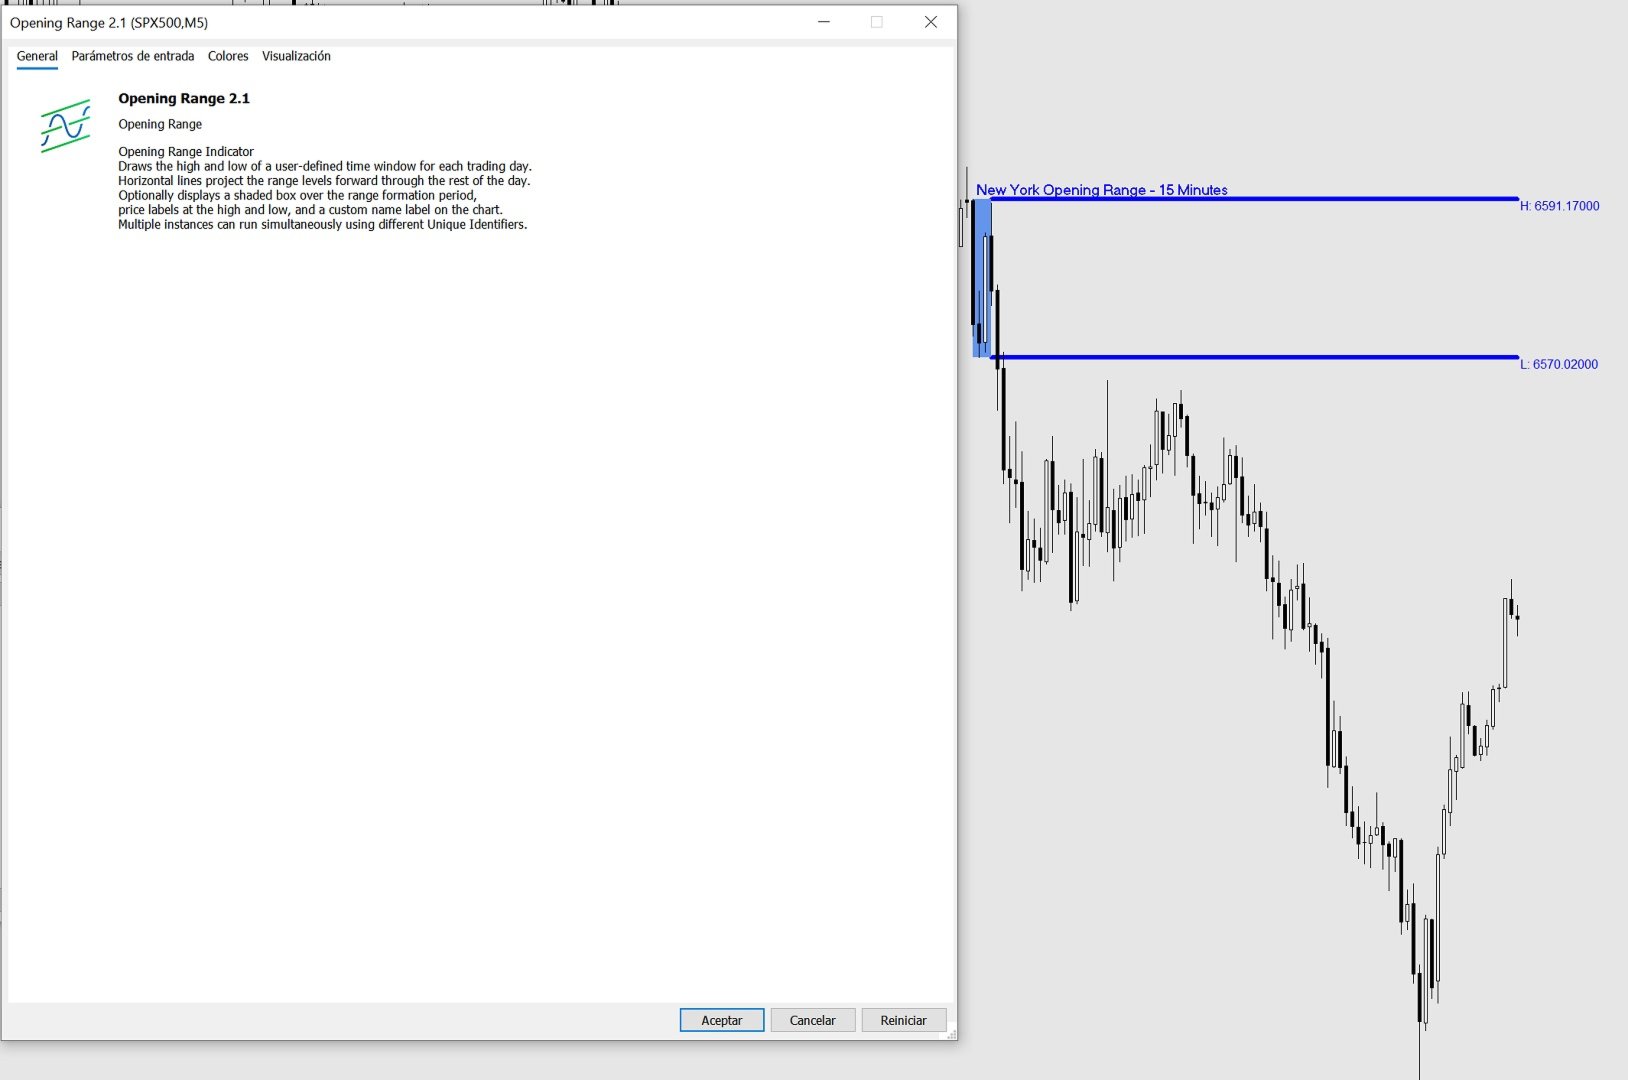
SETTINGS REFERENCE
When you attach the indicator to a chart, a settings window will appear with
two tabs: General (description) and Inputs (your settings). All settings are
found in the Inputs tab.
-- IDENTIFICATION --
Unique Identifier
A short label used internally to tell apart multiple instances of the
indicator running on the same chart. If you only use one instance, leave
this as the default (OR1). If you add a second instance for a different
session, change this to OR2 (or any unique text) to avoid conflicts.
Example: OR1, OR2, London, NY
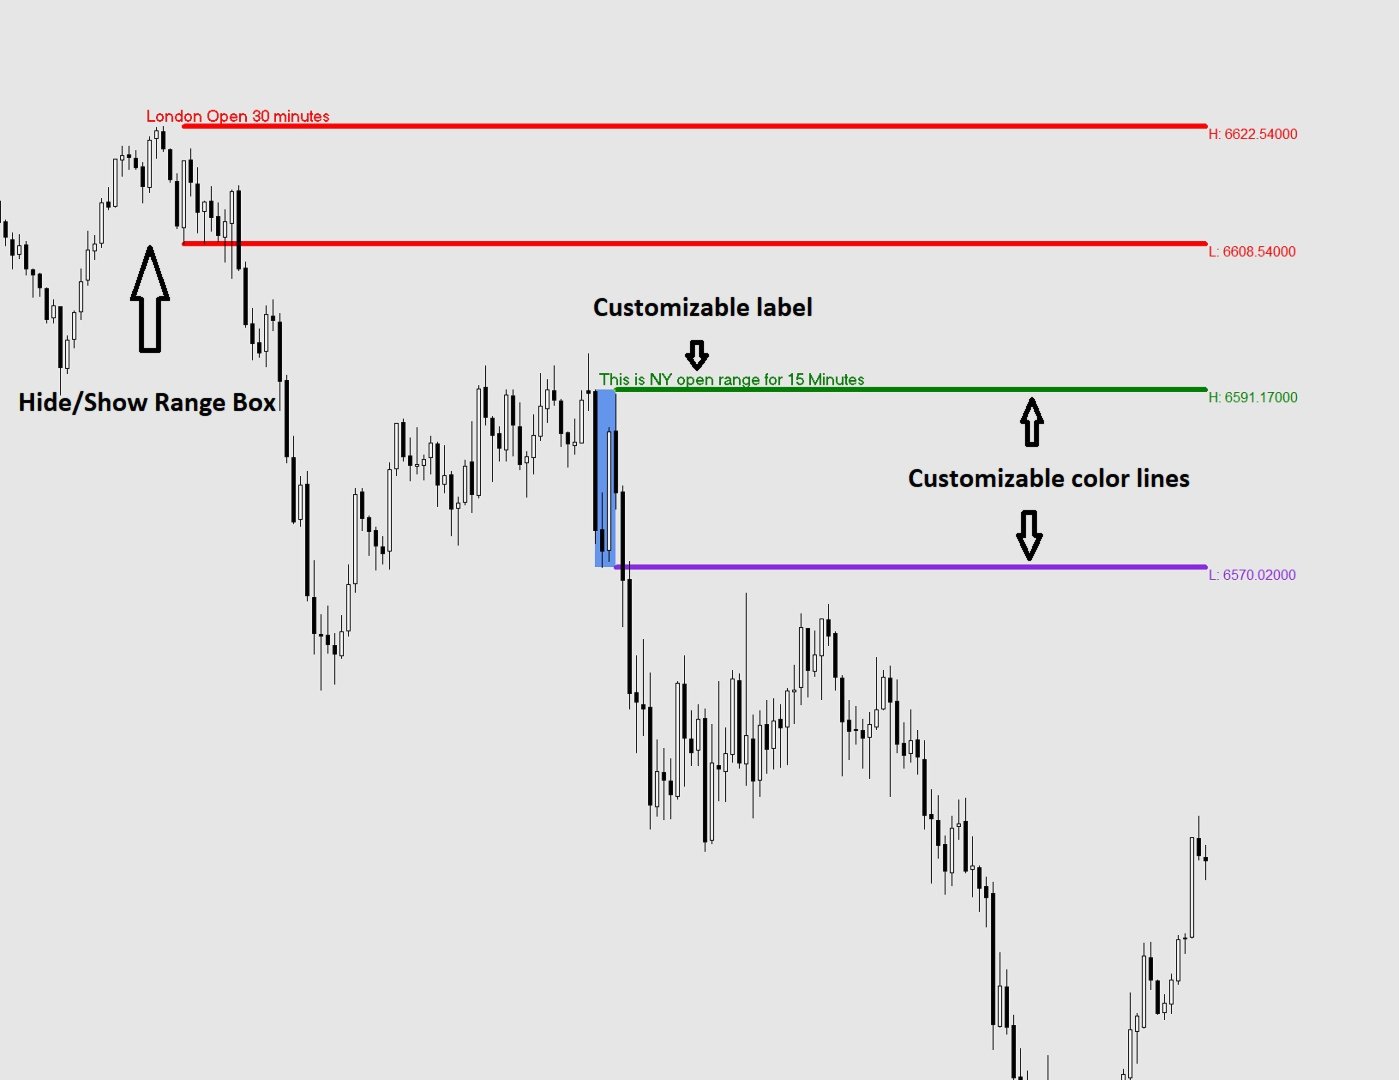
Name of the Range (shown on chart)
Optional. Whatever you type here will appear as a bold label directly on
the chart at the top-left corner of the range box and at the start of the
high line. Leave it blank if you do not want a label.
Example: "London Open", "NY Open", "Asia Range"
-- TIME SETTINGS --
All times refer to your broker's server time (shown at the bottom of MT4/MT5).
Range Start Hour
The hour at which the range formation period begins.
Enter a number from 0 to 23 using the 24-hour clock.
Example: 9 means 9:00 AM broker time.
Range Start Minute
The minute at which the range formation period begins.
Always enter 2 digits: 00, 01, 05, 15, 30, 45, etc.
Range End Hour
The hour at which the range formation period ends.
Enter a number from 0 to 23 using the 24-hour clock.
Range End Minute
The minute at which the range formation period ends.
Always enter 2 digits: 00, 01, 05, 15, 30, 45, etc.
Example — to capture the first 15 minutes of a session starting at 09:30:
Range Start Hour = 9
Range Start Minute = 30
Range End Hour = 9
Range End Minute = 45
-- DISPLAY --
Days Back to Display
How many past trading days to draw on the chart. Higher values give you
more history but may slow things down on low-powered computers.
Recommended: 5 to 20.
High Line Color
The color of the horizontal line drawn at the top of the range.
Low Line Color
The color of the horizontal line drawn at the bottom of the range.
Line Width
Thickness of the high and low lines. Enter a number from 1 (thinnest)
to 6 (thickest).
Line Style (MT5 only — dropdown)
Line Style (MT4 — enter a number: 0=Solid, 1=Dash, 2=Dot, 3=DashDot, 4=DashDotDot)
The style of the high and low lines.
Show Price Labels
True = display the exact price of the high and low at the right end of
each line, next to the last candle of the day.
False = hide the price labels.
Show Range Box
True = draw a shaded rectangle covering the range formation period
(between Range Start and Range End) showing you exactly where
the high and low were established.
False = hide the box. The high and low lines are still drawn.
Box Color
The fill color of the range box. Choose a color that is visible but
not distracting on your chart background.
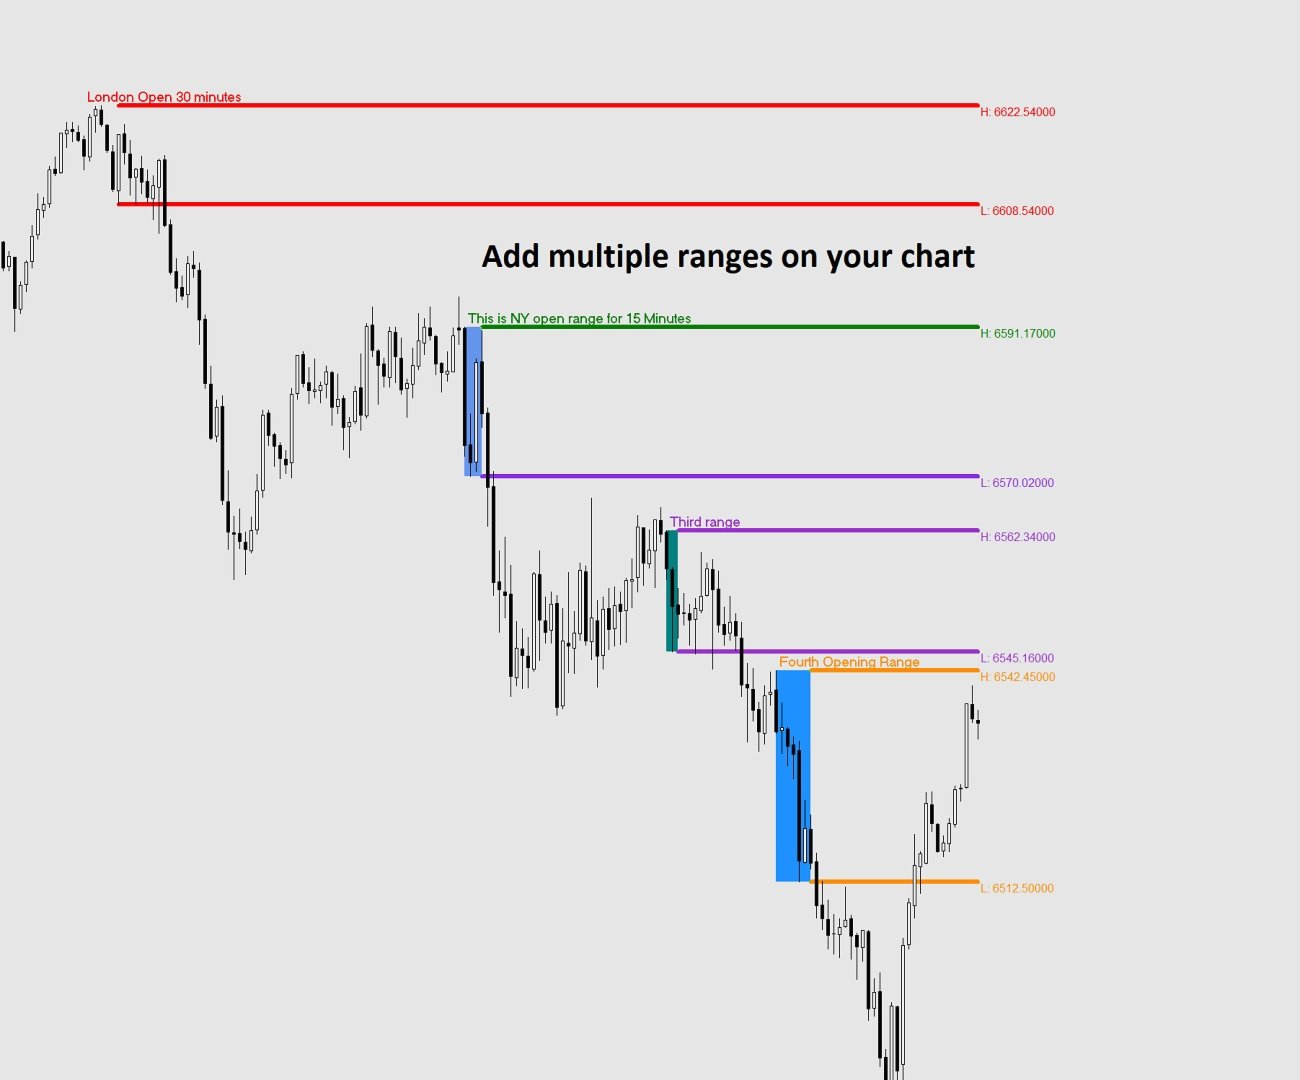
USING MULTIPLE RANGES ON THE SAME CHART
You can add the indicator more than once to study different session ranges
simultaneously (e.g. London open and New York open on the same chart).
To do this:
1. Attach the indicator a first time and configure it for the first session.
Set Unique Identifier to OR1.
2. Attach the indicator a second time and configure it for the second session.
Set Unique Identifier to OR2.
Each instance must have a different Unique Identifier. If two instances share
the same identifier, their objects will overlap and produce incorrect results.
TIPS
- The lines only appear AFTER the range formation period has closed. During the
formation period you will see the shaded box building in real time, but the
extending lines appear once the End Hour/Minute is reached.
- If no lines appear for today, it may be that the range end time has not yet
passed on the current day. Historical days will still show correctly.
- If lines appear at the wrong time, double-check your broker's server time
(visible at the bottom of your MetaTrader window) and adjust the start and
end hours accordingly.
- Weekend days (Saturday and Sunday) are automatically skipped.
- Removing the indicator from the chart will cleanly delete all lines, boxes
and labels it created.