Pinbar scanner with RSI filter
- インディケータ
- バージョン: 2.1
- アップデート済み: 28 1月 2025
- アクティベーション: 10

ぜひ読んでみてください 製品のブログ(マニュアル)を最初から最後まで読んで、インジケーターが提供するものが最初から明確になるようにします。
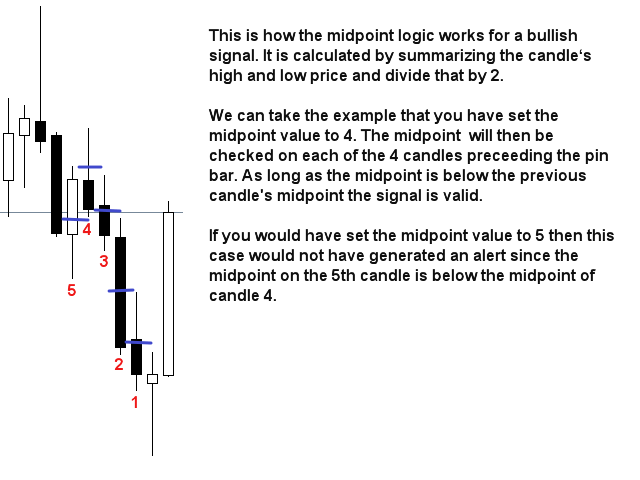
このマルチタイムフレームおよびマルチシンボルインジケーターは、ピンバーをスキャンします。独自のルールとテクニックと組み合わせることで、このインジケーターを使用して独自の強力なシステムを作成 (または強化) できます。
特徴
- マーケットウォッチウィンドウに表示されるすべてのシンボルを同時に監視できます。インジケーターを 1 つのチャートに適用するだけで、市場全体を即座に監視できます。
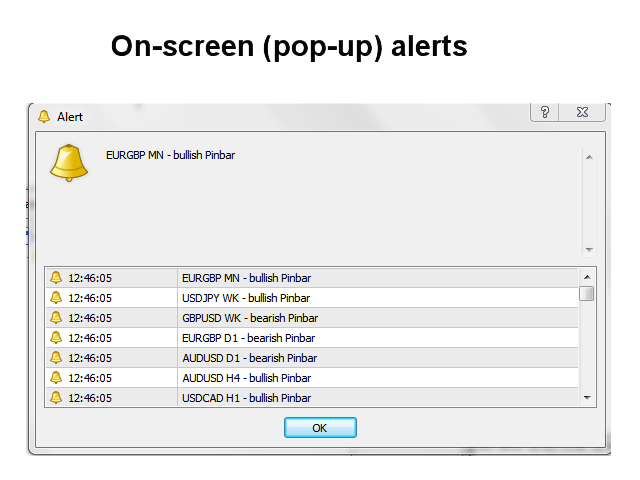
- M1 から MN までのすべての時間枠を監視し、ピンバーが識別されるとリアルタイムのアラートを送信します。すべての Metatrader ネイティブ アラート タイプがサポートされています。
- 潜在的な反転を適切に識別するために、RSI をトレンド フィルターとして使用できます。
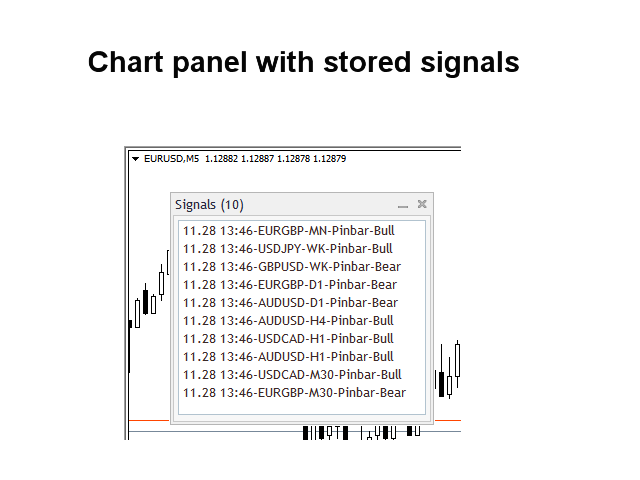
- インジケーターにはインタラクティブ パネルが含まれています。別のスクリーンショットを参照してください。
- 買い/売りラインと TP/SL ライン (ATR 乗数に基づく) を表示するように設定できます。パネル内のシグナルをクリックして開くチャートにラインが表示されます。下のスクリーンショットをご覧ください。
- インジケーターは、シグナル(取引アドバイス レベルなし)をファイルに書き込んだり、エキスパート アドバイザーが自動取引に使用できるグローバル変数として書き込んだりできます。
入力パラメータ
入力パラメータの説明と解説は、 ここを参照してください。
重要
多機能性のため、買い/売りアドバイスも線や矢印もインジケーターがインストールされているチャートに描画されないことに注意してください。これらはパネルのシグナルをクリックしたときに開かれるチャートに描画されます。スキャナーに干渉する可能性のある他のインジケーターやエキスパート アドバイザーのないクリーンな (空の) チャートにインジケーターを配置することを強くお勧めします。 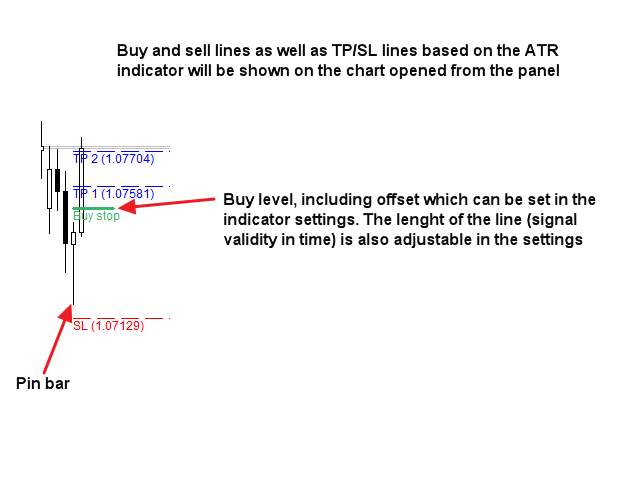


ユーザーは評価に対して何もコメントを残しませんでした