MTF Market Structure ZigZag
- インディケータ
- バージョン: 1.2
- アップデート済み: 11 4月 2026
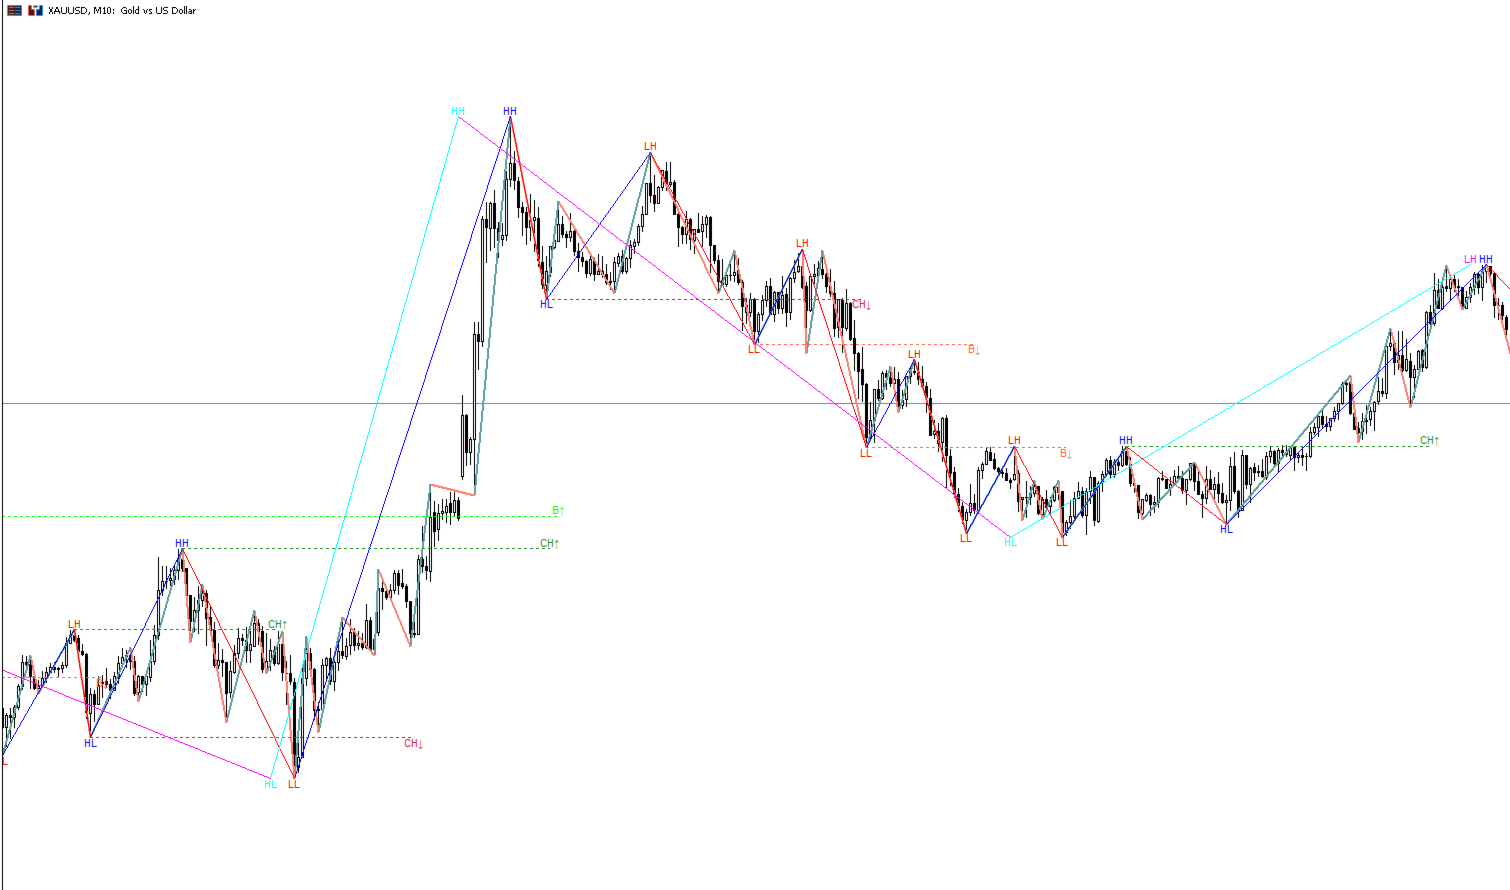
MTF Market Structure ZigZag is a multi-timeframe structure indicator for MetaTrader 5.
It maps ZigZag-based swing structure from up to four selected timeframes onto the active chart and helps traders read trend continuation and structural shifts more clearly.
The indicator can display:
- ZigZag swing lines
- market structure labels: HH, HL, LH, LL
- BOS (Break of Structure) events
- CHoCH (Change of Character) events
- optional horizontal break lines shifted to the right
BOS and CHoCH are confirmed by candle close beyond the previous structural high or low. This makes the displayed events more selective and easier to review visually.
Main features
- Up to 4 independent timeframes
- Separate show / hide control for each timeframe
- Separate show / hide control for labels, events and break lines
- Custom depth, deviation, line width and colors for each timeframe
- HH / HL / LH / LL structure labels
- BOS and CHoCH event labels
- Shifted break-line projection for cleaner chart reading
- Works on any symbol and any chart timeframe
- Designed for manual structure analysis and discretionary trading
How it works
- The indicator detects swing highs and swing lows on each selected timeframe.
- Those swings are mapped onto the current chart timeframe.
- Successive swings are connected into a ZigZag structure.
- Each new structural point is classified as HH, HL, LH or LL.
- BOS and CHoCH labels are plotted only after candle close confirms the break of the previous structural level.
Recommended use
- Use lower and medium timeframes for intraday structure alignment.
- Use H1, H4 and higher structure to add directional context on lower chart timeframes.
- Combine multiple timeframe layers to compare local structure against higher-timeframe bias.
Main inputs
- Timeframe selection for 4 layers
- Show / hide each timeframe
- Show / hide labels per timeframe
- Show / hide BOS / CHoCH events per timeframe
- Show / hide break lines per timeframe
- ZigZag depth and deviation
- Line width and colors
- Label font, size and offset
- Right shift for event labels and break lines
- BOS-only or CHoCH-only event filtering
Notes
- This indicator does not open trades.
- It is a chart analysis tool, not a profit-guarantee system.
- Lower depth values produce more swings.
- Higher depth values produce cleaner structure and fewer signals.
- Results depend on symbol volatility, chart timeframe and selected settings.
Version 1.00
- Initial Market release
- 4 timeframe structure mapping
- HH / HL / LH / LL labels
- BOS / CHoCH confirmation by candle close
- Per-timeframe display controls
- Optional break lines
- Configurable label font, size and offset
This wording is aligned with Market guidance to use clear, calm descriptions without promises of profit, flashy styling, or third-party links.