OneKey Violent Trading

What is this:

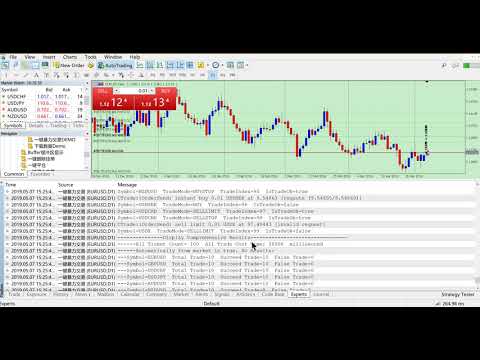
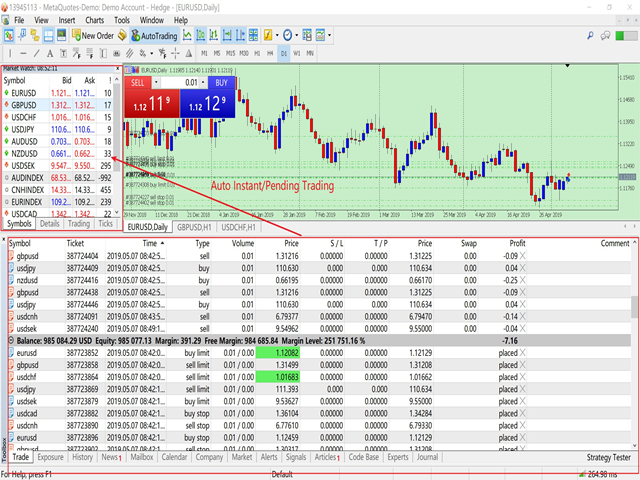
Violent trading: means sending a large number of orders to your brokerage server,  it can conduct a stress test of the trading.

In this program you can run a variety of trading tests. 

Now you can trade at high speed, For example 1000 orders in an instant.

Why to use:

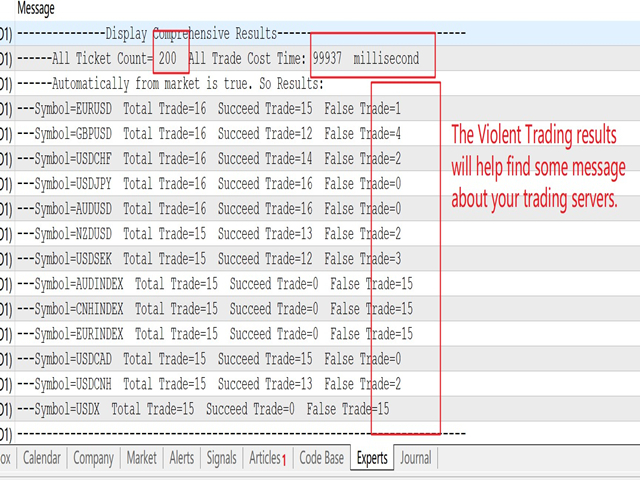
  • Whether manual trading or EA trading,  the status of the broker server is very important. So it is beneficial to conduct a trading stress test on the broker server.
  • To EA trading,  a lot of orders may be traded at the same time,  which requires testing the operation.
  • Especially in the Calender data period, it is necessary to conduct violent trading tests on the market.

How to use:

Usually you only need to adjust the Core Setting.  Other Setting are easy to understanding.
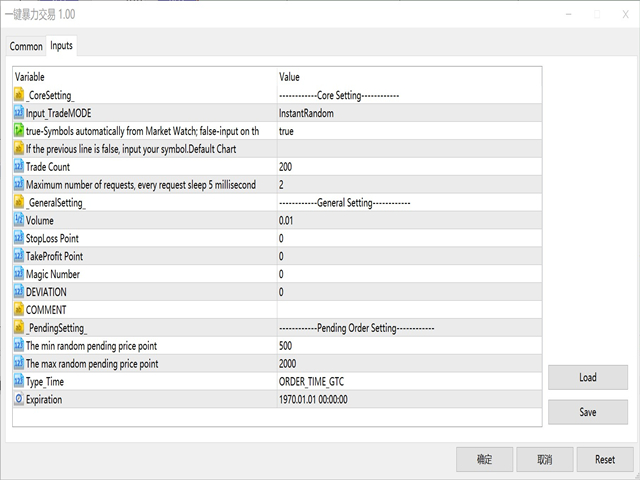
------------------------Core Setting------------------------

  • Input_TradeMODE = InstantRandom ; //Select trading mode, Random or specified
    • InstantRandom :  Random instant trading to buy or sell
    • PendingRandom : Random pending trading to buylimit, sellstop...
    • AllRandom :  InstantRandom and PendingRandom
    • Specified : BUY, SELL, BUYLIMIT, BUYSTOP, SELLLIMIT, SELLSTOP
  • bool_AutoFromMarket=true;      //true-Symbols automatically from Market Watch;  false-input on the next
  • string ForexName="";                 //If the previous line is false, input your symbol. Default Chart symbol.
  • int TicketCount=200;                 //Trade Count,For Hedge mode, different servers have different ticket upper limit.
  • int MaxRequestCount=2;            //Maximum number of requests, every request sleep 5 millisecond.
    • PS: Unstable server will cause the order to fail,  you can set the number of Request. MaxRequestCount=0 often trading failure with a bad network.

------------------------General Setting------------------------
  • Volume=0.01;
  • IsSetPoint=true;       //StopLoss or TakeProfit to Set Point:  true---point ; false---price.
  • StopLoss=0;             //StopLoss Point or Price
  • TakeProfit=0;          //TakeProfit Point or Price
  • MAGICNUM=0;          //Magic Number
  • DEVIATION=0;
  • COMMENT="";
------------------------Pending Order Setting------------------------
  • input double PendingPrice=0.0;        //PendingPrice: 0 means Random;  Others means Specified.
  • input int Pending_Point_Min=500;     //if PendingPrice=0.0:  The min random pending price point.
  • input int Pending_Point_Max=2000;   //if PendingPrice=0.0:  The max random pending price point.
  • input ENUM_ORDER_TYPE_TIME Type_Time=ORDER_TIME_GTC;
  • input datetime Expiration=0;

Final attention:

This program only used in Demo Account!

Before used, I suggest you have program to one key clean up your Trade Tickets.

You can clean up your Trade Tickets from my other one key products. 

Thanks for using my program.


おすすめのプロダクト
This script is an Intelligence Gathering Utility designed to give you full control over your data exports from MetaTrader 5. It allows you to synchronize up to three different symbols into a single file with precise timestamping. 1. Setting the Data Range (Range) You can define exactly which historical period you want to capture: Date Mode : If Last N bars (0 = use date range above) is set to 0 , the script will export all data between your chosen start and end dates. Bar Mode : By entering a nu
NORA NEWS SHIELD - Professional News Protection System Product Description Overview NORA NEWS SHIELD is a professional risk management tool that automatically protects your trading during high-impact economic news releases. It monitors major global currencies and temporarily suspends trading activity during critical market-moving events, helping you avoid sudden volatility spikes and potential losses. How It Works The system continuously scans the economic calendar for upcoming high-impact news
FREE
SolarTrade Suite 金融ロボット: LaunchPad Market Expert - 取引を開始するために設計されています! これは、革新的で高度なアルゴリズムを使用して値を計算する取引ロボットであり、金融​​市場の世界でのアシスタントです。 SolarTrade Suite シリーズのインジケーター セットを使用して、このロボットを起動するタイミングをより適切に選択してください。 説明の下部にある SolarTrade Suite シリーズの他の製品をご覧ください。 投資と金融市場の世界を自信を持ってナビゲートしたいですか? SolarTrade Suite 金融ロボット: LaunchPad Market Expert は、情報に基づいた投資決定を行い、利益を増やすのに役立つ革新的なソフトウェアです。 SolarTrade Suite 金融ロボット: LaunchPad Market Expert の利点: - 正確な計算: 当社のロボットは、高度なアルゴリズムと分析方法を使用して、市場の動きを正確に予測します。 資産を売買するのに最適なタイミングを
Instead of sticking to the Charts,let's use OneKey. Welcome to our new product - OneKey ! This is a great product written in MQL5, a streamlined version of the ALL IN ONE Keylevel product with the only feature removed being Algo trading. Other features of the product are kept intact and not affected. OneKey integrates many notable functions, including trend determination and Kelevel drawing, detecting Engulfing candle signals, Pinbar, Sideway breakout patterns, BOS, CHOCH, along with profession
Unlock the Full Potential of Your Trading with ChartFix Rectangles Are you tired of manually adjusting rectangles on your MT5 charts every time the market shifts? Wish there was a faster, smarter way to manage your chart objects? ChartFix Rectangles  is here to transform your trading experience, giving you unparalleled control over rectangles with just a few clicks. Why ChartFix Rectangles is a Game-Changer One-Click Extension : Instantly extend your rectangle’s right edge to the last bar —p
Magic News Trade Assistant は、ニュースが起こったときに取引するためのツールです。このツールは、独自のストップロスとテイクプロフィットを明確に設定できるため、利益を生み出すのに非常に役立ちます。 このツールは XAUUSD での取引に最適です。 JOLTSやNFPなどトレードに使えるニュースはとてもお得です。あなたは落ち着いて注文が利益を生むのを待ちます、それはすべて生成されるニュース次第です。 おすすめ : • 通貨ペア: XAUUSD • ロットと株式比率: 1:1000 ($1000 あれば 1 ロットを使用できます) • 最優秀ブローカー: Orbitrade (スリッページが非常に低いため、Orbitrade アカウントを作成したい場合は管理者に連絡してください) 仕様: • ロットサイズ: ロット数を決定します。 • 範囲サイズ: 計算距離範囲の価格は 2 ~ 3 スプレッドで、希望に応じて設定でき、自動的に入力されます。 • ストップロス: ストップロスの通常の距離はスプレッドの 5 倍で、希望に応じて設定でき、自動的に埋められます。 • テイ
TradersToolboxOverwatch-すべてのTradersToolbox実行中のインスタンスの監視ユーティリティです。 これは、シンプルなチャート切り替えユーティリティであり、すべての Traders Toolbox ランニングチャートのマーケットウォッチです。 特徴: 1.カスタマイズ可能なボタンの色、行、列。 2. 3つのシグナルタイプ(ホールド-イエロー/セル-レッド/バイ-グリーン) 3. Traders Toolbox の新規またはクローズされたインスタンスに応じてボタンリストを動的に更新します 4.シングルクリックボタンは、関連するチャートを前面に表示します。 5.売買シグナルは、 Traders Toolbox チャートシグナルと一致するパーセンテージでシグナル強度を示します。 注意:ユーティリティは、 Traders Toolbox / Traders Toolbox Lite  と組み合わせてのみ使用でき、独立して機能することはできません。 Traders Toolbox との取引に関するアイデアを交換するた
eng description ฺBelow คุณสมบัติ EA OneClickTradingPro v5.46 (ไทย / ENG) ภาษาไทย EA OneClickTradingPro v5.46 เป็น Expert Advisor สำหรับ MetaTrader 5 ที่ออกแบบมาเพื่อการเทรดแบบคลิกเดียว รองรับการทำงานบนหลาย Timeframe พร้อมกัน และมีฟีเจอร์ครบครันดังนี้: 1. การเปิดออร์เดอร์ด้วยปุ่มลัด (Hotkeys) B – เปิดออร์เดอร์ Buy (Market Order) S – เปิดออร์เดอร์ Sell (Market Order) P – เปิด Pending Buy Limit (ต่ำกว่าราคาปัจจุบัน) L – เปิด Pending Sell Limit (สูงกว่าราคาปัจจุบัน) I – เพิ่ม Lot Size เป็น
VR Assistant Charts — これは、MetaTrader 取引ターミナル ウィンドウでグラフィカル オブジェクトを操作するトレーダーにとって便利なツールです。このプログラムを使用すると、マウスをワンクリックするだけで、MetaTrader ターミナル内のトレンド ライン、フィボナッチ レベル、ギャン ファン、その他のグラフィック要素の色、スタイル、太さ、その他の特性を変更できます。 設定、設定ファイル、デモ版、説明書、問題解決方法は、以下から入手できます。 [ブログ] レビューを読んだり書いたりすることができます。 [リンク] のバージョン [MetaTrader 4] このユーティリティは、グラフィカル オブジェクトを使用して金融商品を分析するトレーダーの単調な作業を大幅に容易にします。すべての操作は、コンピューターのマウスを使用してチャート上で直接実行されます。このプログラムは、MetaTrader 4 および MetaTrader 5 取引プラットフォーム用のテクニカル指標の形式で実装されており、他の指標、アドバイザー、スクリプトと同時に使用することが可能です
Local Copy Trader Utility - Professional Copy Trading System Overview Local Copy Trader Utility is the complete solution for mirroring trades between MetaTrader 5 accounts. With both Master and Slave functionality in one powerful Expert Advisor, it delivers reliable, lightning-fast trade copying with zero external dependencies. Perfect for managing multiple accounts, following trading signals, or transferring trades between brokers, this system ensures your positions stay perfectly synchronized
SmartLines allows you to open orders using trend lines. SmartLines for MT4 https://www.mql5.com/ru/market/product/25875 Now you have the opportunity to control breakthroughs of the trend corridor automatically and without delay. As soon as the price crosses your trend line with your settings, the order is automatically opened. You will not miss the moment of the trend change. The principle of working with SmartLines is similar to placement of pending orders. However, pending orders only have th
PriceZoneAlerte
Kocou Faustin Agohoundje
PriceZoneAlert v2.0   is the essential tool for traders who want to monitor their price zones with customized alerts, directly on their phone or tablet. This innovative indicator for MetaTrader 5 allows you to add alerts on predefined price zones, with instant push notifications to stay informed in real time, wherever you are. Whether you're trading according to SMC concepts, support/resistance, or a custom strategy,   PriceZoneAlert v2.0   helps you   stay focused, responsive, and discipli
Classic SNR MetaTrader 5 Expert Advisor | Multi-Symbol Support & Resistance Trading with Trend-Based Logic Overview Classic SNR Breakout EA is a professional trading robot that identifies structural Support & Resistance levels using daily swing points and executes trades based on H1 price action relative to these levels. The EA applies   dual logic : in an uptrend, it sells on H1 rejection below an SNR level; in a downtrend, it buys on H1 rejection above an SNR level. Breakout confirmations are
Exp THE X FULL
Vladislav Andruschenko
4.79 (28)
これは標準的な指標に取り組んでいるMetaTrader 5のための万能自動エキスパートアドバイザーです。 UniversalEA コンストラクタEAには多数の関数が用意されています。 ポジションを開くために20のシグナルのうちの1つを選択し、MetaTraderパッケージに含まれる標準インディケータのシグナルを選別するために20のうち5つのフィルターを選択することができます。 さらに、指標のパラメータを調整したり、時間枠を選択したり、各信号の信号バーを指定したりできます。 注意!新しいユニバーサルトレーディングアドバイザーの Exp - カスタム指標に取り組んでいる xCustomEA  : MetaTrader 5の ための Exp The xCustomEA MetaTrader 4の ための Exp The xCustomEA Description on English 自動取引アドバイザーを購入したい場合は、  TickSniperを チェックして ください  。 EAには以下の機能があります。  カウンタートレンド平均 トレンドの方向への追加の開口部 トレーリングストッ
CosmiCLab SMC FIBO CosmiCLab SMC FIBO is a professional trading indicator designed for traders who use Smart Money Concepts (SMC), market structure analysis and Fibonacci retracement levels. The indicator automatically detects market swings and builds Fibonacci levels based on the latest impulse movement. It also identifies market structure changes such as BOS (Break of Structure) and CHOCH (Change of Character), helping traders understand the current market direction. CosmiCLab SMC FIBO also pr
Object Synchronizer MT5 : Better focus/analysis of the price chart in many timeframes. Are you bored to save and load template many times for the same symbol for many chart timeframes? Here is the alternative. With this indicator, you enjoy creating objects across many charts, you can modify the same object in any chart, you can delete the same object in any chart. All objects you created/modified are always synchronized across all chart windows (with the same symbol). Save your time, you can fo
皆さん、こんにちは 人々の目から見ると、投資は難しくてリスクの高いビジネスであると考えられています。 しかし、知識とスキルを身につけて投資を行えば、市場があなたに害を及ぼすことはありません。 資本市場でのフィルター書き込みは、この分野の専門家が生産性を向上させ、時間を節約するために行うアクションの 1 つです。 多数のシンボルが活動するため、保存される情報とデータの量は非常に多くなります。 この市場で活動する人々は、一連の情報を必要とする場合があり、問題の機密性を考慮して、できるだけ早く情報を入手する必要があります。 この情報は通常、市場の将来を予測するのに役立ち、非常に重要です。 コマンドによる Fitler の書き込みにより、要求された条件に一致するシェアが検索されます。 選択した機能をフィルタリングすると、すべての取引可能な株式が検索され、適切な株式が表示されます。 資本市場では各人が取引の戦略を持っており、フィルタリングすることで戦略に沿って取引を進めることが容易であり、 その後、さまざまな時間枠で戦略の結果を確認できます。 フィルタリングの利点 1- 高速: 各株式の
Risk Manager – Account Protection Tool Risk Manager is an Expert Advisor for MetaTrader 5 designed to protect your trading account by applying automatic risk management rules. This tool does not open trades . It continuously monitors your account and enforces predefined limits to help prevent excessive losses and maintain disciplined trading. Risk Manager works in the background and can manage positions opened by manual trading or other Expert Advisors. It is particularly useful for: • Manual tr
FREE
- وصف المنتج - مؤشر احترافي متكامل لا يعد KING Fusion MACD-Vol من KING TRADING EA مجرد MACD آخر — فهو عبارة عن مجموعة أدوات تداول كاملة تجمع بين مؤشرات احترافية متعددة في نافذة فرعية واحدة أنيقة. لم تعد بحاجة إلى تحميل مخططك بأدوات منفصلة. يجمع هذا المؤشر بين: MACD مع خطوط مزدوجة ورسم بياني مكبر رسم بياني ملون ومثبت بالحجم ملصقات ديناميكية مع قيم المؤشرات في الوقت الفعلي (ATR، ADX، RSI، Volume) عداد تنازلي للبار التنبيهات المتقاطعة (مرئية + صوتية) كل ما تحتاجه من الوضوح والسرعة والدقة -
FREE
Script that generates a report of possible ATM Straddle operations. It works for any asset on the spot market that has authorized stock options series on the B3 (Brazilian stock exchange). Straddle operations presented in the report: Short Straddle operations Uncovered Short Straddle Covered Call Short Straddle Diagonal Covered Call Short Straddle (expiration of the covered call after the expiration of the short options) Iron Butterfly Iron Butterfly "Pozinho" Diagonal Iron Butterfly (diagonal
Automated Report Generator for the Spanish Treasury This utility allows you to generate automated reports for the Spanish treasury with several advantages: A detailed report is generated in an HTML file in the MetaTrader 5 base directory. This report includes all operations individually. For accounts nominated in another currency, the report will automatically generate a profit column in euros using the same broker data. Profits in other currencies will be accounted for as indicated by the Spa
Spread Spike and Alert MT5
AL MOOSAWI ABDULLAH JAFFER BAQER
• Please test the product in the Strategy Tester before purchasing to understand how it works. • If you face any issues, contact me via private message—I’m always available to help. • After purchase, send me a screenshot of your order to receive a   FREE EA   as a gift. Spread Spike & Alert – The Ultimate Spread Monitoring Tool In the world of trading, spread spikes can be the difference between profit and loss. Unexpectedly high spreads can eat into your gains and make trading conditions unfav
Quantum Simulator – Discover the Power of Quantum Dynamic Risk Quantum Simulator is an Expert Advisor designed to demonstrate the effectiveness of the Quantum function, fully integrated into the RiskGuard Management system. Through a simple interface, you can simulate an equity curve starting from a fixed balance of €100,000 , using your own custom statistics: Win Rate (%) Average Risk/Reward Ratio Number of Trades Maximum Allowed Drawdown (Optional) Minimum Accepted Drawdown The EA performs a
FREE
Ping-Monitor — Never Miss a Tick Again! Do you run EAs and worry about silent chart freezes or data feed stalls ?  This utility is your ultimate watchdog, alerting you the moment your charts stop receiving updates. Ping-Monitor is designed to detect when a chart freezes or the data feed stalls, even if MT5 still shows that the connection is active. It works by tracking the time of the last incoming tick. Every time the chart receives a new price update, the EA records the timestamp. Then, on a
AW Workpad MT5
AW Trading Software Limited
AW Workpad は、手動および半自動取引用に設計された多機能取引コントロール パネルです。保留中の注文、市場ポジションを管理し、幅広い統計データを提供するだけでなく、古典的な指標のグループの複数期間の分析を行うことができます。 このユーティリティは、次の 5 つのタブで表されます。 Positions, Pending, Close, Indicators, Info . 各タブには、注文や現在の市場状況に関する情報を処理するための独自の機能グループがあります。 MT4版→       ここ / 問題解決 ->   ここ   機能または利点: このユーティリティは、すべての時間枠と任意のシンボル (通貨、指数、石油、金属、株式) で機能します。 各パネルのすべての要素には追加のラベルが付けられており、任意の要素にカーソルを合わせるだけで表示されます。 AW Workpad 取引パネルには、柔軟な設定と直感的なパネル インターフェイスがあります。 最も必要なすべての機能を 1 つの製品に。 取引パネルのタブ: Positions - このタブでは、成行注文を操作および維持できます
AutoCloseTimer allows you to close positions and delete pending orders at a specified time. Usage Download and drag and drop AutoCloseTimer onto the chart. Check Allow AutoTrading in Common tab. Set parameters in Inputs tab. Notice: The close time must be later than the current market time. Input Parameters CloseSymbol - there are 2 options SymBol Of Chart - just close the symbol of the current chart All Symbols - close all symbols CloseTimerDay - specify a day for AutoCloseTimer. The default
This tool is used to generate a K - line reflection chart of a currency pair for foreign exchange transactions. For example, if the currency pair is EURUSD, a custom currency pair named EURUSD_ref is generated and a chart for that currency pair is opened. The price of a custom pair of currency is the inverse of the price of the original pair, which is the equivalent of a new pair of currency, the USDEUR. The usage is simple, put it on any chart, the new chart will open, and then draw the corr
GoldTrendPro v5.0 – Smart Confluence EA for XAUUSD H1 GoldTrendPro v5.0 is a fully automated Expert Advisor built exclusively for XAUUSD (Gold) on the H1 timeframe. Unlike simple grid or martingale systems, GoldTrendPro uses a multi-confluence scoring engine that only enters a trade when multiple independent signals align. No license binding, no expiry. Activation is handled directly by MQL5 Market. Why GoldTrendPro? Most Gold EAs rely on a single indicator. GoldTrendPro aggregates six signal s
This utility changes the behavior of auto-scroll. It removes the need to manually disable and re-enable the auto-scroll function. Main features Disables auto-scroll - when the screen is scrolled backwards to look at the price history. Enables auto-scroll - when moved back to current history. Inputs None. Note I recommend testing when markets are open, since auto-scroll works when there are incoming ticks.
Telegram Notification Worker (v5.31) Telegram Notification Worker is a high-performance, professional utility designed to bridge the gap between your MetaTrader 5 terminal and Telegram. It acts as a dedicated background worker that forwards custom alerts, trade events, and system status messages from any of your Expert Advisors (EAs) directly to your Telegram chat or channel. Key Technical Features: Asynchronous Messaging Engine: Unlike standard notification scripts, this worker uses an asynchr
FREE
このプロダクトを購入した人は以下も購入しています
Trade Assistant MT5
Evgeniy Kravchenko
4.42 (212)
取引 ごとのリスクの 計算、新規注文 の 簡単 な 設置、部分的 な 決済機能 を 持 つ 注文管理、 7 種類 のトレーリングストップなど 、便利 な 機能 を 備 えています 。 追加の資料と説明書 インストール手順   -   アプリケーションの手順   -   デモアカウント用アプリケーションの試用版 ライン機能 チャート上にオープニングライン、ストップロス、テイクプロフィットを表示します。この機能により、新規注文を簡単に設定することができ、注文を出す前にその特徴を確認することができます。   リスク計算 リスク計算機能は、設定されたリスクとストップロス注文のサイズを考慮して、新規注文のボリュームを計算します。ストップロスの大きさを自由に設定できると同時に、設定したリスクを守ることができます。 Lot calc ボタン - リスク 計算 を 有効 / 無効 にします 。 Risk フィールドでは 、必要 なリスクの 値 を 0 から 100 までのパーセンテージまたは 預金通貨 で 設定 します 。 設定」 タブで 、 リスク 計算 の 種類 を 選択 します :「 $ 通
Trade Manager EAへようこそ。これは、取引をより直感的、正確、そして効率的にするために設計された究極の リスク管理ツール です。これは単なるオーダー実行ツールではなく、包括的な取引計画、ポジション管理、リスク管理のためのソリューションです。初心者から上級者、迅速な実行を必要とするスキャルパーまで、Trade Manager EAはあらゆるニーズに対応し、為替、指数、商品、暗号通貨などさまざまな市場で柔軟に対応します。 Trade Manager EAを使用すると、複雑な計算が過去のものになります。市場を分析し、エントリーポイント、ストップロス、テイクプロフィットのレベルをチャート上のラインでマークし、リスクを設定するだけで、Trade Managerが最適なポジションサイズを即座に計算し、SLとTPをピップ、ポイント、口座通貨でリアルタイムに表示します。すべての取引が簡単かつ効果的に管理されます。 主な機能: ポジションサイズ計算機 :定義されたリスクに基づいて取引サイズを瞬時に決定します。 簡単な取引計画 :エントリー、ストップロス、テイクプロフィットを設定するためのド
Local Trade Copier EA MT5
Juvenille Emperor Limited
4.96 (139)
Local Trade Copier EA MT5 による、驚くほど高速な取引コピーを体験してください。1分で簡単にセットアップできるこの取引コピー機は、同じWindowsコンピュータまたはWindows VPS上の複数のMetaTrader端末間で取引をコピーすることができ、0.5秒未満の高速コピースピードを実現します。 初心者であろうとプロのトレーダーであろうと、 Local Trade Copier EA MT5 には、あなたの特定のニーズに合わせてカスタマイズするための幅広いオプションが用意されています。これは、利益の可能性を高めたい人にとって究極のソリューションです。 今すぐ試してみて、これが市場で最も速くて簡単なトレードコピー機である理由を理解してください。 ヒント: デモアカウントで Local Trade Copier EA MT5 デモバージョンをダウンロードして試すことができます: ここ ダウンロードした無料のデモ ファイルを MT5 >> ファイル >> データ フォルダを開く >> MQL5 >> Experts フォルダに貼り付けて、ターミナルを再起動しま
ベータリリース Telegram to MT5 Signal Trader はまもなく正式なアルファ版をリリースします。いくつかの機能はまだ開発中で、小さな不具合に遭遇する可能性があります。問題が発生した場合はぜひご報告ください。皆さまのフィードバックがソフトウェア改善に役立ちます。 Telegram to MT5 Signal Trader は、 Telegram のチャンネルやグループからの取引シグナルを自動的に MetaTrader 5 にコピーする強力なツールです。 パブリックおよびプライベートの両方のチャネルに対応し、複数のシグナル提供元を複数のMT5口座に接続可能です。ソフトウェアは高速で安定し、すべての取引を細かく制御できます。 インターフェースは直感的で、ダッシュボードとチャートは見やすく設計されており、リアルタイムで動作状況をモニターできます。 必要環境 MQL の制限により、EA は Telegram と通信するためのデスクトップアプリが必要です。 インストーラーは公式の インストールガイド にあります。 主な機能 マルチプロバイダー: 複数の Telegram
AI Agent Supervisor is NOT an Expert Advisor. AI Agent Supervisor   is a   multi-agent AI risk & portfolio supervisor   that watches every EA on your account and intervenes in real time.  WANT AN AI PORTFOLIO MANAGER WATCHING YOUR FLEET 24/7?   Run your fleet on the same brokers I do:   IC MARKETS , IC TRADING   .  Unlike the centralized stock market, Forex has no single, unified price feed.  Every broker sources liquidity from different providers, creating unique data streams. The Supervisor r
TradePanel MT5
Alfiya Fazylova
4.87 (156)
Trade Panelは多機能なトレーディングアシスタントです。アプリには手動取引用の50以上のトレーディング機能が搭載されており、ほとんどの取引作業を自動化することができます。 購入前に、デモアカウントでアプリのデモ版をテストすることができます。デモアカウント用のアプリの試用版をダウンロードするには、次のリンクをご利用ください: https://www.mql5.com/en/blogs/post/750865 。 完全な手順 こちら 。 取引。 ワンクリックで取引操作を行うことができます: リスクを自動計算して指値注文やポジションを開く。 複数の注文やポジションをワンクリックで開く。 注文のグリッドを開く。 保留中の注文やポジションをグループごとに閉じる。 ポジションの方向を反転(Buyを閉じてSellを開く、またはSellを閉じてBuyを開く)。 ポジションをブロックする(不足している量のポジションを開くことでBuyとSellのポジション量を等しくする)。 すべてのポジションを部分的にワンクリックで閉じる。 すべてのポジションの利食い(Take Profit)および損切り(Sto
Trade Dashboard simplifies how you open, manage, and control your trades, with built-in lot size calculation. It allows you to execute trades, manage risk, and control positions directly on the chart, with tools such as partial close, breakeven, and trailing stop. Designed to reduce manual work and help you stay focused on your trading decisions. A demo version is available for testing. Detailed explanations of features are provided within the MQL5 platform. Installation instructions are include
Power Candles Strategy Scanner - 自動最適化型マルチシンボル設定ファインダー パワーキャンドル・ストラテジー・スキャナーは 、パワーキャンドル・インジケーターを駆動するのと全く同じ自己最適化エンジンを、マーケットウォッチに登録されているすべての銘柄に対して並行して実行します。1つのパネルで、現在統計的に取引可能な銘柄、各銘柄で勝率の高い戦略、最適なストップロス/テイクプロフィットの組み合わせが表示され、新たなシグナルが発生した瞬間に通知が届きます。 このツールは、Stein Investmentsのエコシステムの一部です。  18種類以上のツールをすべて閲覧し、AIを活用したセットアップの推奨を受け取り、  https://stein.investments でコミュニティに参加しましょう 市場動向を網羅。銘柄ごとに3,000件以上の自動最適化。2種類のアラート。ワンクリックでチャートを切り替えて即座にアクション。 なぜこれが必要なのか 多くのマルチ銘柄スキャナーは、 価格の動き (ボラティリティ、変動率、銘柄ごとのRSI)を表示するだけです。それ
Exp COPYLOT CLIENT for MT5
Vladislav Andruschenko
3.91 (33)
MetaTrader 5 用のプロフェッショナル取引コピー機 MetaTrader 向けの高速・高性能・信頼性の高い 取引コピー機 です。 COPYLOT は、MT4 と MT5 のターミナル間で Forex 取引をコピーでき、 Hedge 口座と Netting 口座の両方に対応しています。 COPYLOT MT5 版の対応構成: - MT5 Hedge → MT5 Hedge - MT5 Hedge → MT5 Netting - MT5 Netting → MT5 Hedge - MT5 Netting → MT5 Netting - MT4 → MT5 Hedge - MT4 → MT5 Netting MT4 版 完全な説明 + DEMO + PDF 購入方法 インストール方法 ログファイルの取得方法 テストと最適化の方法 Expforex のすべての製品 MT4 ターミナルへのコピーも可能です(MT4 → MT4、MT5 → MT4): COPYLOT CLIENT for MT4 COPYLOT は、2台、3台、さらには10台のターミナル間で同時に動作できる、プロフェッ
Premium Trade Manager - MetaTrader 5 向け迅速・規律ある取引管理ツール Premium Trade Manager は、決断に集中しながらパネルがルーティンを担ってくれることを求めるトレーダーのためのツールです。サイジング、発注、分割決済、トレール、ニュース対応、プロップファームの制限管理を、すべての取引で同じ規律ある方法で実行します。 MetaTrader 5 用の高速チャート内パネルで、毎回の取引における機械的な作業を一手に引き受けます。方向・銘柄・タイミングはあなたが決める。パネルはリスクに基づいてポジションサイズを計算し、ストップとターゲットを設定した状態で注文を出し、分割決済でスケールアウトし、残りをトレールします。ファンデッドトレーダーにはさらに一歩踏み込んだ機能があります。主要 8 社のプロップファームの実際のルールを内蔵し、各制限まで今どれだけの余裕があるかをリアルタイムで表示し、ハードリミットを超える注文をブロックします。 購入前に実際に触れて試せます。 インタラクティブなウォークスルーでは、ブラウザ上でライブパネルをそのまま操作で
Quant AI Agents are independent trading Expert Advisors. Instead of trading using a fixed strategy like other conventional EAs, Quant AI Agents   is a   multi-agent AI trading framework   that turns natural-language strategy prompts into live.  WANT THE SAME RESULTS AS MY LIVE SIGNAL?   Use the exact same brokers I do:   IC MARKETS , IC TRADING   .  Unlike the centralized stock market, Forex has no single, unified price feed.  Every broker sources liquidity from different providers, creating un
Farmed Hedge Yield Farming | All Markets (Manual - Hybrid - Semi/Automated EA) MULTI-ASSET SUPPORT Trade any asset available on your broker - Forex: Major, Minor, Exotic pairs - Crypto: BTC, ETH, XRP, SOL, BNB - Stocks: Apple, Tesla, Amazon, Google, etc. - Commodities: Gold, Silver, Oil, Gas - Indices: US30, NAS100, SPX500, DAX40 - Any CFD your broker offers VERIFIED TRADING RESULTS - Farmed Hedge Yield Axi Copy:  https://www.mql5.com/en/signals/2356376 - Farmed Hedge Yield Exn Copy:   https:/
The product will copy all telegram signal to MT5 ( which you are member) , also it can work as remote copier.  Easy to set up, copy order instant, can work with almost signal formats, image signal,  s upport to translate other language to English Work with all type of channel or group, even channel have "Restrict Saving Content", work with  multi channel, multi MT5 Work as remote copier: with signal have ticket number, it will copy exactly via ticket number. Support to backtest signal. How to s
================================================================================ POC BREAKOUT - V20.72. Full Professional Grade Toolkit ================================================================================ POC Breakout is a full MetaTrader 5 trading dashboard for discretionary traders who want breakout signals, Point of Control (POC) context, volume profiles, order flow, market structure, news, alerts, and advanced trade planning in one professional workspace. Attached directly to you
Timeless Charts
Samuel Manoel De Souza
5 (6)
Timeless Charts is an all-in-one trading utility for professional traders. It combines custom chart types such as Seconds Charts and Renko with advanced order flow analysis using Footprints , Clusters , Volume Profiles , VWAP studies, and anchored analysis tools for deeper market insight. Trading and position management are handled directly from the chart through an integrated trade management panel , while Market Replay and Virtual Accounts provide environments for practicing trading skills and
Footprint Chart Pro — Professional OrderFlow EA for MetaTrader 5 Version 6.34 | Professional tool for real traders | Institutional-Grade Visualization DEMO USERS - PLEASE SELECT EVERY TICK / REAL TICK WHEN TESTING AND YOU HAVE DOWNLOADED HISTORICAL DATA. IF YOU SEE A WAITING SCREEN AND IT IS NOT DOWNLOADING, IT MEANS YOU HAVE LOW HISTORICAL DATA. TRY 1 MIN AND 5 MIN FIRST ON 1 DAY DATA. ONE DAY DATA SHOULD BE THE NEWEST AND MOST CURRENT DATE. PLEASE WAIT UNTIL THE MARKET HAS ROLLED OVER PERIOD.
EA を買う前に、本当に耐えられるのか、それともバックテストでたまたま良く見えただけなのかを確認してください。 ほとんどのロボットは、見栄えのするバックテストと一緒に売られています。 右肩上がりのカーブ。 良い Profit Factor。 ほとんど疑いのない見た目。 それでも、その多くの EA は、市場がその履歴どおりに動かなくなった瞬間に崩れ始めます。 なぜでしょうか。 それは、バックテストが証明するのは一つだけだからです。 その戦略が、ある特定の価格の流れでは機能したということです。 別の流れでも通用することは証明しません。 頑健であることも証明しません。 もちろん、その EA があなたのお金に値することも証明しません。 なぜなら、あなたが EA を買うのは過去のきれいなカーブを眺めるためではないからです。 変化する市場で使うために買うのです。 AntiOverfit PRO がすること AntiOverfit PRO は、MetaTrader 5 の Expert Advisor が本当にしっかりしているのか、それとも特定の過去データにたまたまうまくはまっているだけなのかを確
Trade copier MT5
Alfiya Fazylova
4.56 (45)
Trade Copierは、取引口座間の取引をコピーして同期するように設計された専門的なユーティリティです。 コピーは、同じコンピューターまたはvps にインストールされている、サプライヤーのアカウント/端末から受信者のアカウント/端末に行われます。 キャンペーン - すでに「Trade copier MT5」をご購入の方は、「Trade copier MT4」を無料で入手できます(MT4 → MT5 および MT4 ← MT5 のコピー用)。詳細な条件については、どうぞ個別メッセージでお問い合わせください。 購入する前に、デモ アカウントでデモ バージョンをテストできます。 デモ版 こちら 。 詳細な説明は こちら 。 主な機能と利点: MT5ネッティングアカウントを含む、MT5> MT5、MT4> MT5、MT5> MT4のコピーをサポートします。 高いコピー速度(0.5秒未満)。 ベンダーモードと受信者モードは同じ製品内に実装されています。 チャートから直接リアルタイムでコピーを制御できる、簡単で直感的なインターフェイス。 接続が切断されたり、端末が再起動されたりしても、設定と位
この製品は、ニュースタイム中にすべてのエキスパートアドバイザーと手動チャートをフィルタリングするため、急激な価格変動によるマニュアルトレードのセットアップの破壊や他のエキスパートアドバイザーによって入力された取引について心配する必要はありません。この製品には、ニュースのリリース前にオープンポジションとペンディングオーダーを処理できる完全な注文管理システムも付属しています。 The News Filter  を購入すると、将来のエキスパートアドバイザーのためにビルトインのニュースフィルターに頼る必要はなく、今後はすべてのエキスパートアドバイザーをここからフィルタリングできます。 ニュース選択 ニュースソースは、Forex Factoryの経済カレンダーから取得されます。 USD、EUR、GBP、JPY、AUD、CAD、CHF、NZD、CNYなど、任意の通貨数に基づいて選択できます。 Non-Farm(NFP)、FOMC、CPIなどのキーワード識別に基づいて選択することもできます。 影響レベルによってフィルタリングするニュースを選択することができ、低、中、高の影響範囲から選択できます。
Prop Firm Os
Gayathiri Gopalakrishnan
5 (1)
PROP FIRM OS Structured Trading Assistant for MetaTrader 5 PROP FIRM OS is a structured trading assistant designed for MetaTrader 5 users who prefer rule-based market analysis and organized trading workflows. The Expert Advisor combines market analysis tools, scanner functions, dashboard monitoring, alerts, risk-control settings, and trade management features inside one system. PROP FIRM OS is designed to help traders follow selected rules, filters, and monitoring conditions during trading activ
Copy Cat More Trade Copier MT5 (コピーキャット MT5) は、今日の取引課題に対応して設計されたローカルトレードコピーシステムと完全なリスク管理・実行フレームワークです。プロップファームのチャレンジから個人ポートフォリオ管理まで、堅牢な実行、資本保護、柔軟な設定、高度な取引処理の組み合わせで、あらゆる状況に適応します。 コピーシステムはマスター(送信側)とスレーブ(受信側)の両方のモードで動作し、成行注文と指値注文、取引修正、部分決済、両建て決済操作のリアルタイム同期を行います。デモ口座とライブ口座、取引ログインまたは投資家ログインの両方に対応し、EA、ターミナル、またはVPSが再起動してもパーシスタント取引メモリシステムを通じて復旧を保証します。複数のマスターとスレーブをユニークIDで同時に管理でき、ブローカー間の違いはプレフィックス/サフィックス調整またはカスタムシンボルマッピングを通じて自動的に処理されます。 マニュアル/設定  | Copy Cat More MT4 | チャンネル  特別機能: 設定が簡単 — わずか30秒で完了(ビデオをご覧
Seconds Chart - MetaTrader 5で秒足チャートを作成するユニークなツールです。 Seconds Chart を使用すると、秒単位のタイムフレームでチャートを構築でき、標準的な分足や時間足チャートでは得られない柔軟性と分析精度を実現します。例えば、 S15 は15秒足を表します。カスタムシンボルをサポートしているインジケーターやEAをすべて使用できます。標準的なチャートと同様に便利に操作できます。 標準的なツールとは異なり、 Seconds Chart は超短期のタイムフレームでも高い精度と遅延なく作業できるように設計されています。 Free Demo: Seconds Chart v2.29 Demo.ex5 無料デモをダウンロードしてご自身でお確かめください: 完全機能版 - すべての機能を制限なく利用可能 24時間テスト - 精度と利便性を評価するのに十分な時間 デモ口座のみ - ほとんどのブローカーで簡単に開設可能 GBPCADチャートのみ - ほとんどの端末で利用可能 デモのインストール方法(60秒) 上記のリンクからデモファイルをダウンロード Met
YuClusters
Yury Kulikov
4.93 (42)
Attention: You can view the program operation in the free version  YuClusters DEMO .  YuClusters is a professional market analysis system. The trader has unique opportunities to analyze the flow of orders, trade volumes, price movements using various charts, profiles, indicators, and graphical objects. YuClusters operates on data based on Time&Sales or ticks information, depending on what is available in the quotes of a financial instrument. YuClusters allows you to build graphs by combining da
Signal TradingView to MT5 Pro Automator TradingViewとMetaTrader 5間の即時プロフェッショナル実行 TradingViewのシグナル(アラート)とMT5での実際の約定を繋ぐ、最も強固なコミュニケーションブリッジで、取引戦略を自動化します。スピード、柔軟性、そして完璧なリスク管理を求めるトレーダー向けに設計されたこのExpert Advisorは、あらゆるアラートメッセージを正確な成行または指値注文に変換します。 強みと利点 ユニバーサルパーシングエンジン(独自技術): あらゆるアラート形式からデータを自動的に認識し、抽出できる高度なテクノロジー。単一の固定フォーマットに制限されることはありません。システムはシンボル(銘柄)、アクション、価格、SL(ストップロス)、TP(テイクプロフィット)を自動的に理解します。 リアルタイム実行: レイテンシ(遅延)を最小限に抑えるよう最適化された、1秒未満の超高速ポーリング技術。シグナルを受信してから数ミリ秒以内に注文が実行されます。 機関投資家レベルのリスク管理: 以下に基づく自動かつ正確
HINN MAGIC ENTRY – the ultimate tool for entry and position management! Place orders by selecting a level directly on the chart! full description   ::  demo-version  :: 60-sec-video-description Key features: - Market, limit, and pending orders - Automatic lot size calculation - Automatic spread and commission accounting - Unlimited partitial take-profits  - Breakeven and trailing stop-loss and take-profit  functions - Invalidation leves - Intuitive, adaptive, and customizable interface - Works
SMC Trade Pilot MT5 Smart Money Conceptsトレーダー向けの半自動トレーディングアシスタント。チャートのスクリーンショット付きシグナルをTelegramで受け取り、ワンタップでトレードを発注。パソコンから離れていても、スマートフォンからポジションを管理できます。 解決する課題 Smart Moneyのセットアップはあなたを待ってくれません。Order BlocksやLiquidity Sweepsは、ロンドンオープン、ニューヨークオープン、またはアジアセッション中に形成されることが多く、あなたが仕事中、会議中、画面から離れているときに発生します。チャートを確認したときには、セットアップはすでに過ぎ去っています。 SMC Trade Pilotはあなたのスマートフォンをリアルタイムのトレーディングコックピットに変えます。アシスタントはSMCシグナルを求めて24時間チャートをスキャンします。セットアップが形成されると、完全なトレードチケットをTelegramチャットに送信します: チャートスクリーンショット、方向、エントリー価格、推奨ストップロス、推奨テ
Trade Manager は、リスクを自動的に計算しながら、取引を迅速に開始および終了するのに役立ちます。 過剰取引、復讐取引、感情的な取引を防止する機能が含まれています。 取引は自動的に管理され、アカウントのパフォーマンス指標はグラフで視覚化できます。 これらの機能により、このパネルはすべてのマニュアル トレーダーにとって理想的なものとなり、MetaTrader 5 プラットフォームの強化に役立ちます。多言語サポート。 MT4バージョン  |  ユーザーガイド + デモ Trade Manager はストラテジー テスターでは機能しません。 デモについてはユーザーガイドをご覧ください。 危機管理 % または $ に基づくリスクの自動調整 固定ロットサイズを使用するか、ボリュームとピップに基づいた自動ロットサイズ計算を使用するオプション RR、Pips、または価格を使用した損益分岐点ストップロス設定トレーリングストップロス設定 目標に達したときにすべての取引を自動的に終了するための 1 日あたりの最大損失 (%)。 過度のドローダウンからアカウントを保護し、オーバートレードを防ぎます
これは視覚的な取引パネルであり、取引を簡単に配置および管理し、人為的エラーを回避し、取引活動を強化するのに役立ちます。使いやすい視覚的なインターフェースと、健全なリスクおよび位置管理アプローチを組み合わせています。 [ インストールガイド | 更新ガイド | トラブルシューティング | よくある質問 | すべての製品 ] 驚くほど使いやすい チャートから簡単に取引 正確なリスク管理との取引、手間のかからない 資本の保存が最優先事項です 気をつけずに利益を上げましょう できるだけ早くリスクのない取引をお楽しみください 開かれているすべての取引の自動トレーリングストップ 最初のストップロスは、取引が行われるとすぐに配置されます EAは、取引を行った後に次のタスクを実行します。 最初のストップロス/テイクプロフィットは自動的に配置されます できるだけ早くフリーライドにロックします(オプション) ストップロスを初めて損益分岐点に移動します(オプション) 停止するまで、希望の方法を使用してストップロスを追跡します その他のクールな機能は次のとおりです。 優れたターミナルアクティビティレポート
Custom Alerts AIO:マルチマーケット監視を一括で実現 — 設定不要ですぐに使えるインテリジェントツール 概要 Custom Alerts AIO は、追加のインジケーター設定が不要で、インストール後すぐに利用できる高機能マーケットスキャナーです。FX Power、FX Volume、FX Dynamic、FX Levels、IX Power を内部にすべて統合し、主要なすべての資産クラス(為替、金属、指数、暗号資産)を一括監視できます。MetaTrader の仕様により、株式は個別のシンボルとして追加可能ですが、一般的には利用頻度は低めです。 1. なぜ Custom Alerts AIO を選ぶべきか 追加ライセンス不要 • 必要なすべての Stein Investments インジケーターが内蔵されており、すぐに使用可能です。 • チャートに表示されるグラフィックは省略されており、アラート生成に特化した構成です。 市場を広範囲にカバー • 為替、金属、暗号資産、株価指数に対応(株式は手動追加可能)。 • シンボル名を入力する必要はなく、プロパティで資産クラス
作者のその他のプロダクト
1. Why did I develop this series of indicators I found that most traders need to use multiple time frame indicators. They usually switch time frame to see indicators. However, once the timeframe is switched, you cannot see the  corresponding relationship  between  the price in the smaller timeframe  and  the indicator in the larger timeframe . For example: if your price chart is in H1 timeframe, you can see H4, D1 and W1 indicators in H1 timeframe Chart. This is more helpful for you to find th
This product can be used to synchronize multiple Charts, and each Chart can be set to a different sync mode. With this product you can better view and manipulate charts: different time frames for a single Symbol, the same time frame for multiple Symbols... and more. PS: The link below is the FreeDemo product, you can use it on EURUSD/XUAUSD/USDCNH symbol: https://www.mql5.com/en/market/product/38557 Feature: Chart settings  can be synchronized, including : background, indentation, size, etc. M
Do you think it's a bit cumbersome when you need to switch symbols or timeframes with mouse click? 1. What is this? This is a program that can switch symbols and timeframes with direction keys. Fast switching, very convenient, no mouse click required. For traders, one symbol with multi-timeframe charts are usually added,  you can change symbol on those charts easily. For multi-currency traders, different symbol charts are usually added, you can also change those timeframes easily. I wrote this p
1. What is this         Rising volatility and falling volatility are not the same, whether it is academic research or actual testing has shown this point.         The original ATR indicator is calculated by putting up and down fluctuations together. This indicator is to calculate separately the upward volatility and the downward volatility, which can better help you study the market. 2. Indicator description          There are two modes for the calculation of this indicator, as shown in the fo
Have you ever take a long time to watch a Symbol when the network link is not good ? Have you ever wait for a long time when you switch chart between different Symbols or different TimeFrames ? If you do long-term backtesting , Have you ever to be downloaded datas for a long time ? Yes, If there is no data in the system, those will happen.  1. What is this: Download all the Symbol data in Market Watch to the system. PS: This is not outputting data to Files. This Link go to Demo version: https:/
This product can be used to synchronize multiple Charts, and each Chart can be set to a different sync mode. With this product you can better view and manipulate charts: different time frames for a single Symbol, the same time frame for multiple Symbols, system indicators for single/multiple Symbols... and more. Feature: Chart settings can be synchronized, including : background, indentation, size, etc. Multiple Chart window start times  or end times can be synchronized. Multiple Chart time fr
I see that many tools in the market deal with Position and Order in the form of operation panels. Which is loaded into a Chart in the form of an EA. However, once the operator panel EA is loaded, no other EAs can be loaded. So, I wrote the one-click operation of Position and Order as a script, so you can load other EAs and easily complete one-click operation of Trade. 1. What is this: This is a one-click script to close position order. Now you can close position tickets at high speed, for examp
I see that many tools in the market deal with Position and Order in the form of operation panels. Which is loaded into a Chart in the form of an EA. However, once the operator panel EA is loaded, no other EAs can be loaded. So, I wrote the one-click operation of Position and Order as a script, so you can load other EAs and easily complete one-click operation of Trade. 1. What is this: This is a one-click script to delete the pending order . Now you can delete pending tickets at high speed, for
Do you think it's a bit cumbersome when you need to switch symbols or timeframes with mouse click? 1. What is this? This is a program that can switch symbols and timeframes with direction keys. Fast switching, very convenient, no mouse click required. For traders, one symbol with multi-timeframe charts are usually added,  you can change symbol on those charts  easily . For multi-currency traders, different symbol charts are usually added, you can also change those timeframes easily. I wrote thi
According to trading experience: Some symbols are easy to reverse on certain days, such as Monday, or afternoon, and so on. So comparing the current price with the corresponding historical moment price is valuable. If the price coordinate system uses a logarithmic price, you will get a lot of valuable information. 1. What is this? This program can convert the symbol price and add it to your Chart. You can compare it with your major chart. The DEMO version Link: https://www.mql5.com/en/market/pr
1. Why did I develop this series of indicators I found that most traders need to use multiple time frame indicators. They usually switch time frame to see indicators. However, once the timeframe is switched, you cannot see the  corresponding relationship  between  the price in the smaller timeframe  and  the indicator in the larger timeframe . For example: if your price chart is in H1 timeframe, you can see H4, D1 and W1 indicators in H1 timeframe Chart. This is more helpful for you to find th
フィルタ:
削除済み 2019.05.07 12:34 
 

ユーザーは評価に対して何もコメントを残しませんでした

削除済み 2019.05.07 11:43 
 

ユーザーは評価に対して何もコメントを残しませんでした

レビューに返信