Multi Chart Synchronization OthersToFirstChart
- ユーティリティ
- バージョン: 1.23
- アップデート済み: 21 4月 2023
- アクティベーション: 20

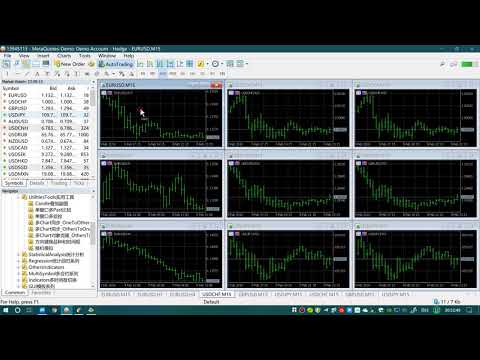
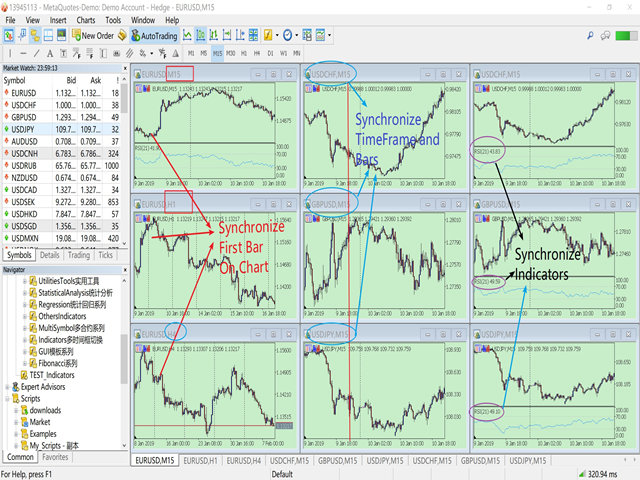
This product can be used to synchronize multiple Charts, and each Chart can be set to a different sync mode. With this product you can better view and manipulate charts: different time frames for a single Symbol, the same time frame for multiple Symbols, system indicators for single/multiple Symbols... and more.
Feature:
- Chart settings can be synchronized, including : background, indentation, size, etc.
- Multiple Chart window start times or end times can be synchronized.
- Multiple Chart time frames can be synchronized.
- Multiple Chart System Indicators can be synchronized.
- Multiple Chart Custom Indicators can be synchronized.
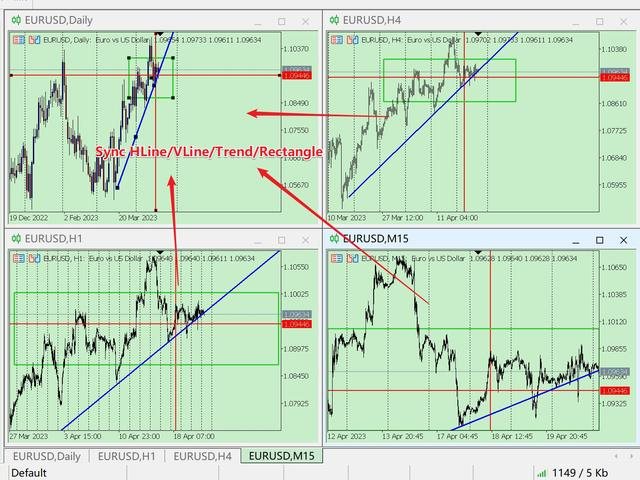
- Multiple Chart HLine/VLine/Trend/Rectangle can be synchronized.
- MT5 can only run one EA/Script for a Chart. This product is compiled in the form of Indicator and does not affect the superposition of other EAs/Scripts.
- Your first open Chart is your operation Chart, you need to load the program into other Charts, please do not load this program into your operation Chart.
- " Your first open Chart " means : When your Chart is empty, Your first open Symbol Chart. (Sometimes you open a lot of Symbol charts, and you dragged the Chart in the Chart List, which causes your leftmost chart is not your first.)
- IsChartSynchronize=true; // Whether to synchronize chart settings of Chart, including window start time.
- IsTimeFrameSynchronize=true; // Whether to synchronize the timeframe of the Chart
- IsSysIndicatorsSynchronize=true; // Whether to synchronize the system Indicators of Chart
- IsCustomIndiSyn = false; //Whether To Synchronize Custom Indicators.
- SynRefreshMillisecond=100; // Set the millisecond frequency of synchronization
- IsLockShift=true; // Is Lock Chart Start_Times And ChartScale
- ---true : the default setting just like previous version.
---false : after synchronize to the first chart, you can drag your other charts, and change ChartScale. If you operate the first chart again, Sync again. - This feature makes synchronization flexible, You can also operate other charts while retaining the sync function.
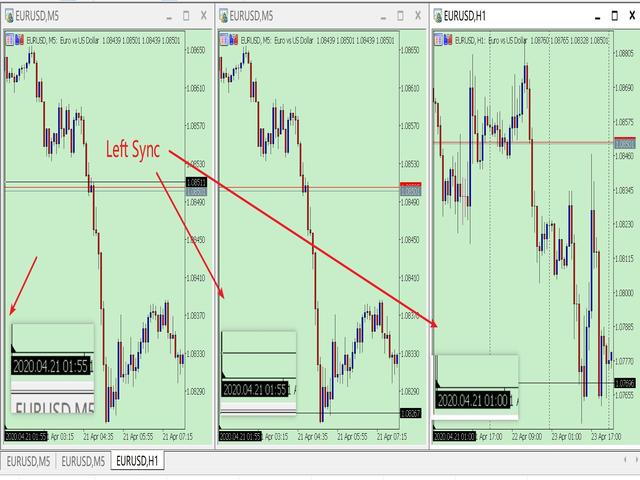
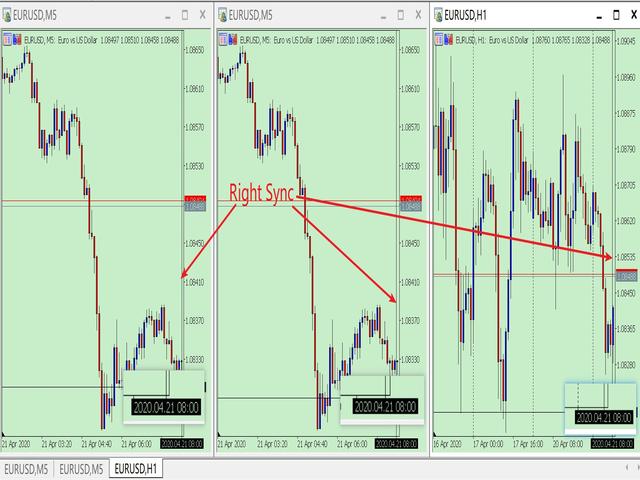
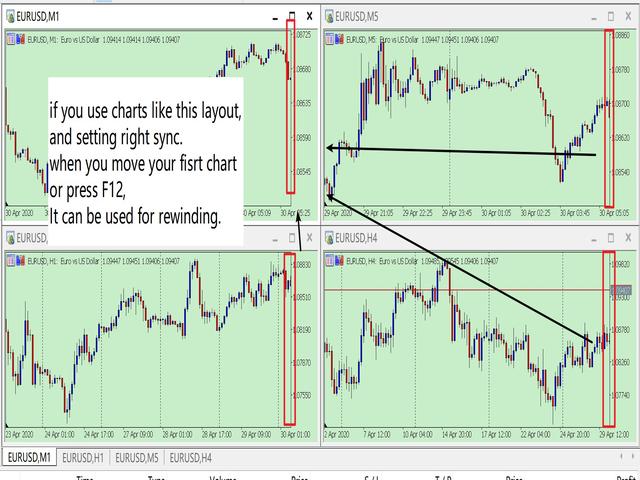
- LeftSyn=true; //true: left synchronized / false: right synchronized
- If you setting right sync, this function can be used for rewinding.
- SynObject = false; // Whether to Syn HLine/VLine/Trend/Rectangle
Synchronize custom indicators should pay attention:
1. Custom indicators are based on the programming ability of the provider.
2. Synchronization of custom indicators is identified by name. And ex5 file must be placed in the Indicators folder.
3. If you want to synchronize different parameters of the same custom indicator, the custom indicator must use the IndicatorSetString() code to set the indicator name with different parameters.
for example: SMA(5), SMA(10) is different parameters with same indicator. But some code only named them SMA.
4. If the provider does not set the indicator name with parameters through IndicatorSetString(), custom indicators with the same name cannot be superimposed. However, it does not affect the synchronization once.
New Function:
Now add the function to synchronize HLine/VLine/Trend/Rectangle. You can see the video link: https://youtu.be/A_3CWyrg3c0
Thanks for using my program.
PS: In my experience, sometimes the Symbol have no data, the MT5 will download the data from the server, which will lead to slowness. I recommend you my another software, it will help to download data to your system
MT4 version:

ユーザーは評価に対して何もコメントを残しませんでした