OneKey DeleteOrder

I see that many tools in the market deal with Position and Order in the form of operation panels. Which is loaded into a Chart in the form of an EA.

However, once the operator panel EA is loaded, no other EAs can be loaded. So, I wrote the one-click operation of Position and Order as a script, so you can load other EAs and easily complete one-click operation of Trade.

1. What is this:

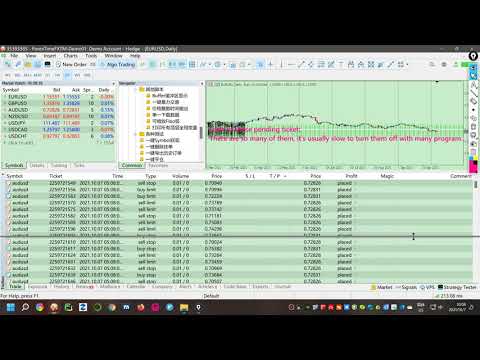
This is a one-click script to delete the pending order.

Now you can delete pending tickets at high speed, for example 1000 pending tickets can be deleted instantaneously.

2. Function:

There are many ways to filter:
  • You can choose the symbol of the pending order.  Default is All.
  • You can choose the type of pending order, Default is All.
  • You can enter magci number, the default is 0.
  • You can enter comment, the default is "".
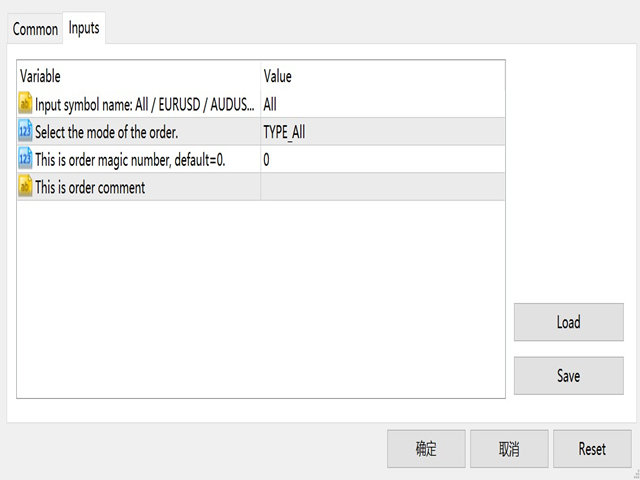
3. Parameters:
  • Input string ForexName="All";                            //Input symbol name: All / EURUSD / AUDUSD / ...
  • Input Enum_OrderType Type_Order=TYPE_All;    //Select the mode of the order.
  • Input int MAGICNUM=0;                                     //This is order magic number, default=0.
  • Input string COMMENT="";                                  //This is order comment
  • Input bool HighSpeed=true; //True represents high speed execution
Thanks for using!


おすすめのプロダクト
Bonus when buying an indicator or an advisor from my list. Write to me in private messages to receive a bonus. Manual Assistant MT5 is a professional manual trading tool that will make your trading fast and comfortable. It is equipped with all the necessary functions that will allow you to open, maintain and close orders and positions with one click. It has a simple and intuitive interface and is suitable for both professionals and beginners. The panel allows you to place buy and sell orders w
FREE
Overview FiT Panel Pro is a professional-grade trade management panel designed for MetaTrader 5 traders who demand speed, precision, and full control over their trades. Built with a modern dark-theme UI, it combines one-click execution with advanced risk management, visual SL/TP drag lines, automatic Fibonacci-based levels, and comprehensive order management — all in a single, compact panel. Whether you are a scalper, day trader, or swing trader, FiT Panel Pro gives you the edge you need to exec
FREE
BTC Scalper - Automated RSI Breakout Strategy for BTCUSD Unlock the power of automated trading with BTC Scalper! This expert advisor is a fully autonomous trading strategy, designed to capitalize on fast-moving BTCUSD markets. It leverages a potent combination of RSI Breakouts and two Exponential Moving Averages (EMA) to find high-probability trade entries, ensuring optimal confluence for success. Key Features: Fully Automated Trading : Set it, forget it, and let BTC Scalper handle your trades 2
FREE
MAFX Trading Manager
Mark Anthony Noblefranca Nazarrea
5 (1)
MAFX Trading Manager MetaTrader 5 用 プロフェッショナル手動トレード管理パネル 製品概要 MAFX Trading Manager は、MetaTrader 5 用に設計された プロフェッショナルな手動トレード管理パネルです。 高速な注文執行と必要なトレード管理機能を、 コンパクトで使いやすいインターフェースで提供します。 本製品は、自動売買やシグナルに頼らず、 より高いコントロール性、スピード、一貫性を求める 手動トレーダー向けに設計されています。 主な特長 MT5の注文画面を開かずにワンクリックでBuy / Sell Stop Loss と Take Profit の統合管理 部分決済およびブレイクイーブン機能 チャートを妨げないコンパクトなパネル 軽量で安定したパフォーマンス スキャルピング、デイトレード、裁量取引に最適 XAUUSD(ゴールド)および BTC 向けに最適化された初期設定 継続的なメンテナンスとアップデート 主な機能 成行 Buy / Sell 実行 ロットサイズ調整 Stop Loss / Take Profit 管理 オフセッ
FREE
This indicator creates a Renko-based custom symbol in MetaTrader 5. Renko charts are built using price movement only, not time, making them useful for analyzing trends and filtering noise. Features Customizable brick size in points. Option to calculate brick size using ATR (adaptive). Ability to show or hide wicks. Creates and updates a custom Renko chart symbol. Automatically opens the chart window (optional). Maintains a limited bar history for performance. Inputs BrickSizePoints – brick size
FREE
概要 このインジケーターは、クラシックな ドンチャンチャネル を強化したバージョンで、実践的なトレード機能を追加しています。 標準の3本線(上限、下限、中央線)に加え、 ブレイクアウト を検出し、チャート上に矢印で視覚的に表示します。また、チャートを見やすくするために、 現在のトレンド方向と逆側のラインのみを表示 します。 インジケーターの機能: 視覚的シグナル :ブレイクアウト時にカラフルな矢印を表示 自動通知 :ポップアップ、プッシュ通知、Eメール RSIフィルター :市場の相対的な強弱に基づいてシグナルを検証 カスタマイズ可能 :色、ラインの太さ、矢印コード、RSI閾値など 動作原理 ドンチャンチャネルは次のように計算します: 上限線 :直近N本のクローズ済みローソク足の最高値 下限線 :直近N本のクローズ済みローソク足の最安値 中央線 :最高値と最安値の平均値 上方ブレイクアウト は終値が上限線を超えたときに発生し、 下方ブレイクアウト は終値が下限線を下回ったときに発生します。 インジケーターは以下を行います: 3本のドンチャンラインを描画 方向転換後の最初のブレイクアウト
FREE
Are you tired of drawing trendlines every time you're analyzing charts? Or perhaps you would like more consistency in your technical analysis. Then this is for you. This indicator will draw trend lines automatically when dropped on a chart. How it works Works similar to standard deviation channel found on mt4 and mt5. It has 2 parameters: 1. Starting Bar 2. Number of bars for calculation The   starting bar   is the bar which drawing of the trend lines will begin, while the   number of bars for c
FREE
CosmiCLab SMC FIBO CosmiCLab SMC FIBO is a professional trading indicator designed for traders who use Smart Money Concepts (SMC), market structure analysis and Fibonacci retracement levels. The indicator automatically detects market swings and builds Fibonacci levels based on the latest impulse movement. It also identifies market structure changes such as BOS (Break of Structure) and CHOCH (Change of Character), helping traders understand the current market direction. CosmiCLab SMC FIBO also pr
Renko Builder GLX1
Eranga Thilina Dhanushka Gallage
GLX1 Renko Builder   Expert Advisor (EA) can create the Renko bar charts on any symbol. The Renko charts are generated as real-time custom symbol charts which can be further used for technical analysis with any MT5 compatible indicator.  Find the free   GLX1 Renko Euro   Expert Advisor from here.  https://www.mql5.com/en/market/product/115074 Included Features: Truly responsive Renko Charting on a custom symbol chart Accurate automatic live chart update Ability to attach any MT5 indicator Abi
Renko Chart
Marcin Konieczny
3.56 (9)
This indicator allows to display Renko charts in the indicator window. Renko charts show only price movements that are bigger than the specified box size. It helps to eliminate noise and allows to focus on main trends. Time is not a factor here. Only price movements are taken into account. That's why Renko chart is not synchronized with the main chart it is attached to. Indicator works in two modes: CLOSE - only close prices are taken into account while building the chart HIGH_LOW - only high/l
FREE
Core Purpose ​ A permanent crosshair indicator designed exclusively for MetaTrader 5 (MT5). It addresses key limitations of MT5's default crosshair, including the need for manual activation, automatic disappearance on click, and solid lines obscuring price bars. This indicator optimizes chart analysis by delivering a smooth, professional-grade crosshair experience on MT5. ​ Key Features ​ Automatic activation: Enabled immediately after loading, replacing the default Ctrl+F function. The crossha
FREE
Introducing   Order Blocks Breaker , a brand-new way to identify and leverage order blocks in your trading strategy. After developing multiple order block tools with unique concepts, I’m proud to present this tool that takes things to the next level. Unlike previous tools,   Order Blocks Breaker   not only identifies order blocks but also highlights   Breaker Order Blocks —key areas where the price is likely to retest after a breakout. MT4 -  https://www.mql5.com/en/market/product/124101/ This t
Core function Intelligent transaction management one-click opening and closing operation, which supports user-defined lots to set multiple closing modes: all closing, closing by direction and closing by profit and loss status. Professional risk control, real-time risk monitoring and spread control to avoid high-cost trading environment. Visual control panel has an intuitive graphical interface, and all functions can be operated with one button to display position information, profit and loss sta
FREE
目的: マーケットウォッチ の全シンボルを、現在の時間軸(TF)で default.tpl テンプレートを使用して自動的に開き、現在アクティブなチャート以外をすべて閉じます。手動操作不要で複数銘柄の分析に最適! 特徴: 自動化: 数十のチャートを1クリックで開く。 安全性: 不要なチャートを閉じ、現在のチャートを維持。 柔軟性: カスタム default.tpl テンプレートを使用(事前に設定が必要!)。 現在の時間軸: アクティブなチャートのTFと同じ時間軸で開く。 インストール: OpenAllSymbolsSafe.mq5 をMetaTrader 5の MQL5/Scripts フォルダにコピー。 ターミナルを再起動するか、スクリプトリストを更新(右クリック→ 更新 )。 ️ 重要: default.tpl が MQL5/Profiles/Template/ にあることを確認。 現在のチャート以外はすべて閉じるため、作業に支障がないか確認。 現在のTFがサポートされていない場合、最寄りのTFで開く。
FREE
Gold Trader Pro is an advanced analytical tool specifically engineered for professional trading on XAUUSD (Gold). It provides an immediate comprehensive overview of market structure across 7 different timeframes, allowing traders to identify flow direction and signal strength through a modern, draggable, and interactive interface. Key Features Multi-Timeframe Analysis: Real-time monitoring of M1, M5, M15, M30, H1, H4, and D1. Two Operational Modes: MODE_SCALPING: Optimized for fast-paced analys
FREE
FREE Prop Firm Navigator EA - Advanced Trend-Following & Protection Developed by the EA Trading Academy team using Expert Advisor Studio , this free trading robot combines powerful trend-following indicators with a robust set of account protection features to secure your trading capital. You can find a detailed documentation about the properties and inputs on our  knowledge base . Key Strategy Features: Uses Bulls Power and Awesome Oscillator indicators for precise entry signals Sophisticat
FREE
Daily Variation Indicator Daily Variation Indicator shows the percentage difference between the current price and the previous day close. The indicator displays the daily market movement directly on the chart, allowing traders to quickly identify whether the market is moving up or down during the current trading session. It is designed to be lightweight, minimal, and highly configurable while providing clear information about the daily price variation. Features • Displays daily percentage variat
Trade Launchは、手動での取引開始時にスピードとコントロールを重視するトレーダー向けに設計された、直感的な取引パネルです。チャート上に直接表示され、すべての主要な注文パラメータを1つのウィンドウで管理できます。 主な特徴: 瞬時の注文執行:   ボタンを1回押すだけで買いポジションと売りポジションを開きます。ボタン名は現在のAsk価格とBid価格を動的に表示します。 内蔵リスク管理:   ロット数、およびストップロスとテイクプロフィットの値をポイント数で入力するための便利なフィールド。パネルはそれらを自動的に価格レベルに再計算します。 取引前確認:   ポジションを開く前に、詳細情報(取引量、エントリー価格、SL/TPレベル、預金通貨で計算された潜在リスクと利益の指標)が表示される情報ウィンドウが表示されます。 カスタマイズ可能な確認:   さらに高速な取引のために、確認ウィンドウを無効にすることができます。 アダプティブインターフェース:   パネルは価格を自動的に更新し、あらゆる取引銘柄および時間足で正しく動作します。 仕組み: 「Lot」フィールドに希望のロット数を指定
FREE
Order Book, known also as Market Book, market depth, Level 2, - is a dynamically updated table with current volumes of orders to buy and to sell specific financial instument at price levels near Bid and Ask. MetaTrader 5 provides the means for receiving market book from your broker, but in real time only, without access to its history. The indicator OrderBook Cumulative Indicator accumulates market book data online and visualizes them on the chart. In addition, the indicator can show the market
Account Info EA It is a tool that presents on the graph all the positions of the account, and specific information concerning the positions, but also the account. It enables the user to have an image of his account at a glance. Use like any expert advisor. You can't attach it in the same chart with other expert advisor. It does not have the ability to open or manage positions. You can attach it on any chart and any timeframe.
FREE
Spread Times Histogram and Statsは、MetaTrader 5のスプレッド監視インジケーターです。ブローカーのスプレッドをリアルタイムでカラーコード付きヒストグラムとして表示し、ローリング24時間平均を追跡し、スプレッドが設定可能な動的しきい値を超えるとスマートアラートを発します。 主な機能 - カラーコード付きヒストグラム:スプレッド縮小時は緑、拡大時は赤 - ローリング24時間平均線で継続的なコンテキストを提供 - セッション統計:現在のセッションの最小・最大・平均スプレッド - スマートアラートシステム:ライブスプレッドが24H平均の設定倍数を超えると発動 - マルチタイムフレーム集計:上位チャートで実行しながら下位タイムフレームのデータを取得 - D1以上のチャートではH4集計に自動ダウングレードしてエラーを防止 - ライブスプレッド・平均・しきい値・セッション統計を表示するオプションのダッシュボード - ステータス表示:ウォームアップ中、正常、スプレッドスパイク アラートオプション - MT5ポップアップアラート(視覚・音声) - MT5
FREE
VR カラー レベルは、トレンドライン、四角形、テキストなどの要素を使用してテクニカル分析を適用する人にとって便利なツールです。グラフにテキストを直接追加したり、スクリーンショットを撮ったりすることができます。 設定、設定ファイル、デモ版、説明書、問題解決方法は、以下から入手できます。 [ブログ] レビューを読んだり書いたりすることができます。 [リンク] のバージョン [MetaTrader 4] インジケーターの操作は ワンクリック で実行できます。これを行うには、線の付いたボタンをクリックすると、カーソルの下に傾向線が表示されます。次に、カーソルを移動して 線の位置 を選択し、もう一度クリックして修正します。 インジケーター の特徴は、スタイルと色のすべての変更が自動的に保存され、その後すべての 新しく作成された グラフィック オブジェクトに適用されることです。 このインジケーターには、異なるスタイルのトレンド ラインを設定するための 2 つの独立したボタン、異なるスタイルの 2 つの独立した四角形、独自のスタイルを持つ 1 つのテキスト フィールド、およびスクリーンショット
FREE
Basic Theme Builder: チャートカスタマイズを簡単に Basic Theme Builder インジケーターで、MetaTrader 5   のチャート外観のカスタマイズをシンプルに変革しましょう。この直感的なインジケーターは、使いやすいパネルを提供し、さまざまなテーマやカラースキームを簡単に切り替えることができます。これにより、取引環境の視覚的な魅力と機能性が向上します。 Free MT4 version Basic Theme Builder インジケーターは、MetaTrader 5 のチャートを簡単にパーソナライズしたいトレーダーに最適なツールです。シンプルなパネルインターフェースとさまざまなテーマプリセットを使用して、取引スタイルや気分に合わせてチャートの外観をすぐに調整できます。クラシックなルックからモダンな美学まで、多彩なオプションを提供する Basic Theme Builder で、視覚体験を最適化しましょう。 主な機能: 簡単なテーマ管理: 便利なパネルインターフェースを使用して、ワンクリックでチャートのテーマを素早く変更できます。 定義済みのプ
FREE
Ratio Indicator - User Guide Special Deal! Leave a review and get the indicator  Long & Short Cointegration Analyzer for free — just send me a message! This Ratio indicator between assets allows you to monitor and trade the price relationship between two assets selected by the user. It calculates the ratio between the prices of two assets, referred to as Asset1 and Asset2 (e.g., "GBPUSD" and "EURUSD"), and plots a moving average of the ratio along with Bollinger Bands . These bands are used to
FREE
AP VWAP Bands Pro (MT5) Volume-weighted average price with ±σ bands for clear intraday bias, mean-reversion zones, and dynamic support/resistance. Works on crypto (incl. BTC) , FX , indices , and metals . Uses tick-volume when real volume isn’t available. What it shows VWAP line (volume-weighted mean price). Two envelopes around VWAP (default ±1σ and ±2σ) to highlight balance vs. extension. Reset modes : Day , Week , or Anchor Time (HH:MM) to start VWAP where you need it (e.g., exchange open).
FREE
Statistical Arbitrage Spread Generator for Cointegration [MT5] What is Pair Trading? Pair trading is a market-neutral strategy that looks to exploit the relative price movement between two correlated assets — instead of betting on the direction of the market. The idea? When two assets that usually move together diverge beyond a statistically significant threshold, one is likely mispriced. You sell the expensive one, buy the cheap one , and profit when they converge again. It’s a statistica
FREE
Gino Renko
Stephane, Andr Valette
1 (1)
Another renko-based indicator. It returns different usable values ​​for an EA, and is directly displayed on the main chart. Its setting is very simple: The size of the renko The number of bars taken into account The falling color The color on the rise Returned values: Buffer 0 : Value of the middle Buffer 1 : Value of the Top Buffer 2 : Value of the Bottom Buffer 3 : Direction of renko (0.0 for top ; 1.0 for bottom) Buffer 4 : Ratio of the renko, for example, if it is twice, 3 times, ro more of
Important Lines
Terence Gronowski
4.88 (24)
This indicator displays Pivot-Lines, preday high and low, preday close and the minimum and maximum of the previous hour. You just have to put this single indicator to the chart to have all these important lines, no need to setup many single indicators. Why certain lines are important Preday high and low : These are watched by traders who trade in a daily chart. Very often, if price climbs over or falls under a preday low/high there is an acceleration in buying/selling. It is a breakout out of a
FREE
This indicator will mirror the assets in use in another metatrader, being able to choose the timeframe and a template. This is the Metatrader 5 Client, it needs the Metatrader 4 or 5 Server versions: Metatrader 4 Mirror Chart Server:   https://www.mql5.com/en/market/product/88644 Metatrader 5 Mirror Chart Server: https://www.mql5.com/en/market/product/88652 Details of how it works in the video.
FREE
FREE FREE FREE Trade Assistant MT5 – Professional Trading & Risk Management Panel Trade Assistant MT5 is an advanced trading panel designed to help traders execute orders faster, safer, and more professionally . It simplifies manual trading by combining smart order management , precise risk control , and one-click execution , making it ideal for both beginners and advanced traders. This tool does not trade automatically . Instead, it empowers you with full control while applying professional-gra
FREE
このプロダクトを購入した人は以下も購入しています
Trade Assistant MT5
Evgeniy Kravchenko
4.42 (208)
取引 ごとのリスクの 計算、新規注文 の 簡単 な 設置、部分的 な 決済機能 を 持 つ 注文管理、 7 種類 のトレーリングストップなど 、便利 な 機能 を 備 えています 。 追加の資料と説明書 インストール手順   -   アプリケーションの手順   -   デモアカウント用アプリケーションの試用版 ライン機能 チャート上にオープニングライン、ストップロス、テイクプロフィットを表示します。この機能により、新規注文を簡単に設定することができ、注文を出す前にその特徴を確認することができます。   リスク計算 リスク計算機能は、設定されたリスクとストップロス注文のサイズを考慮して、新規注文のボリュームを計算します。ストップロスの大きさを自由に設定できると同時に、設定したリスクを守ることができます。 Lot calc ボタン - リスク 計算 を 有効 / 無効 にします 。 Risk フィールドでは 、必要 なリスクの 値 を 0 から 100 までのパーセンテージまたは 預金通貨 で 設定 します 。 設定」 タブで 、 リスク 計算 の 種類 を 選択 します :「 $ 通
Trade Manager EAへようこそ。これは、取引をより直感的、正確、そして効率的にするために設計された究極の リスク管理ツール です。これは単なるオーダー実行ツールではなく、包括的な取引計画、ポジション管理、リスク管理のためのソリューションです。初心者から上級者、迅速な実行を必要とするスキャルパーまで、Trade Manager EAはあらゆるニーズに対応し、為替、指数、商品、暗号通貨などさまざまな市場で柔軟に対応します。 Trade Manager EAを使用すると、複雑な計算が過去のものになります。市場を分析し、エントリーポイント、ストップロス、テイクプロフィットのレベルをチャート上のラインでマークし、リスクを設定するだけで、Trade Managerが最適なポジションサイズを即座に計算し、SLとTPをピップ、ポイント、口座通貨でリアルタイムに表示します。すべての取引が簡単かつ効果的に管理されます。 主な機能: ポジションサイズ計算機 :定義されたリスクに基づいて取引サイズを瞬時に決定します。 簡単な取引計画 :エントリー、ストップロス、テイクプロフィットを設定するためのド
Local Trade Copier EA MT5
Juvenille Emperor Limited
4.96 (135)
Local Trade Copier EA MT5 による、驚くほど高速な取引コピーを体験してください。1分で簡単にセットアップできるこの取引コピー機は、同じWindowsコンピュータまたはWindows VPS上の複数のMetaTrader端末間で取引をコピーすることができ、0.5秒未満の高速コピースピードを実現します。 初心者であろうとプロのトレーダーであろうと、 Local Trade Copier EA MT5 には、あなたの特定のニーズに合わせてカスタマイズするための幅広いオプションが用意されています。これは、利益の可能性を高めたい人にとって究極のソリューションです。 今すぐ試してみて、これが市場で最も速くて簡単なトレードコピー機である理由を理解してください。 ヒント: デモアカウントで Local Trade Copier EA MT5 デモバージョンをダウンロードして試すことができます: ここ ダウンロードした無料のデモ ファイルを MT5 >> ファイル >> データ フォルダを開く >> MQL5 >> Experts フォルダに貼り付けて、ターミナルを再起動しま
TradePanel MT5
Alfiya Fazylova
4.87 (153)
Trade Panelは多機能なトレーディングアシスタントです。アプリには手動取引用の50以上のトレーディング機能が搭載されており、ほとんどの取引作業を自動化することができます。 ご注意ください!割引は期間限定で、毎週火曜日に価格が5ドルずつ上昇します(上限100ドルまで)。 購入前に、デモアカウントでアプリのデモ版をテストすることができます。デモアカウント用のアプリの試用版をダウンロードするには、次のリンクをご利用ください: https://www.mql5.com/en/blogs/post/750865 。 完全な手順 こちら 。 取引。 ワンクリックで取引操作を行うことができます: リスクを自動計算して指値注文やポジションを開く。 複数の注文やポジションをワンクリックで開く。 注文のグリッドを開く。 保留中の注文やポジションをグループごとに閉じる。 ポジションの方向を反転(Buyを閉じてSellを開く、またはSellを閉じてBuyを開く)。 ポジションをブロックする(不足している量のポジションを開くことでBuyとSellのポジション量を等しくする)。 すべてのポジションを部分的
ベータリリース Telegram to MT5 Signal Trader はまもなく正式なアルファ版をリリースします。いくつかの機能はまだ開発中で、小さな不具合に遭遇する可能性があります。問題が発生した場合はぜひご報告ください。皆さまのフィードバックがソフトウェア改善に役立ちます。 Telegram to MT5 Signal Trader は、 Telegram のチャンネルやグループからの取引シグナルを自動的に MetaTrader 5 にコピーする強力なツールです。 パブリックおよびプライベートの両方のチャネルに対応し、複数のシグナル提供元を複数のMT5口座に接続可能です。ソフトウェアは高速で安定し、すべての取引を細かく制御できます。 インターフェースは直感的で、ダッシュボードとチャートは見やすく設計されており、リアルタイムで動作状況をモニターできます。 必要環境 MQL の制限により、EA は Telegram と通信するためのデスクトップアプリが必要です。 インストーラーは公式の インストールガイド にあります。 主な機能 マルチプロバイダー: 複数の Telegram
Farmed Hedge Yield Farming | All Markets (Manual - Hybrid - Semi/Automated EA) MULTI-ASSET SUPPORT Trade any asset available on your broker - Forex: Major, Minor, Exotic pairs - Crypto: BTC, ETH, XRP, SOL, BNB - Stocks: Apple, Tesla, Amazon, Google, etc. - Commodities: Gold, Silver, Oil, Gas - Indices: US30, NAS100, SPX500, DAX40 - Any CFD your broker offers VERIFIED TRADING RESULTS - Farmed Hedge Yield Axi Copy:  https://www.mql5.com/en/signals/2356376 - Farmed Hedge Yield Exn Copy:   https:/
Exp COPYLOT CLIENT for MT5
Vladislav Andruschenko
3.82 (34)
MetaTrader 5 用のプロフェッショナル取引コピー機 MetaTrader 向けの高速・高性能・信頼性の高い 取引コピー機 です。 COPYLOT は、MT4 と MT5 のターミナル間で Forex 取引をコピーでき、 Hedge 口座と Netting 口座の両方に対応しています。 COPYLOT MT5 版の対応構成: - MT5 Hedge → MT5 Hedge - MT5 Hedge → MT5 Netting - MT5 Netting → MT5 Hedge - MT5 Netting → MT5 Netting - MT4 → MT5 Hedge - MT4 → MT5 Netting MT4 版 完全な説明 + DEMO + PDF 購入方法 インストール方法 ログファイルの取得方法 テストと最適化の方法 Expforex のすべての製品 MT4 ターミナルへのコピーも可能です(MT4 → MT4、MT5 → MT4): COPYLOT CLIENT for MT4 COPYLOT は、2台、3台、さらには10台のターミナル間で同時に動作できる、プロフェッ
Trade copier MT5
Alfiya Fazylova
4.59 (41)
Trade Copierは、取引口座間の取引をコピーして同期するように設計された専門的なユーティリティです。 コピーは、同じコンピューターまたはvps にインストールされている、サプライヤーのアカウント/端末から受信者のアカウント/端末に行われます。 キャンペーン - すでに「Trade copier MT5」をご購入の方は、「Trade copier MT4」を無料で入手できます(MT4 → MT5 および MT4 ← MT5 のコピー用)。詳細な条件については、どうぞ個別メッセージでお問い合わせください。 購入する前に、デモ アカウントでデモ バージョンをテストできます。 デモ版 こちら 。 詳細な説明は こちら 。 主な機能と利点: MT5ネッティングアカウントを含む、MT5> MT5、MT4> MT5、MT5> MT4のコピーをサポートします。 高いコピー速度(0.5秒未満)。 ベンダーモードと受信者モードは同じ製品内に実装されています。 チャートから直接リアルタイムでコピーを制御できる、簡単で直感的なインターフェイス。 接続が切断されたり、端末が再起動されたりしても、設定と位
The product will copy all telegram signal to MT5 ( which you are member) , also it can work as remote copier.  Easy to set up, copy order instant, can work with almost signal formats, image signal,  s upport to translate other language to English Work with all type of channel or group, even channel have "Restrict Saving Content", work with  multi channel, multi MT5 Work as remote copier: with signal have ticket number, it will copy exactly via ticket number. Support to backtest signal. How to s
Anchor: The EA Manager A coordination system for traders running multiple EAs. Anchor ensures only one EA can trade at a time, preventing conflicting positions and keeping your portfolio safer. Attach Anchor to any chart. Configure your EAs and their magic numbers. Anchor handles the rest. Built for portfolios. Built for discipline. Built for prop firms. The Problem Running multiple EAs on the same account creates risk. Two gold EAs can open opposite positions on the same candle. Three EA
Timeless Charts
Samuel Manoel De Souza
5 (4)
Timeless Charts is an advanced charting solution designed for professional traders seeking for custom charts / custom timeframes , including seconds charts / seconds timeframe, renko charts / renko bars, cluster charts / footprint charts and advanced tools present in most of the popular platforms. Unlike traditional offline charts or simplistic custom indicators, this solution constructs fully custom bars with true timestamp accuracy , down to miliseconds, allowing for a powerful and precise tr
Footprint Chart Pro — Professional OrderFlow EA for MetaTrader 5 Version 6.34 | Professional tool for real traders | Institutional-Grade Visualization DEMO USERS - PLEASE SELECT EVERY TICK / REAL TICK WHEN TESTING AND YOU HAVE DOWNLOADED HISTORICAL DATA. IF YOU SEE A WAITING SCREEN AND IT IS NOT DOWNLOADING, IT MEANS YOU HAVE LOW HISTORICAL DATA. TRY 1 MIN AND 5 MIN FIRST ON 1 DAY DATA. ONE DAY DATA SHOULD BE THE NEWEST AND MOST CURRENT DATE. PLEASE WAIT UNTIL THE MARKET HAS ROLLED OVER PERIOD.
Seconds Chart - MetaTrader 5で秒足チャートを作成するユニークなツールです。 Seconds Chart を使用すると、秒単位のタイムフレームでチャートを構築でき、標準的な分足や時間足チャートでは得られない柔軟性と分析精度を実現します。例えば、 S15 は15秒足を表します。カスタムシンボルをサポートしているインジケーターやEAをすべて使用できます。標準的なチャートと同様に便利に操作できます。 標準的なツールとは異なり、 Seconds Chart は超短期のタイムフレームでも高い精度と遅延なく作業できるように設計されています。 Seconds Chartの利点 1秒から900秒 までのタイムフレームをサポート。 組み込みのティックデータベースにより、ヒストリカルデータを 瞬時にロード 。 リアルタイムでデータが更新され、 遅延やラグなし 。 複数の秒足チャートを同時に作成可能。 Seconds Chartが最適な用途 スキャルピング や高頻度取引。 正確なエントリーとエグジット。 短期タイムフレームでの取引戦略のテスト。 タイムフレームの設定 デフォルトの設
Copy Cat More Trade Copier MT5 (コピーキャット MT5) は、今日の取引課題に対応して設計されたローカルトレードコピーシステムと完全なリスク管理・実行フレームワークです。プロップファームのチャレンジから個人ポートフォリオ管理まで、堅牢な実行、資本保護、柔軟な設定、高度な取引処理の組み合わせで、あらゆる状況に適応します。 コピーシステムはマスター(送信側)とスレーブ(受信側)の両方のモードで動作し、成行注文と指値注文、取引修正、部分決済、両建て決済操作のリアルタイム同期を行います。デモ口座とライブ口座、取引ログインまたは投資家ログインの両方に対応し、EA、ターミナル、またはVPSが再起動してもパーシスタント取引メモリシステムを通じて復旧を保証します。複数のマスターとスレーブをユニークIDで同時に管理でき、ブローカー間の違いはプレフィックス/サフィックス調整またはカスタムシンボルマッピングを通じて自動的に処理されます。 マニュアル/設定  | Copy Cat More MT4 | チャンネル  特別機能: 設定が簡単 — わずか30秒で完了(ビデオをご覧
Helios Pulse v1.03 — リアルタイム確率ダッシュボード|裁量トレーダー向け Helios Pulseは、マーケットの読み方を根本から変えます。複数のインジケーターウィンドウを切り替えながら矛盾するシグナルを解読する必要はもうありません。ひとつの明確な答え——現在のマーケットの方向性バイアスを示すリアルタイム確率パーセンテージが、ティックごとに連続更新されます。 これは単なるシグナル矢印パネルではありません。Helios Pulseは、複数のテクニカル分析次元の一致度を測定し、本当に信頼できる確信度スコアを算出する確率エンジンです。方向だけでなく、その方向がどれほど確かなのか——そしてそれがリアルタイムで強まっているのか弱まっているのかを見ることができます。 チャート上の表示 コンパクトなダークテーマのパネルがチャート上に配置され、ロングとショートの2つのダイナミック確率カードが表示されます。マーケット状況の変化に応じて、カードの色の強度が淡色から鮮明に変化し、数値を確認する前に瞬時に視覚的な判断が得られます。明確な判定ラベルが現在の状態を表示します:Strong Bu
Trade Manager DashPlus
Henry Lyubomir Wallace
5 (13)
DashPlus は、MetaTrader 5プラットフォーム上での取引効率と効果を向上させるために設計された高度なトレード管理ツールです。リスク計算、注文管理、高度なグリッドシステム、チャートベースのツール、パフォーマンス分析など、包括的な機能を提供します。 主な機能 1. リカバリーグリッド 逆境の市場環境下で取引を管理するための平均化および柔軟なグリッドシステムを実装します。 取引回復のための戦略的なエントリーおよびエグジットポイントを可能にします。 2. スタックグリッド 強い市場の動きの中でポジションを追加することで、有利な取引での潜在的なリターンを最大化するように設計されています。 トレンド市場で利益を得られるよう、勝ち取引を拡大します。 3. 損益(P&L)ライン チャート上に直接、潜在的な利益と損失のシナリオを視覚的に表示します。 設定を調整し、P&Lラインをドラッグして、実行前にさまざまな取引結果を評価します。 4. バスケットモード 同じシンボルでの複数ポジションの管理を簡素化し、それらを単一の集約ポジションにまとめます。 平均価格に基づいて、ストップロスやテイクプ
MT5 to Telegram Signal Provider は、Telegramのチャット、チャンネル、またはグループに 指定された シグナルを送信することができる、完全にカスタマイズ可能な簡単なユーティリティです。これにより、あなたのアカウントは シグナルプロバイダー になります。 競合する製品とは異なり、DLLのインポートは使用していません。 [ デモ ] [ マニュアル ] [ MT4版 ] [ Discord版 ] [ Telegramチャンネル ]  New: [ Telegram To MT5 ] セットアップ ステップバイステップの ユーザーガイド が利用可能です。 Telegram APIの知識は必要ありません。必要な全ては開発者から提供されます。 主な特長 購読者に送信する注文の詳細をカスタマイズする機能 例えば、Bronze、Silver、Goldといった階層型のサブスクリプションモデルを作成できます。Goldサブスクリプションでは、すべてのシグナルが提供されます。 id、シンボル、またはコメントによって注文をフィルターできます 注文が実行されたチャート
Trade Dashboard simplifies how you open, manage, and control your trades, with built-in lot size calculation. It allows you to execute trades, manage risk, and control positions directly on the chart, with tools such as partial close, breakeven, and trailing stop. Designed to reduce manual work and help you stay focused on your trading decisions. A demo version is available for testing. Detailed explanations of features are provided within the MQL5 platform. Installation instructions are include
EA を買う前に、本当に耐えられるのか、それともバックテストでたまたま良く見えただけなのかを確認してください。 ほとんどのロボットは、見栄えのするバックテストと一緒に売られています。 右肩上がりのカーブ。 良い Profit Factor。 ほとんど疑いのない見た目。 それでも、その多くの EA は、市場がその履歴どおりに動かなくなった瞬間に崩れ始めます。 なぜでしょうか。 それは、バックテストが証明するのは一つだけだからです。 その戦略が、ある特定の価格の流れでは機能したということです。 別の流れでも通用することは証明しません。 頑健であることも証明しません。 もちろん、その EA があなたのお金に値することも証明しません。 なぜなら、あなたが EA を買うのは過去のきれいなカーブを眺めるためではないからです。 変化する市場で使うために買うのです。 AntiOverfit PRO がすること AntiOverfit PRO は、MetaTrader 5 の Expert Advisor が本当にしっかりしているのか、それとも特定の過去データにたまたまうまくはまっているだけなのかを確
Limited time offer: 20% off for a few days only!  - Annual subscription $360 instead of $450  - Lifetime plan $550 instead of $690 The core idea: using the user interface, you configure the parameters the chart must meet before entering a position (or positions), choose which entry models to use, and set the rules for when trading and planning should end. Lazy Trader  handles the rest: it  takes over all the routine chart watching and execution! full description  :: 3 key videos [1] ->  [2]   -
Trade Assistant 38 in 1
Makarii Gubaydullin
4.91 (23)
多機能ツール:ロット計算、グリッド注文、R/R比率、トレードマネージャー、サプライ&デマンドゾーン、プライスアクションなど デモ版   |   ユーザーマニュアル トレードアシスタント   はストラテジーテスターでは動作しません :   こちらからデモ版をダウンロード  して ユーティリティ をテストできます。 ご質問、改善のご提案、バグ発見の場合は ご連絡ください MT4版が必要な場合は こちら から入手できます トレード   プロセス を簡素化、高速化、自動化。   ダッシュボード で標準端末の機能を拡張。 トレードパネルは  あらゆる取引商品で動作:外国為替、株式、インデックス、暗号通貨など。 1. 新規トレードの実行 :ロット / リスク / R/R計算 :手動トレードのためのリスク管理 ロット計算機(リスクサイズに基づく取引量計算) リスク計算機(ロットサイズに基づくリスク額) リスクリワード   比率 グリッド注文:  + 動的間隔オプション、スプリットロットオプション 注文のアクティベーショントリガー、+ バイストップリミット / セルストップリミット 仮想SL、仮想
HINN MAGIC ENTRY – the ultimate tool for entry and position management! Place orders by selecting a level directly on the chart! full description   ::  demo-version  :: 60-sec-video-description Key features: - Market, limit, and pending orders - Automatic lot size calculation - Automatic spread and commission accounting - Unlimited partitial take-profits  - Breakeven and trailing stop-loss and take-profit  functions - Invalidation leves - Intuitive, adaptive, and customizable interface - Works
Poc Breakout Signal: The Ultimate Institutional Order Flow & Price Action System Elevate your trading with Poc Breakout, a comprehensive technical analysis tool designed to bridge the gap between retail trading and institutional market understanding. This all-in-one system combines powerful Buy/Sell signals, advanced Volume Profile analysis, real-time Order Flow (Depth of Market), and critical macroeconomic data to give you a clear, unambiguous edge in the markets. Poc Breakout Signal decodes c
TelegramからMT5へ: 究極のシグナルコピーソリューション Telegram to MT5 を使えば、取引がシンプルになります。DLL を必要とせず、Telegram のチャンネルやチャットから MetaTrader 5 プラットフォームに取引シグナルを直接コピーできる最新ツールです。この強力なソリューションは、正確なシグナル実行、豊富なカスタマイズオプション、時間の節約、そして効率性の向上を実現します。 [ Instructions and DEMO ] 主な特徴 直接的なTelegram API統合 電話番号とセキュアコードで認証します。 ユーザーフレンドリーな EXE ブリッジを通じてチャット ID を簡単に管理できます。 複数のチャネル/チャットを追加、削除、更新して、同時に信号をコピーします。 高度なフィルターによる信号解析 例外的な単語 (例: 「レポート」、「結果」) を含む不要な信号をスキップします。 柔軟な SL および TP 形式 (価格、ピップ、ポイント) をサポートします。 価格ではなくポイントを指定するシグナルのエントリ ポイントを自動的に計算します。
Custom Alerts:複数市場を監視し、重要なチャンスを見逃さない 概要 Custom Alerts は、複数の銘柄にまたがるトレードチャンスを一元的に監視したいトレーダーのためのダイナミックなソリューションです。FX Power、FX Volume、FX Dynamic、FX Levels、IX Power などの主要ツールと連携し、複数のチャートを切り替える手間なく、重要な市場変動を自動で通知します。ブローカーが提供するすべての資産クラスに対応しており、シンボルを入力する必要はありません。設定で資産クラスを選択するだけで、すぐにアラートを構成できます。 1. Custom Alerts がトレーダーにとって非常に有益な理由 オールインワンの市場監視 • Custom Alerts は、為替、金属、暗号資産、指数、株式(ブローカーが対応している場合)からのシグナルを収集・統合します。 • 複数のチャートを切り替える必要がなくなり、明確で一元化された通知が得られます。 戦略に合わせたアラート構成 • ボリューム急増、通貨強弱の閾値、極端な価格変動など、目的に応じたアラート
Grid Manual MT5
Alfiya Fazylova
4.9 (21)
「Grid Manual」は、注文のグリッドを操作するための取引パネルです。 ユーティリティはユニバーサルで、柔軟な設定と直感的なインターフェイスを備えています。 それは、損失を平均化する方向だけでなく、利益を増やす方向でも注文のグリッドで機能します。 トレーダーは注文のグリッドを作成して維持する必要はありません。 すべてが「Grid Manual」によって行われます。 注文を開くだけで十分であり、「Grid Manual」は注文のグリッドを自動的に作成し、非常に閉じるまでそれに付随します。 完全な説明とデモバージョン ここ。 ユーティリティの主な機能と機能 ユーティリティは、モバイル端末から開かれた注文を含め、あらゆる方法で開かれた注文を処理します。 「制限」と「停止」の2種類のグリッドで機能します。 グリッド間隔の計算には、固定と動的(ATRインジケーターに基づく)の2つの方法で機能します。 オープンオーダーグリッドの設定を変更できます。 チャート上の各注文グリッドの損益分岐点を表示します。 各注文グリッドの利益率を表示します。 ワンクリックでグリッドから収益性の高い注文を閉じるこ
Trader Evolution
Siarhei Vashchylka
5 (7)
" Trader Evolution " - A utility designed for traders who use wave and technical analysis in their work. One tab of the utility is capable of money management and opening orders, and the other can help in making Elliott wave and technical analysis. Manual (Be sure to read before purchasing) | Version for MT4 Advantages 1. Trading in a few clicks. Immediate and pending orders are available in the panel 2. Money management. The program automatically selects the appropriate lot size 3. Simplifies
EA Auditor
Stephen J Martret
5 (1)
EA AUDITOR — EA and Signal Verification Tool for MetaTrader 5 EA Auditor is an independent analysis tool for traders evaluating Expert Advisors and trading signals on MetaTrader 5. It audits backtest reports, reviews posted developer signals, and cross-verifies the two against each other to help traders assess strategies before committing capital. The MQL5 market offers a wide range of Expert Advisors from many developers, with varying approaches, quality, and transparency. EA Auditor provides a
Trade Manager は、リスクを自動的に計算しながら、取引を迅速に開始および終了するのに役立ちます。 過剰取引、復讐取引、感情的な取引を防止する機能が含まれています。 取引は自動的に管理され、アカウントのパフォーマンス指標はグラフで視覚化できます。 これらの機能により、このパネルはすべてのマニュアル トレーダーにとって理想的なものとなり、MetaTrader 5 プラットフォームの強化に役立ちます。多言語サポート。 MT4バージョン  |  ユーザーガイド + デモ Trade Manager はストラテジー テスターでは機能しません。 デモについてはユーザーガイドをご覧ください。 危機管理 % または $ に基づくリスクの自動調整 固定ロットサイズを使用するか、ボリュームとピップに基づいた自動ロットサイズ計算を使用するオプション RR、Pips、または価格を使用した損益分岐点ストップロス設定トレーリングストップロス設定 目標に達したときにすべての取引を自動的に終了するための 1 日あたりの最大損失 (%)。 過度のドローダウンからアカウントを保護し、オーバートレードを防ぎます
Ultimate Extractor - Professional Trading Analytics for MT5 *****this is the local HTML version of Ultimate Extractor. !!!!!it is not compatible with Cloud!!!! For the online version please reach out to me directly****** Ultimate Extractor transforms your MetaTrader 5 trading history into actionable insights with comprehensive analytics, interactive charts, and real-time performance tracking. What It Does Automatically analyzes your MT5 trading history across all Expert Advisors and generates
作者のその他のプロダクト
1. Why did I develop this series of indicators I found that most traders need to use multiple time frame indicators. They usually switch time frame to see indicators. However, once the timeframe is switched, you cannot see the  corresponding relationship  between  the price in the smaller timeframe  and  the indicator in the larger timeframe . For example: if your price chart is in H1 timeframe, you can see H4, D1 and W1 indicators in H1 timeframe Chart. This is more helpful for you to find th
This product can be used to synchronize multiple Charts, and each Chart can be set to a different sync mode. With this product you can better view and manipulate charts: different time frames for a single Symbol, the same time frame for multiple Symbols... and more. PS: The link below is the FreeDemo product, you can use it on EURUSD/XUAUSD/USDCNH symbol: https://www.mql5.com/en/market/product/38557 Feature: Chart settings  can be synchronized, including : background, indentation, size, etc. M
This product can be used to synchronize multiple Charts, and each Chart can be set to a different sync mode. With this product you can better view and manipulate charts: different time frames for a single Symbol, the same time frame for multiple Symbols, system indicators for single/multiple Symbols... and more. Feature: Chart settings can be synchronized, including : background, indentation, size, etc. Multiple Chart window start times  or end times can be synchronized. Multiple Chart time fr
Have you ever take a long time to watch a Symbol when the network link is not good ? Have you ever wait for a long time when you switch chart between different Symbols or different TimeFrames ? If you do long-term backtesting , Have you ever to be downloaded datas for a long time ? Yes, If there is no data in the system, those will happen.  1. What is this: Download all the Symbol data in Market Watch to the system. PS: This is not outputting data to Files. This Link go to Demo version: https:/
Do you think it's a bit cumbersome when you need to switch symbols or timeframes with mouse click? 1. What is this? This is a program that can switch symbols and timeframes with direction keys. Fast switching, very convenient, no mouse click required. For traders, one symbol with multi-timeframe charts are usually added,  you can change symbol on those charts easily. For multi-currency traders, different symbol charts are usually added, you can also change those timeframes easily. I wrote this p
1. What is this         Rising volatility and falling volatility are not the same, whether it is academic research or actual testing has shown this point.         The original ATR indicator is calculated by putting up and down fluctuations together. This indicator is to calculate separately the upward volatility and the downward volatility, which can better help you study the market. 2. Indicator description          There are two modes for the calculation of this indicator, as shown in the fo
I see that many tools in the market deal with Position and Order in the form of operation panels. Which is loaded into a Chart in the form of an EA. However, once the operator panel EA is loaded, no other EAs can be loaded. So, I wrote the one-click operation of Position and Order as a script, so you can load other EAs and easily complete one-click operation of Trade. 1. What is this: This is a one-click script to close position order. Now you can close position tickets at high speed, for examp
Do you think it's a bit cumbersome when you need to switch symbols or timeframes with mouse click? 1. What is this? This is a program that can switch symbols and timeframes with direction keys. Fast switching, very convenient, no mouse click required. For traders, one symbol with multi-timeframe charts are usually added,  you can change symbol on those charts  easily . For multi-currency traders, different symbol charts are usually added, you can also change those timeframes easily. I wrote thi
According to trading experience: Some symbols are easy to reverse on certain days, such as Monday, or afternoon, and so on. So comparing the current price with the corresponding historical moment price is valuable. If the price coordinate system uses a logarithmic price, you will get a lot of valuable information. 1. What is this? This program can convert the symbol price and add it to your Chart. You can compare it with your major chart. The DEMO version Link: https://www.mql5.com/en/market/pr
What is this: Violent trading: means sending a large number of orders to your brokerage server,  it can conduct a stress test of the trading. In this program you can run a variety of trading tests.  Now you can trade at high speed, For example 1000 orders in an instant. The Demo version's link:  https://www.mql5.com/en/market/product/38431/ Why to use: Whether manual trading or EA trading,  the status of the broker server is very important. So it is beneficial to conduct a trading stress test on
1. Why did I develop this series of indicators I found that most traders need to use multiple time frame indicators. They usually switch time frame to see indicators. However, once the timeframe is switched, you cannot see the  corresponding relationship  between  the price in the smaller timeframe  and  the indicator in the larger timeframe . For example: if your price chart is in H1 timeframe, you can see H4, D1 and W1 indicators in H1 timeframe Chart. This is more helpful for you to find th
フィルタ:
削除済み 2019.02.14 14:59 
 

ユーザーは評価に対して何もコメントを残しませんでした

削除済み 2019.02.14 14:08 
 

ユーザーは評価に対して何もコメントを残しませんでした

レビューに返信