Smart DOM Driver

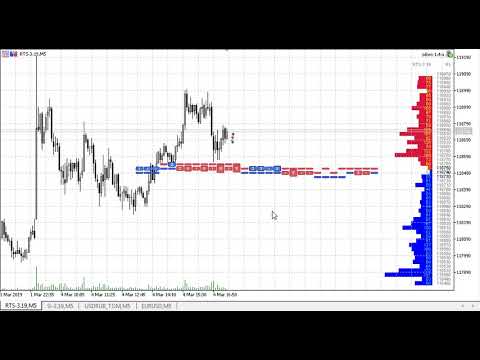
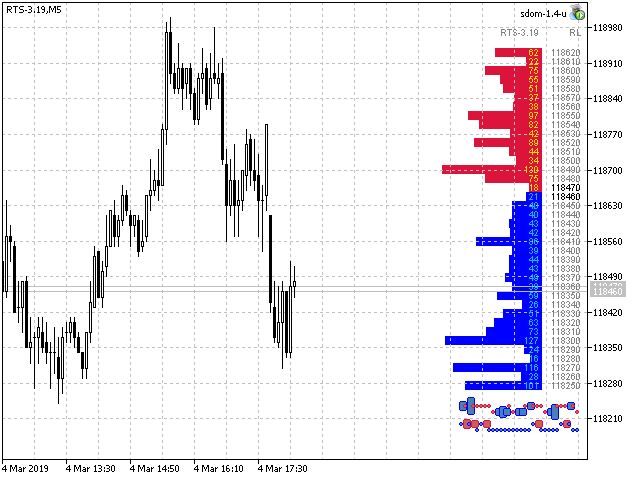
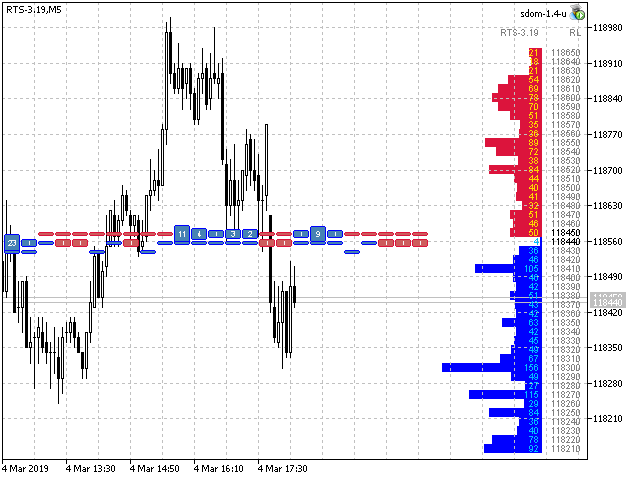
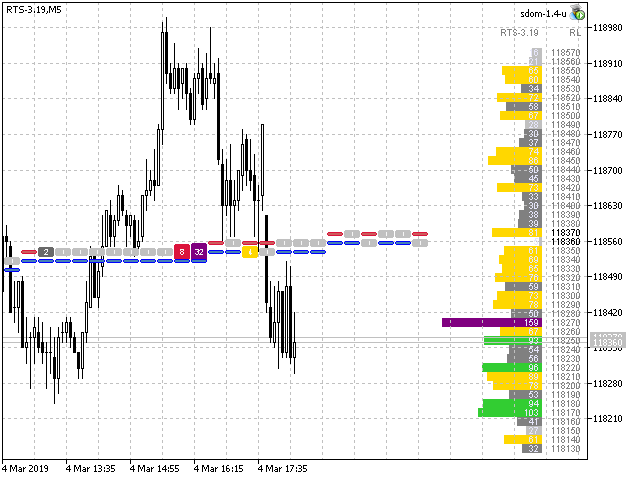
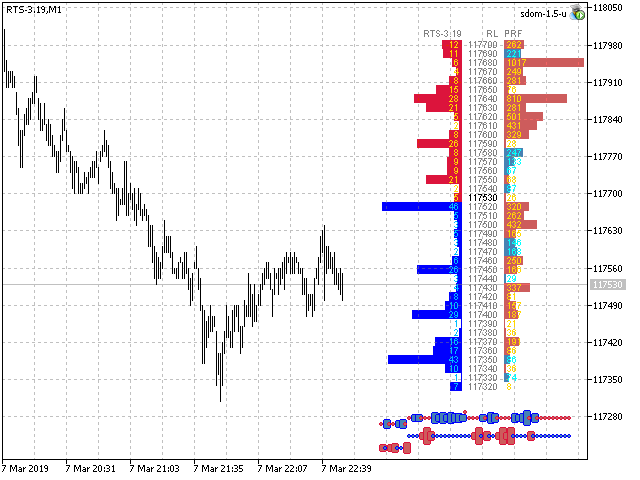
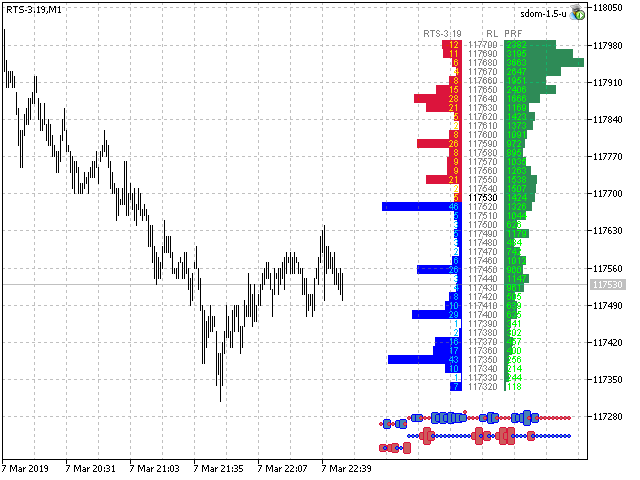
The utility displays the order book, as well as increases its depth, remembering the location of applications that have gone beyond the current "window" view.

With the utility user can perform quick trading actions in one click - placing/cancelling/editing of explicit and hidden orders, and also opening/editing positions.


Utility features

The orders book display works only on those trading symbols for which it is broadcast by the broker.

To reset the information about the rows that were recorded in the Smart mode, switch the indicator to the Fixation mode and double-click on the orders book title.

For currency pairs, as a rule, the deals tape is not broadcast, so the input variable ProfileCalculation must be switched to the Interpretation state. In addition, it is desirable to use the input variable RowsUnite, which groups the rows by a specified number of points (for example, ten).

Hidden orders are not sent to the broker's server, but are stored directly in the utility's memory, and are triggered as direct deals at the touch of the declared price. Therefore, when using HideOrders modes, especially ExitType, a stable connection with the broker server is required.

Due to the specifics of the displayed data, the utility can not work as a trial version, and can not be tested in the strategy tester.


Input variables

A description of the input variables is attached on the "Comments" tab in post 21 of 26.11.2021.


おすすめのプロダクト
The Mirror Chart MT5 is a overlay indicator specifically designed to project a second financial instrument directly onto the main chart window. This tool is invaluable for traders who rely on correlation analysis, as it visualizes the price movements of two different instruments in real time. Unlike traditional overlays, this indicator utilizes intelligent, dynamic centering and scaling logic. It continuously analyzes the visible price range in the current window for both symbols and calculates
FREE
This utility is designed to automatically maintain a "locking" position and reopen it when necessary, which is suitable for position maintenance and protection strategies. A simple utility (hereinafter referred to as the bot) that implements a locking strategy with an infinitely reloadable locking trade. How the bot works: - When launched, select a buy or sell order with a specified TP - Set the SL parameter for the locking trade - The bot monitors the distance between the opening price of the f
VM Auto SLTP Basic - Intelligent Trade Management for Scalpers Enhance your scalping strategy to a higher level. VM Auto SLTP Basic automatically manages Stop Loss and Take Profit for orders that are opened manually or by other Expert Advisors. This tool does not open trades on its own, allowing you to maintain full control while enjoying precise risk management. Key Features SL/TP based on ATR or fixed price Automatic SL move to Breakeven Risk management as a percentage of account balance Suppo
FREE
Forex Volume MT5
KEENBASE SOFTWARE SOLUTIONS
KT Forex Volumeは、通貨ペアの買いと売りのボリュームをカラーのヒストグラムで表示します。ボリュームとは、資産の買い取引と売り取引の総量を指します。 FX市場では: 買いのボリュームが売りのボリュームを上回ると、通貨ペアの価格は上昇する傾向があります。 売りのボリュームが買いのボリュームを上回ると、通貨ペアの価格は下落する傾向があります。 特徴 ティックボリュームのデータを用いてトレードを確認することで、不利な取引を回避できます。 大口トレーダーの流れに沿ったトレードを支援します。 すべてのMetaTraderアラートに対応しています。 ティックボリュームの活用 他の市場と異なり、スポットFX市場は中央集権化されていないため、リテールトレーダーにとって正確な取引ボリュームデータを得るのは困難です。 ベテランのFXトレーダーであるCaspar Marneyは2011年に論文を発表し、ティックボリュームと実際の取引ボリュームとの間に高い相関と精度があると結論付けました。 ヒストグラムの計算式 KT Forex VolumeインジケーターはChaikinオシレーターを基にし
The market is unfair if only because 10% of participants manage 90% of funds. An ordinary trader has slim changes to stand against these "vultures". This problem can be solved. You just need to be among these 10%, learn to predict their intentions and move with them. Volume is the only preemptive factor that faultlessly works on any timeframe and symbol. First, the volume appears and is accumulated, and only then the price moves. The price moves from one volume to another. Areas of volume accumu
Time and Sales Tick
Pablo Filipe Soares De Almeida
Time & Sales Tick Indicator は、MetaTrader 5チャート上でリアルタイムのティック情報を表示するインジケーターです。 価格、ティック出来高、時刻を視覚的に確認でき、市場の動きを細かく分析することが可能です。 機能 価格、出来高、時間を含むティックデータをチャート上の専用パネルにリアルタイム表示します。 ティックをユーザーが設定した間隔でグループ化し、上昇ティックは緑色、下降ティックは赤色で色分け表示します。 パネルはチャートの4隅の任意の位置に配置でき、サイズや透明度の調整も可能です。 MetaTrader 5のすべてのシンボルおよびタイムフレームで使用可能で、軽量かつ安定した動作を実現しています。 このインジケーターは、スキャルピングや短期分析に特に適しています。
A sophisticated recovery system designed to systematically dismantle large, losing hedged positions and "fragment" them into small, profitable exits. Unlike standard grid EAs, this system uses a Bank-per-Closure model and an Integrated Hedge Commander to ensure your account remains 100% balanced while it works to reclaim your equity. How the EA Works (The Logic) The Recovery Grid Fragmentation EA operates on three core pillars: 1. The Integrated Hedge Commander The EA continuously monitors your
Candle Strength Oscillator
Murtadha Majid Jeyad Al-Khuzaie
5 (1)
Candle Pressure Index (CPI) is a powerful yet easy-to-use indicator designed to reveal the hidden buying and selling pressure behind every candle. Instead of simply showing whether the price moved up or down, CPI digs deeper into how strongly buyers or sellers controlled the market within each candle. This makes it a unique tool for identifying trend strength, spotting reversals early, and confirming entry or exit points with higher accuracy. Unlike traditional oscillators that only react to p
FREE
Volume Profile Density V2.40 価格ごとの出来高分布を表示し、機関投資家が注目する価格帯を明らかにします。 時間軸ベースの出来高とは異なり、どこで取引量が集中したかを示します。 基本概念: 水平バー = 各価格の取引量 バーが長いほど出来高が多い 赤いゾーン = 主要なサポート/レジスタンス 主な用途: 実際のサポート・レジスタンスの特定 POC(コントロールポイント) の確認 バリューエリア(総出来高の70%) の定義 低出来高ゾーンをストップやターゲットに利用 カラーガイド: 青 = 低出来高(価格が素早く通過) 黄 = 中程度の出来高(バランスゾーン) 赤 = 高出来高(機関ゾーン) トレード戦略: 赤ゾーンでの反発買い VAHまたは赤ゾーンでの拒否売り 出来高を伴うPOCブレイクで参入 POCへの戻りでエントリー 青ゾーンを目標に設定 設定: 初心者: 1.0 / 100% / 1.0 スキャルピング: 0.5 / 200% / 0.5 スイング: 2.0 / 50% / 1.5 技術情報: バージョン: 2.40 プラットフォーム: MT5 対応資産
FREE
Горячие клавиши плюс клик левой кнопки мыши на графике. Советник открывает сделки, выставляет лимитные и стоповые ордера, удаляет ордера и закрывает позиции, также  делает реверс  открытых позиций, выставляет прописанные в настройках стоп лосс и тейк профит. (реверс только на неттинговых счетах) При запуске советника можно посмотреть подсказку как действует советник при нажатии клавиши + клик на графике. Правее последнего бара, ниже цены Ctrl+ЛКМ  - OpenSell Правее последнего бара, выше цены C
Was: $249  Now: $99   Market Profile defines a number of day types that can help the trader to determine market behaviour. A key feature is the Value Area, representing the range of price action where 70% of trading took place. Understanding the Value Area can give traders valuable insight into market direction and establish the higher odds trade. It is an excellent addition to any system you may be using. Inspired by Jim Dalton’s book “Mind Over Markets”, this indicator is designed to suit the
Expansoes M
Marcus Vinicius Da Silva Miranda
The M Extensions are variations of the Golden Ratio (Fibonacci Sequence). It is the World's first technique developed for Candle Projections. Advantages: Easy to plot. Candle anchoring; High and accurate precision as support and resistance; Excellent Risk x Return ratio; Works in any timeframe; Works in any asset / market.   The M Extensions are classified into: M0: Zero point (starting candle) RC: Initial candle control region M1: Extension region 1 M2: Extension region 2 M3: Extension regi
FREE
The indicator analyzes the volume scale and splits it into two components - seller volumes and buyer volumes, and also calculates the delta and cumulative delta. The indicator does not flicker or redraw, its calculation and plotting are performed fairly quickly, while using the data from the smaller (relative to the current) periods. The indicator operation modes can be switched using the Mode input variable: Buy - display only the buyer volumes. Sell - display only the seller volumes. BuySell -
FREE
Order Book, known also as Market Book, market depth, Level 2, - is a dynamically updated table with current volumes of orders to buy and to sell specific financial instument at price levels near Bid and Ask. MetaTrader 5 provides the means for receiving market book from your broker, but in real time only, without access to its history. The indicator OrderBook Cumulative Indicator accumulates market book data online and visualizes them on the chart. In addition, the indicator can show the market
Value Chart Candlesticks
Flavio Javier Jarabeck
4.69 (13)
The idea of a Value Chart indicator was presented in the very good book I read back in 2020 , " Dynamic Trading Indicators: Winning with Value Charts and Price Action Profile ", from the authors Mark Helweg and David Stendahl. The idea is simple and the result is pure genius: Present candlestick Price analysis in a detrended way! HOW TO READ THIS INDICATOR Look for Overbought and Oversold levels. Of course, you will need to test the settings a lot to find the "correct" one for your approach. It
FREE
Wapv Price and volume
Eduardo Da Costa Custodio Santos
MT5のWAPV価格と出来高インジケーターは、(Wyckoff Academy Wave Market)および(Wyckoff Academy Price and Volume)ツールセットの一部です。 MT5のWAPV価格および出来高インジケーターは、チャート上の出来高の動きを直感的な方法で簡単に視覚化できるように作成されました。 それを使用すると、ピークボリュームの瞬間と市場が専門家の関心を持たない瞬間を観察することができます 「スマートマネー」の動きではなく、慣性によって市場が動いている瞬間を特定します。 ユーザーが変更できる4色で構成されています。 赤=オファーの増加 緑=需要の増加 灰色のキャンドル=需要と供給の減少 青=スマートマネー演技 上方向への動きは強さを示します。 下向きの動き弱さを示します。 価格の方向に関係なく、最強のボリュームが上がる必要があります。 R.Wyckoffの理論に基づいて作成されたインジケーター
概要 このインジケーターは、クラシックな ドンチャンチャネル を強化したバージョンで、実践的なトレード機能を追加しています。 標準の3本線(上限、下限、中央線)に加え、 ブレイクアウト を検出し、チャート上に矢印で視覚的に表示します。また、チャートを見やすくするために、 現在のトレンド方向と逆側のラインのみを表示 します。 インジケーターの機能: 視覚的シグナル :ブレイクアウト時にカラフルな矢印を表示 自動通知 :ポップアップ、プッシュ通知、Eメール RSIフィルター :市場の相対的な強弱に基づいてシグナルを検証 カスタマイズ可能 :色、ラインの太さ、矢印コード、RSI閾値など 動作原理 ドンチャンチャネルは次のように計算します: 上限線 :直近N本のクローズ済みローソク足の最高値 下限線 :直近N本のクローズ済みローソク足の最安値 中央線 :最高値と最安値の平均値 上方ブレイクアウト は終値が上限線を超えたときに発生し、 下方ブレイクアウト は終値が下限線を下回ったときに発生します。 インジケーターは以下を行います: 3本のドンチャンラインを描画 方向転換後の最初のブレイクアウト
FREE
Fvg Edge
Ahmad Meftah Abdulsalam Alawwami
5 (1)
FVG Smart Zones – 無料版 MetaTrader 5 (MT5)用 公正価値ギャップ(FVG)検出インジケーター ただのランダムなインジケーターではなく、 本格的なトレーディングツール をお探しですか? FVG Smart Zones – 無料版 は、公正価値ギャップ(FVG)を自動で検出し、チャート上に 高確率トレーディングゾーン をハイライトして、プロフェッショナルな市場の洞察を提供します。 以下のトレーダー向けに設計されています: スマートマネーコンセプト (SMC) ICTトレーディングコンセプト プライスアクション (Price Action) 需給分析 (Supply & Demand) 機関投資家向けトレーディング戦略 このインジケーターは、 価格が反応しやすいゾーン に集中するのを助けます。 主な機能 スマートゾーン検出 上昇・下降FVGの自動検出 クリーンでプロフェッショナルなビジュアルゾーン 弱い、または関連性の低いギャップを除去するインテリジェントフィルター 高度な確認機能 上位時間軸(HTF)
FREE
The Supply and Demand Zone Indicator is a powerful and easy-to-use tool designed to help traders identify critical supply and demand zones on the chart. These zones can provide valuable insight into potential market reversals, breakouts, and important price levels where buyers or sellers are likely to take control. The best   FREE Trade Manager . If you want to create your own Hedging or Grid strategies without any coding make sure to check out the   ManHedger Key Features: Automatic Zone Detect
FREE
Weis Waves
Flavio Javier Jarabeck
2.83 (18)
The original author is David Weis, an expert in the Wyckoff Method. The Weis Wave is a modern adaptation of the 1930's Wyckoff Method, another expert in Tape Reading techniques and Chart Analysis. Weis Waves takes market volume and stacks it into waves according to price conditions giving the trader valuable insights about the market conditions. If you want to learn more about this subject you can find tons of videos in YouTube. Just look for "The Wickoff Method", "Weis Wave" and "Volume Spread
FREE
This indicator sums up the difference between the sells aggression and the buys aggression that occurred in each Candle, graphically plotting the waves of accumulation of the aggression volumes.   Through these waves an exponential average is calculated that indicates the direction of the business flow. Note: This indicator DOES NOT WORK for Brokers and/or Markets WITHOUT the type of aggression (BUY or SELL).   Be sure to try our Professional version with configurable features and alerts:  Agre
FREE
Order Book, known also as Market Book, market depth, Level 2, - is a dynamically updated table with current volumes of orders to buy and to sell specific financial instument at price levels near Bid and Ask. MetaTrader 5 provides the means for receiving market book from your broker, but in real time only, without access to its history. This expert adviser OrderBook History Playback allows you to playback the market book events on the history using files, created by OrderBook Recorder . The exper
FREE
The indicator calculates ZigZag using the classic algorithm with three parameters: Depth, Deviation, and Backstep. Its main function is detecting and visualizing repaints — moments when the last ZigZag point shifts to a new bar. Upon loading, the indicator performs a simulation over the specified history depth. The algorithm sequentially recalculates ZigZag for each bar, comparing the current position of the last point with the previous one. If a shift is detected, a repaint line appears on the
FREE
Order Book, known also as Market Book, market depth, Level 2, - is a dynamically updated table with current volumes of orders to buy and to sell specific financial instument at price levels near Bid and Ask. MetaTrader 5 provides the means for receiving market book from your broker in real time. The expert OrderBook Recorder records market book changes and stores them in local files for further usage in indicators and expert adviser, including testing in the tester. The expert stores market book
FREE
Market Profile 3 ForexArby com
Hussien Abdeltwab Hussien Ryad
4 (15)
Market Profile 3 MetaTrader 5 indicator  version 4.70— is a classic Market Profile implementation that can show the price density over time, outlining the most important price levels, value area, and control value of a given trading session. This indicator can be attached to timeframes between M1 and D1 and will show the Market Profile for daily, weekly, monthly, or even intraday sessions. Lower timeframes offer higher precision. Higher timeframes are recommended for better visibility. It is als
FREE
Making Charting simple! The Support/Resistance EA combines a sophisticated neural network algorithm with an Average Range computation to make your supply and demand zones easy to spot! The EA is very easy to use and can save you valuable time when charting through financial instruments. Areas of consolidation are highlighted according to your preference and timeframe, making it easier to identify areas of break-out or small regions to scalp.  Features :  Choose two Timeframes (From 1 Minute up
Candle Countdown Timer MT5
AL MOOSAWI ABDULLAH JAFFER BAQER
キャンドル・カウントダウン・タイマー – 市場の一歩先を行こう 現在のローソク足が閉じるまでの残り時間を知りたいと思ったことはありませんか?トレードではタイミングがすべてです。 キャンドル・カウントダウン・タイマー は、戦略を正確に実行したいトレーダーに最適なツールです。スキャルピング、デイトレード、スイングトレードのいずれを行う場合でも、このツールがあれば重要な瞬間を逃しません。 キャンドル・カウントダウン・タイマーとは? MT4用の軽量かつ高度なツール で、現在のローソク足が閉じるまでの残り時間を表示します。エントリーやエグジットを正確に計画できるよう、リアルタイムで自動更新され、常に最新の情報を提供します。 動作の仕組み リアルタイムのカウントダウン 現在のローソク足の開始時間を追跡し、閉じるまでの残り時間を秒単位で計算 新しいローソク足が形成されると、自動的にリセット 色分けされたアラート機能 ローソク足の閉じるタイミングが近づくと、表示ラベルの色が変わり注意を促します 緑 – 十分な時間が残っています 黄 – 注意:ローソク足がもうすぐ閉じます 赤 – 緊急:ローソク足がまも
AP Session Boxes — Asian / London / NY Range Overlay (MT5 Indicator) Clean session boxes on your chart. This lightweight indicator draws the   Asian ,   London , and   New York   time windows directly on the chart, including each box’s   high   and   low   as dashed lines. It’s perfect for quick context, breakout planning, and clean screenshots. Instant structure:   See where the market ranged during key sessions. Breakout prep:   Use the hi/lo lines as reference for pending orders or alerts fr
FREE
Haven Volume Profileは、取引量の分布に基づいて重要な価格レベルを識別するための多機能なボリュームプロファイル分析インジケーターです。市場をより深く理解し、重要なエントリーポイントとエグジットポイントを特定したいプロのトレーダー向けに設計されています。 その他の製品 ->  こちら 主な機能: Point of Control (POC) 計算 - 最大の取引活動が行われるレベルで、最も流動性の高いレベルを特定するのに役立ちます Value Area(高い活動の領域)の定義とカスタマイズ可能な取引量の割合で、取引範囲をより正確に評価できます ティックボリュームと実際の取引量の両方に対応し、さまざまな市場タイプや取引戦略に対応しています 計算期間(日数)の柔軟な設定により、任意の時間枠にツールを適応させることができます ターミナルのライトテーマとダークテーマに自動的に適応し、ユーザーインターフェースの視覚的な体験を向上させます レベルの視覚化が明確で、スタイルや色をカスタマイズでき、グラフ分析と迅速な意思決定を支援します このインジケーターは、重要な価格レベルや統合ゾー
FREE
The Volume Delta Indicator is a technical analysis tool that combines volume analysis with price action to identify potential trading opportunities. This indicator analyzes the difference between buying and selling pressure through candle structure analysis. Key Features Volume Delta Calculation : Measures buy/sell volume difference using candle structure analysis EMA Smoothing : Applies exponential moving average to smooth volume data Breakout Detection : Identifies price breakouts with volume
FREE
このプロダクトを購入した人は以下も購入しています
Trade Assistant MT5
Evgeniy Kravchenko
4.42 (208)
取引 ごとのリスクの 計算、新規注文 の 簡単 な 設置、部分的 な 決済機能 を 持 つ 注文管理、 7 種類 のトレーリングストップなど 、便利 な 機能 を 備 えています 。 追加の資料と説明書 インストール手順   -   アプリケーションの手順   -   デモアカウント用アプリケーションの試用版 ライン機能 チャート上にオープニングライン、ストップロス、テイクプロフィットを表示します。この機能により、新規注文を簡単に設定することができ、注文を出す前にその特徴を確認することができます。   リスク計算 リスク計算機能は、設定されたリスクとストップロス注文のサイズを考慮して、新規注文のボリュームを計算します。ストップロスの大きさを自由に設定できると同時に、設定したリスクを守ることができます。 Lot calc ボタン - リスク 計算 を 有効 / 無効 にします 。 Risk フィールドでは 、必要 なリスクの 値 を 0 から 100 までのパーセンテージまたは 預金通貨 で 設定 します 。 設定」 タブで 、 リスク 計算 の 種類 を 選択 します :「 $ 通
Trade Manager EAへようこそ。これは、取引をより直感的、正確、そして効率的にするために設計された究極の リスク管理ツール です。これは単なるオーダー実行ツールではなく、包括的な取引計画、ポジション管理、リスク管理のためのソリューションです。初心者から上級者、迅速な実行を必要とするスキャルパーまで、Trade Manager EAはあらゆるニーズに対応し、為替、指数、商品、暗号通貨などさまざまな市場で柔軟に対応します。 Trade Manager EAを使用すると、複雑な計算が過去のものになります。市場を分析し、エントリーポイント、ストップロス、テイクプロフィットのレベルをチャート上のラインでマークし、リスクを設定するだけで、Trade Managerが最適なポジションサイズを即座に計算し、SLとTPをピップ、ポイント、口座通貨でリアルタイムに表示します。すべての取引が簡単かつ効果的に管理されます。 主な機能: ポジションサイズ計算機 :定義されたリスクに基づいて取引サイズを瞬時に決定します。 簡単な取引計画 :エントリー、ストップロス、テイクプロフィットを設定するためのド
Local Trade Copier EA MT5
Juvenille Emperor Limited
4.96 (126)
Local Trade Copier EA MT5 による、驚くほど高速な取引コピーを体験してください。1分で簡単にセットアップできるこの取引コピー機は、同じWindowsコンピュータまたはWindows VPS上の複数のMetaTrader端末間で取引をコピーすることができ、0.5秒未満の高速コピースピードを実現します。 初心者であろうとプロのトレーダーであろうと、 Local Trade Copier EA MT5 には、あなたの特定のニーズに合わせてカスタマイズするための幅広いオプションが用意されています。これは、利益の可能性を高めたい人にとって究極のソリューションです。 今すぐ試してみて、これが市場で最も速くて簡単なトレードコピー機である理由を理解してください。 ヒント: デモアカウントで Local Trade Copier EA MT5 デモバージョンをダウンロードして試すことができます: ここ ダウンロードした無料のデモ ファイルを MT5 >> ファイル >> データ フォルダを開く >> MQL5 >> Experts フォルダに貼り付けて、ターミナルを再起動しま
TradePanel MT5
Alfiya Fazylova
4.86 (148)
Trade Panel は、多機能の取引アシスタントです。このアプリケーションには手動取引用の 50 を超える取引機能が含まれており、ほとんどの取引操作を自動化できます。 注意、アプリケーションはストラテジー テスターでは動作しません。購入する前に、デモアカウントでデモ版をテストできます。デモ版 ここ 。 完全な手順 こちら 。 取引。 ワンクリックで取引操作を実行できます: 自動リスク計算を使用して未決の注文とポジションをオープンします。 ワンクリックで複数の注文とポジションをオープンします。 注文グリッドを開きます。 未決の注文とポジションをグループごとにクローズします。 ポジション反転 (買いを閉じて売りを開く、または売りを閉じて買いを開く)。 ポジションをロックします(買いポジションと売りポジションの量を均等にする追加のポジションをオープンします)。 ワンクリックですべてのポジションを部分的にクローズします。 すべてのポジションのテイクプロフィットとストップロスを同じ価格レベルに設定します。 すべてのポジションのストップロスをポジションの損益分岐点レベルに設定します。 注文とポ
Tired of complex order placement and manual calculations? Trade Dashboard is your solution. With its user-friendly interface, placing orders becomes effortless, by a single click, you can open trades, set stop loss and take profit levels, manage trade lot size, and calculate risk to reward ratios, allowing you to only focus on your strategy. Say goodbye to manual calculations and streamline your trading experience with Trade Dashboard. Download  Demo Version  right now. You can find  Details of
ベータリリース Telegram to MT5 Signal Trader はまもなく正式なアルファ版をリリースします。いくつかの機能はまだ開発中で、小さな不具合に遭遇する可能性があります。問題が発生した場合はぜひご報告ください。皆さまのフィードバックがソフトウェア改善に役立ちます。 Telegram to MT5 Signal Trader は、 Telegram のチャンネルやグループからの取引シグナルを自動的に MetaTrader 5 にコピーする強力なツールです。 パブリックおよびプライベートの両方のチャネルに対応し、複数のシグナル提供元を複数のMT5口座に接続可能です。ソフトウェアは高速で安定し、すべての取引を細かく制御できます。 インターフェースは直感的で、ダッシュボードとチャートは見やすく設計されており、リアルタイムで動作状況をモニターできます。 必要環境 MQL の制限により、EA は Telegram と通信するためのデスクトップアプリが必要です。 インストーラーは公式の インストールガイド にあります。 主な機能 マルチプロバイダー: 複数の Telegram
MarketCoach Panel — инструмент дисциплины и контроля риска для трейдера MarketCoach Panel — это вспомогательная панель для MetaTrader 5, разработанная для повышения дисциплины в торговле, контроля риска и принятия более осознанных решений. Приложение не совершает сделки и не является торговым советником. Оно помогает трейдеру анализировать текущую ситуацию и соблюдать собственные правила стратегии. Основные возможности • Расчёт лота по риску Автоматический расчёт объёма позиции на основе: проце
Trade copier MT5
Alfiya Fazylova
4.62 (37)
Trade Copierは、取引口座間の取引をコピーして同期するように設計された専門的なユーティリティです。 コピーは、同じコンピューターまたはvps にインストールされている、サプライヤーのアカウント/端末から受信者のアカウント/端末に行われます。 購入する前に、デモ アカウントでデモ バージョンをテストできます。 デモ版 こちら 。 詳細な説明は こちら 。 主な機能と利点: MT5ネッティングアカウントを含む、MT5> MT5、MT4> MT5、MT5> MT4のコピーをサポートします。 高いコピー速度(0.5秒未満)。 ベンダーモードと受信者モードは同じ製品内に実装されています。 チャートから直接リアルタイムでコピーを制御できる、簡単で直感的なインターフェイス。 接続が切断されたり、端末が再起動されたりしても、設定と位置が失われることはありません。 コピーするシンボルを選択できます。また、受信者のシンボルを置き換えることもできます(例:EURUSD> USDJPY)。 バックコピーをサポートします。 特定の注文のみのコピーを有効にする機能。 取引開始価格の最大差と最大遅延時間を
Farmed Hedge Yield Farming - Professional Pair Trading Dashboard (Manual - Hybrid - Semi/Automated EA) VERSION 3 - WILD HARVEST UPDATE Trading Approach: - Manual Trading: Primary focus - Auto Pilot: Optional supplementary feature - Full Automation: Not the main purpose Recommended Timeframe: H1-H4 DEMO VERSION Download the free demo to test functionality. Use Strategy Tester with Visual Mode to see how it works. VERSION 3 - NEW FEATURES Summary Dashboard (SRA Panel) - Quick pair selection w
Trade Manager DashPlus
Henry Lyubomir Wallace
5 (13)
DashPlus は、MetaTrader 5プラットフォーム上での取引効率と効果を向上させるために設計された高度なトレード管理ツールです。リスク計算、注文管理、高度なグリッドシステム、チャートベースのツール、パフォーマンス分析など、包括的な機能を提供します。 主な機能 1. リカバリーグリッド 逆境の市場環境下で取引を管理するための平均化および柔軟なグリッドシステムを実装します。 取引回復のための戦略的なエントリーおよびエグジットポイントを可能にします。 2. スタックグリッド 強い市場の動きの中でポジションを追加することで、有利な取引での潜在的なリターンを最大化するように設計されています。 トレンド市場で利益を得られるよう、勝ち取引を拡大します。 3. 損益(P&L)ライン チャート上に直接、潜在的な利益と損失のシナリオを視覚的に表示します。 設定を調整し、P&Lラインをドラッグして、実行前にさまざまな取引結果を評価します。 4. バスケットモード 同じシンボルでの複数ポジションの管理を簡素化し、それらを単一の集約ポジションにまとめます。 平均価格に基づいて、ストップロスやテイクプ
HINN MAGIC ENTRY – the ultimate tool for entry and position management! Place orders by selecting a level directly on the chart! full description   ::  demo-version  :: 60-sec-video-description Key features: - Market, limit, and pending orders - Automatic lot size calculation - Automatic spread and commission accounting - Unlimited partitial take-profits  - Breakeven and trailing stop-loss and take-profit  functions - Invalidation leves - Intuitive, adaptive, and customizable interface - Works
ApexGuard Suite — профессиональная панель контроля риска и дисциплины для MetaTrader 5 ApexGuard Suite — это комплексный инструмент для трейдеров, который помогает структурировать торговлю, контролировать риски и принимать более взвешенные решения прямо внутри терминала MetaTrader 5. Приложение не совершает сделки за вас — его задача дать полный контроль над состоянием счёта, рисками и торговым процессом в удобном визуальном формате. Интерфейс построен как единая панель с вкладками, где каждая о
TelegramからMT5へ: 究極のシグナルコピーソリューション Telegram to MT5 を使えば、取引がシンプルになります。DLL を必要とせず、Telegram のチャンネルやチャットから MetaTrader 5 プラットフォームに取引シグナルを直接コピーできる最新ツールです。この強力なソリューションは、正確なシグナル実行、豊富なカスタマイズオプション、時間の節約、そして効率性の向上を実現します。 [ Instructions and DEMO ] 主な特徴 直接的なTelegram API統合 電話番号とセキュアコードで認証します。 ユーザーフレンドリーな EXE ブリッジを通じてチャット ID を簡単に管理できます。 複数のチャネル/チャットを追加、削除、更新して、同時に信号をコピーします。 高度なフィルターによる信号解析 例外的な単語 (例: 「レポート」、「結果」) を含む不要な信号をスキップします。 柔軟な SL および TP 形式 (価格、ピップ、ポイント) をサポートします。 価格ではなくポイントを指定するシグナルのエントリ ポイントを自動的に計算します。
PhantomBreak Radar — индикатор для MetaTrader 5, предназначенный для выявления ложных пробоев уровней (fake breakout) и рыночных ловушек. Инструмент помогает трейдерам находить моменты, когда цена прокалывает экстремум диапазона, но затем возвращается обратно — формируя потенциальную точку входа в противоположном направлении. Индикатор автоматически анализирует ценовой диапазон за выбранный период, отслеживает выход за его границы и фиксирует повторный вход цены внутрь диапазона. В таких ситуаци
Только сейчас вы можете приобрести  TradeOps Command Center с 10% скидкой всего за 630$. Акция действует до 01.04.2026 Для получение инструкции об использование утилиты обратитесь в личные сообщения! TradeOps Command Center — Профессиональный инструмент контроля риска и дисциплины в трейдинге TradeOps Command Center — это многофункциональная утилита для MetaTrader 5, разработанная для трейдеров, которые стремятся к системному и дисциплинированному подходу к торговле. Продукт объединяет в себе у
Copy Cat More Trade Copier MT5 (コピーキャット MT5) は、今日の取引課題に対応して設計されたローカルトレードコピーシステムと完全なリスク管理・実行フレームワークです。プロップファームのチャレンジから個人ポートフォリオ管理まで、堅牢な実行、資本保護、柔軟な設定、高度な取引処理の組み合わせで、あらゆる状況に適応します。 コピーシステムはマスター(送信側)とスレーブ(受信側)の両方のモードで動作し、成行注文と指値注文、取引修正、部分決済、両建て決済操作のリアルタイム同期を行います。デモ口座とライブ口座、取引ログインまたは投資家ログインの両方に対応し、EA、ターミナル、またはVPSが再起動してもパーシスタント取引メモリシステムを通じて復旧を保証します。複数のマスターとスレーブをユニークIDで同時に管理でき、ブローカー間の違いはプレフィックス/サフィックス調整またはカスタムシンボルマッピングを通じて自動的に処理されます。 マニュアル/設定  | Copy Cat More MT4 | チャンネル  特別機能: 設定が簡単 — わずか30秒で完了(ビデオをご覧
Exp COPYLOT CLIENT for MT5
Vladislav Andruschenko
3.82 (34)
MT5のトレードコピー機は、МetaТrader5プラットフォームのトレードコピー機です 。 それは間の 外国為替取引をコピーします   任意のは 、MT5 - MT5、MT4 - MT5   COPYLOT MT5版の アカウント (またはを MT4 - MT4   MT5 - MT4   COPYLOT MT4版用) 信頼できるコピー機! MT4のバージョン 完全な説明   +DEMO +PDF 購入する方法 インストールする方法     ログファイルの取得方法     テストと最適化の方法     Expforex のすべての製品 МТ4ターミナルでトレードをコピーすることもできます(   МТ4   -   МТ4、МТ5   -   МТ4   ):   MT4のCOPYLOT CLIENT このバージョンには、端末間 МТ5   -   МТ5、МТ4   -   МТ5が含まれ ます。 ディールコピー機は、2/3/10端末間でディール/ポジションをコピーするために作成されます。 デモ口座と投資口座からのコピーがサポートされています。 プログラムは、複数の端末バインデ
Smart Stop Manager – プロレベルの精度でストップロスを自動実行 概要 Smart Stop Manager は Smart Stop ラインナップの「実行レイヤー」であり、複数ポジションを持つトレーダーのために構築された、構造化された信頼性の高い完全自動ストップロス管理システムです。すべての保有中ポジションを継続的に監視し、Smart Stop のマーケットストラクチャー・ロジックを用いて最適なストップレベルを計算し、明確で透明性のあるルールに従ってストップを自動更新します。 単一の銘柄から複数銘柄のポートフォリオ全体まで、Smart Stop Manager は各トレードに規律、安定性、そして完全なリスク可視化をもたらします。感情的判断を排除し、手作業を大幅に削減し、すべてのストップが常に市場構造に基づいた論理的なプロセスに従うことを保証します。 ハイライト マーケットストラクチャーに基づく自動ストップ配置 • Smart Stop ロジックに基づき、各オープンポジションへ最適なストップロスを自動適用します。 ポートフォリオ全体を一目で把握 • 銘柄、方向
The product will copy all telegram signal to MT5 ( which you are member) , also it can work as remote copier.  Easy to set up, copy order instant, can work with almost signal formats, image signal,  s upport to translate other language to English Work with all type of channel or group, even channel have "Restrict Saving Content", work with  multi channel, multi MT5 Work as remote copier: with signal have ticket number, it will copy exactly via ticket number. Support to backtest signal. How to s
Ultimate Extractor - Professional Trading Analytics for MT5 *****this is the local HTML version of Ultimate Extractor. Check out Ultimate Extractor Cloud on mql5 for the Cloud version****** Ultimate Extractor transforms your MetaTrader 5 trading history into actionable insights with comprehensive analytics, interactive charts, and real-time performance tracking. What It Does Automatically analyzes your MT5 trading history across all Expert Advisors and generates detailed HTML reports with inte
Smart Stop Scanner – マルチアセット対応の市場構造型ストップロス分析システム 概要 Smart Stop Scanner は、複数の市場にわたるストップロス構造をプロフェッショナル品質で監視するために設計されたツールです。 実際の市場構造、重要なブレイクアウト、価格アクションロジックに基づいて最も意味のあるストップゾーンを自動的に検出し、 高精細(DPI対応)で見やすい統一パネルに表示します。 Forex、ゴールド、インデックス、メタル、暗号資産など幅広い市場に対応しています。 ストップレベルの算出方法 従来型のインジケーターや任意の計算式は使用していません。 代わりに、 ブレイクアウト、より高い高値、より低い安値 といった実際の市場構造イベントを検出します。 ストップレベルはこれらの構造ポイントから直接生成されるため、より自然で信頼性が高く、 実際の市場動向に即したストップ設定が可能になります。 主なハイライト • 高精度のマルチアセット対応 Forex、メタル、ゴールド、インデックス、暗号資産など、幅広い銘柄をサポートし、桁数やティックサイズを自動処
MT5 to Telegram Signal Provider は、Telegramのチャット、チャンネル、またはグループに 指定された シグナルを送信することができる、完全にカスタマイズ可能な簡単なユーティリティです。これにより、あなたのアカウントは シグナルプロバイダー になります。 競合する製品とは異なり、DLLのインポートは使用していません。 [ デモ ] [ マニュアル ] [ MT4版 ] [ Discord版 ] [ Telegramチャンネル ]  New: [ Telegram To MT5 ] セットアップ ステップバイステップの ユーザーガイド が利用可能です。 Telegram APIの知識は必要ありません。必要な全ては開発者から提供されます。 主な特長 購読者に送信する注文の詳細をカスタマイズする機能 例えば、Bronze、Silver、Goldといった階層型のサブスクリプションモデルを作成できます。Goldサブスクリプションでは、すべてのシグナルが提供されます。 id、シンボル、またはコメントによって注文をフィルターできます 注文が実行されたチャート
Seconds Chart — MetaTrader 5で秒足チャートを作成するユニークなツールです。 Seconds Chart を使用すると、秒単位のタイムフレームでチャートを構築でき、標準的な分足や時間足チャートでは得られない柔軟性と分析精度を実現します。例えば、 S15 は15秒足を表します。カスタムシンボルをサポートしているインジケーターやEAをすべて使用できます。標準的なチャートと同様に便利に操作できます。 標準的なツールとは異なり、 Seconds Chart は超短期のタイムフレームでも高い精度と遅延なく作業できるように設計されています。 Seconds Chartの利点 1秒から900秒 までのタイムフレームをサポート。 組み込みのティックデータベースにより、ヒストリカルデータを 瞬時にロード 。 リアルタイムでデータが更新され、 遅延やラグなし 。 複数の秒足チャートを同時に作成可能。 Seconds Chartが最適な用途 スキャルピング や高頻度取引。 正確なエントリーとエグジット。 短期タイムフレームでの取引戦略のテスト。 タイムフレームの設定 デフォルトの設
Anchor: The EA Manager A coordination system for traders running multiple EAs. Anchor ensures only one EA can trade at a time, preventing conflicting positions and keeping your portfolio safer. Attach Anchor to any chart. Configure your EAs and their magic numbers. Anchor handles the rest. Built for portfolios. Built for discipline. Built for prop firms. The Problem Running multiple EAs on the same account creates risk. Two gold EAs can open opposite positions on the same candle. Three EA
ワンクリックで取引できるトレーディングパネル。ポジションと注文の操作!チャートまたはキーボードから取引。 当社の取引パネルを使用すると、チャートから直接シングルクリックで取引を実行でき、標準の MetaTrader コントロールよりも 30 倍高速に取引操作を実行できます。 パラメータと関数の自動計算により、トレーダーにとって取引がより速く、より便利になります。 グラフィックのヒント、情報ラベル、取引取引に関する完全な情報はチャート MetaTrader にあります。 MT4のバージョン 完全な説明   +DEMO +PDF 購入する方法 インストールする方法     ログファイルの取得方法     テストと最適化の方法     Expforex のすべての製品 手動取引用の取引パネル。チャート(チャートウィンドウ)またはキーボードから取引できます。  開閉、リバース、ロックポジションと注文を処理する МetaТrader5 のメインオーダーのトレーディングコントロールパネル:売買、売却、売却、売却、売却、閉じる、削除、修正、トレーリングストップ、ストップロス、takeproft
MT5のエキスパートアドバイザーリスクマネージャーは非常に重要であり、私の意見ではすべてのトレーダーにとって必要なプログラムです。 このエキスパートアドバイザーを使用すると、取引口座のリスクを管理することができます。リスクと利益の管理は、金銭的およびパーセンテージの両方で実行できます。 エキスパートアドバイザーが機能するには、それを通貨ペアチャートに添付し、許容可能なリスク値を預金通貨または現在の残高の%で設定するだけです。 [Instruction for Risk Manager parameters] アドバイザ機能 このリスクマネージャーは、リスクの管理を支援します。 -取引のために -1日あたり - 1週間 - ひと月ほど 制御することもできます 1)取引時の最大許容ロット 2)1日あたりの最大注文数 3)1日あたりの最大利益 4)エクイティを引き受ける利益を設定する それだけではありません。設定で自動設定を指定した場合、アドバイザーはデフォルトのSLとTPを設定することもできます。 アドバイザーは各イベントにアラートを添えて、注文を削除する理由を説明し
これは視覚的な取引パネルであり、取引を簡単に配置および管理し、人為的エラーを回避し、取引活動を強化するのに役立ちます。使いやすい視覚的なインターフェースと、健全なリスクおよび位置管理アプローチを組み合わせています。 [ インストールガイド | 更新ガイド | トラブルシューティング | よくある質問 | すべての製品 ] 驚くほど使いやすい チャートから簡単に取引 正確なリスク管理との取引、手間のかからない 資本の保存が最優先事項です 気をつけずに利益を上げましょう できるだけ早くリスクのない取引をお楽しみください 開かれているすべての取引の自動トレーリングストップ 最初のストップロスは、取引が行われるとすぐに配置されます EAは、取引を行った後に次のタスクを実行します。 最初のストップロス/テイクプロフィットは自動的に配置されます できるだけ早くフリーライドにロックします(オプション) ストップロスを初めて損益分岐点に移動します(オプション) 停止するまで、希望の方法を使用してストップロスを追跡します その他のクールな機能は次のとおりです。 優れたターミナルアクティビティレポート
Equity Protect Pro: 安心取引のための総合的な口座保護エキスパート 口座保護、資産保護、ポートフォリオ保護、マルチ戦略保護、利益保護、利益確定、取引セキュリティ、リスク管理プログラム、自動リスク管理、自動決済、条件付き決済、スケジュール決済、動的決済、トレーリングストップロス、ワンクリッククローズ、ワンクリック決済、ワンクリック復元などの機能をお探しなら、Equity Protect Pro が最適なプログラムです。 設定は簡単で、事前設定された条件に達すると、すべてのチャートを閉じることができ、シグナルサブスクリプションのキャンセルもサポートします(これは、すべての取引プログラムも停止することを意味します)。この時点で、新しい注文は生成されなくなり、最終的にすべての注文が閉じられ、予期せぬ損失を効果的に防止し、安心して取引できるようになります。 Equity Protect Pro Demo Version for yo u to test   Equity Protect Pro MT4 Demo.ex4 Equity Protect Pro MT5 Demo.
Local Trade Copier EA は、MAMまたはPAMMアカウントを必要とせずに、外部ソースからのトレードシグナルを実行する必要がある、または同時に複数のアカウントを管理する必要がある個々のトレーダーまたはアカウントマネージャー向けのソリューションです。最大8つのマスターアカウントから無制限のスレーブアカウントにコピーします [ インストールガイド | アップデートガイド | トラブルシューティング | FAQ | すべての製品 ] 100%セルフホスト インストールと使用が簡単 インストーラー、構成ファイル、サーバー、メモリパイプ、DLLは使用されていません EAを永久に使用するための1000回のアクティベーション ローカル実行、ネットワーク遅延なし それはあなたがこれまでに必要とするすべての機能を実装します: 最大8つのマスターアカウントと無制限のスレーブアカウント すべてのブローカーおよびDD / NDD / ECN / STP実行で動作します 異なる口座通貨の口座で動作します ライブアカウントとデモアカウントの間で区別なく機能します マスターアカウントとスレーブア
Trade Assistant 38 in 1
Makarii Gubaydullin
4.91 (23)
多機能ツール:ロット計算、グリッド注文、R/R比率、トレードマネージャー、サプライ&デマンドゾーン、プライスアクションなど デモ版   |   ユーザーマニュアル トレードアシスタント   はストラテジーテスターでは動作しません :   こちらからデモ版をダウンロード  して ユーティリティ をテストできます。 ご質問、改善のご提案、バグ発見の場合は ご連絡ください MT4版が必要な場合は こちら から入手できます トレード   プロセス を簡素化、高速化、自動化。   ダッシュボード で標準端末の機能を拡張。 トレードパネルは  あらゆる取引商品で動作:外国為替、株式、インデックス、暗号通貨など。 1. 新規トレードの実行 :ロット / リスク / R/R計算 :手動トレードのためのリスク管理 ロット計算機(リスクサイズに基づく取引量計算) リスク計算機(ロットサイズに基づくリスク額) リスクリワード   比率 グリッド注文:  + 動的間隔オプション、スプリットロットオプション 注文のアクティベーショントリガー、+ バイストップリミット / セルストップリミット 仮想SL、仮想
作者のその他のプロダクト
The market is unfair if only because 10% of participants manage 90% of funds. An ordinary trader has slim changes to stand against these "vultures". This problem can be solved. You just need to be among these 10%, learn to predict their intentions and move with them. Volume is the only preemptive factor that faultlessly works on any timeframe and symbol. First, the volume appears and is accumulated, and only then the price moves. The price moves from one volume to another. Areas of volume accumu
The indicator analyzes the volume scale and splits it into two components - seller volumes and buyer volumes, and also calculates the delta and cumulative delta. The indicator does not flicker or redraw, its calculation and plotting are performed fairly quickly, while using the data from the smaller (relative to the current) periods. The indicator operation modes can be switched using the Mode input variable: Buy - display only the buyer volumes. Sell - display only the seller volumes. BuySell -
FREE
The indicator displays the orders book, as well as increases its depth, remembering the location of orders that have gone beyond the current "window" view. Indicator capability Display the levels of open positions. Simulation of placing/cancelling/editing pending orders directly in the displayed orders book. Indicator features The orders book display works only on those trading symbols for which it is broadcast by the broker. To reset the information about the rows that were recorded in the Sm
FREE
The balance of supply and demand is a simple and effective market analysis method. The supply and demand diagram can show you in advance, even before the trend reversal, where the supply ends and the demand is already emerging, where the demand ends and the supply is emerging, while substantially increasing the probability of making a deal in the right direction and with a high profit factor. Indicator signals The indicator uses the price/volume values to generate signals: ED – excess demand. E
BoxProfile MT5
Evgeny Shevtsov
4.6 (10)
The indicator displays volume profiles based on the nesting principle. Profiles periods are pre-set so that each subsequent profile has a length twice as long as the length of the previous profile. In addition to profiles, the indicator displays volume clusters sorted by color, depending on the volume they contain. Indicator operation features The indicator works on typical timeframes from M5 to MN, but for calculations uses historical data from smaller timeframes: M1 - for timeframes from M5
FREE
The indicator displays volume clusters or volume profiles to choose from. Input variables StepPoint  - cluster step in points, if the value is zero, the step is assigned automatically. AssociatedTimeframe  - binding the indicator to the specified timeframe of the chart, if the value is equal to Current, the indicator works on all timeframes. ClustersVolume  - volume in clusters: All  - all volume. Active  - active volume (which produced the price movement). ClustersAsDelta  - difference betwee
The utility refers to probabilistic analysis tools, in particular the Monte Carlo method. The Monte Carlo method is defined as the simulation of processes in purpose to evaluate their probabilistic characteristics and apply them to the solvable task. Operation features The simulation uses a tick model with the subsequent transformation to the candles form, as a model as close as possible to the real market process. The utility generates a stream of a random tick sequence until a result with the
The indicator analyzes the volume scale and splits it into two components - seller volumes and buyer volumes, and also calculates the delta and cumulative delta. The indicator does not flicker or redraw, its calculation and plotting are performed fairly quickly, while using the data from the smaller (relative to the current) periods. The indicator operation modes can be switched using the Mode input variable: Buy - display only the buyer volumes. Sell - display only the seller volumes. BuySell -
FREE
This indicator calculates the volume profile and places labels that correspond to the VAH, VAL and POC levels, for each candle individually. Indicator operation features The indicator works on the timeframes from M3 to MN, but it uses the history data of smaller periods: M1 - for periods from M3 to H1, M5 - for periods from H2 to H12, M30 - for the D1 period, H4 - for the W1 period, D1 - for the MN period. The color and location of the VAL, VAH and POC labels on the current candle are considere
FREE
The indicator has been designed for use on FORTS, but it can also work on other markets, at brokers broadcasting the required data. A peculiarity of these data is that they cannot be requested from the broker's server as a section of history, but can only be obtained for the current moment. The indicator periodically requests the broker, collects to a file and displays the following history from the stored file: The weighted average price. The volume of buy pending orders. The volume of sell pen
FREE
BoxProfile MT4
Evgeny Shevtsov
4.92 (12)
The indicator displays volume profiles based on the nesting principle. Profiles periods are pre-set so that each subsequent profile has a length twice as long as the length of the previous profile. In addition to profiles, the indicator displays volume clusters sorted by color, depending on the volume they contain. Indicator operation features The indicator works on typical timeframes from M5 to MN, but for calculations uses historical data from smaller timeframes: M1 - for timeframes from M5
FREE
The indicator displays peak levels of activity formed by the maximum volume, tracks the correlation of the candles on all timeframes (from the highest to the lowest one). Each volume level is a kind of key trading activity. The most important cluster is inside a month, week, day, hour, etc. Indicator operation features A volume level receives Demand status if the nearest volume level located to the left and above has been broken upwards. A volume level receives Supply status if the nearest volu
The balance of supply and demand is a simple and effective market analysis method. The supply and demand diagram can show you in advance, even before the trend reversal, where the supply ends and the demand is already emerging, where the demand ends and the supply is emerging, while substantially increasing the probability of making a deal in the right direction and with a high profit factor. Indicator Signals The indicator uses the price/volume values to generate signals: ED – excess demand. E
The indicator displays volume clusters or volume profiles to choose from. For trading symbols which contain the tape of deals, the indicator can perform calculations based on the tape of deals. Input variables StepPoint  - cluster step in points, if the value is zero, the step is assigned automatically. HistoryTicks  - size of tick history (for VolumeType in the mode TimeAndSales). AssociatedTimeframe  - binding the indicator to the specified timeframe of the chart, if the value is equal to Cu
BoxInside MT4
Evgeny Shevtsov
4.83 (6)
This indicator calculates the volume profile and places labels that correspond to the VAH, VAL and POC levels, for each candle individually. Indicator operation features The indicator works on the timeframes from M5 to MN, but it uses the history data of smaller periods: M1 - for periods from M5 to H1, M5 - for the H4 period, M30 - for the D1 period, H4 - for the W1 period, D1 - for the MN period. The color and location of the VAL, VAH and POC labels on the current candle are considered to be c
FREE
The indicator displays the delta and the cumulative delta based on the "Time & Sales" deals list data. In addition to the standard timeframes, the indicator displays data regarding the seconds timeframes (S5, S10, S15, S20, S30) to choose from. Using the rectangle, user can select an arbitrary area in the indicator subwindow to view the ratio of the volumes of deals of buyers and sellers within this area. Indicator features: The indicator works correctly only on those trading symbols for which
The indicator displays peak levels of activity formed by the maximum volume, tracks the correlation of the candles on all timeframes (from the highest to the lowest one). Each volume level is a kind of key trading activity. The most important cluster is inside a month, week, day, hour, etc. Indicator operation features A volume level receives Demand status if the nearest volume level located to the left and above has been broken upwards. A volume level receives Supply status if the nearest volu
BoxChart MT4
Evgeny Shevtsov
4.4 (5)
The market is unfair if only because 10% of participants manage 90% of funds. An ordinary trader has slim changes to stand against these "vultures". This problem can be solved. You just need to be among these 10%, learn to predict their intentions and move with them. Volume is the only preemptive factor that faultlessly works on any timeframe and symbol. First, the volume appears and is accumulated, and only then the price moves. The price moves from one volume to another. Areas of volume accumu
The indicator displays market profiles of any duration in any place on the chart. Simply create a rectangle on the chart and this rectangle will be automatically filled by the profile. Change the size of the rectangle or move it - the profile will automatically follow the changes. Operation features The indicator is controlled directly from the chart window using the panel of buttons and fields for entering parameters. In the lower right corner of the chart window there is a pop-up "AP" button
The indicator calculates volume profiles dynamically and displays the result as VAL, VAH and POC curves. Indicator features The indicator uses the historical data of the lower (relative to the current) timeframes for calculations: M1 - for timeframes up to H1, M5 - for timeframe H1, M15 - for timeframe H4, H1 - for timeframe D1, H4 - for timeframe W1, D1 - for timeframe MN. The color of the DPOC curve sections is determined by comparing the volume of the POC levels of all profiles that make up
The indicator refers to the means of probabilistic analysis. Prediction is performed by the Monte Carlo method together with a mathematical model of a neuron. But, the modeling of samples for this method is made not artificially, but comes from the original "nature", that is, from history. The number of samples and the detail of their modeling is achieved using the lower (relative current) timeframe. Indicator algorithm : In general terms, the algorithm boils down to the fact that the indica
The indicator displays market profiles of any duration in any place on the chart. Simply create a rectangle on the chart and this rectangle will be automatically filled by the profile. Change the size of the rectangle or move it - the profile will automatically follow the changes. Operation features The indicator is controlled directly from the chart window using the panel of buttons and fields for entering parameters. In the lower right corner of the chart window there is a pop-up "AP" button
The utility refers to probabilistic analysis tools, in particular the Monte Carlo method. The Monte Carlo method is defined as the simulation of processes in purpose to evaluate their probabilistic characteristics and apply them to the solvable task. Operation features The simulation uses a tick model with the subsequent transformation to the candles form, as a model as close as possible to the real market process. The utility generates a stream of a random tick sequence until a result with th
The indicator calculates volume profiles dynamically and displays the result as VAL, VAH and POC curves. Indicator features The indicator uses the historical data of the lower (relative to the current) timeframes for calculations: M1 - for timeframes up to H1, M5 - for timeframe H1, M15 - for timeframe H4, H1 - for timeframe D1, H4 - for timeframe W1, D1 - for timeframe MN. The color of the DPOC curve sections is determined by comparing the volume of the POC levels of all profiles that make up
The indicator refers to the means of probabilistic analysis. Prediction is performed by the Monte Carlo method together with a mathematical model of a neuron. But, the modeling of samples for this method is made not artificially, but comes from the original "nature", that is, from history. The number of samples and the detail of their modeling is achieved using the lower (relative current) timeframe. Indicator algorithm : In general terms, the algorithm boils down to the fact that the indica
The indicator colors the candles relative to their volume delta. The calculation of the candles delta is based on the tick history or on the deals tape history (see below for a description of the input variable "Volumes"). Coloring is performed by two parameters : by delta sign, as candle color, by delta value, as candle color contrast against chart window background color. In addition to coloring the candles, the indicator also displays the delta profile on the interval specified by the user
フィルタ:
レビューなし
レビューに返信