Smart DOM Driver

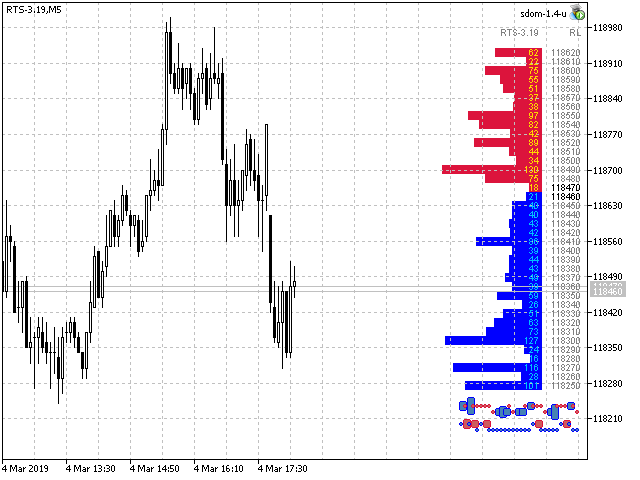
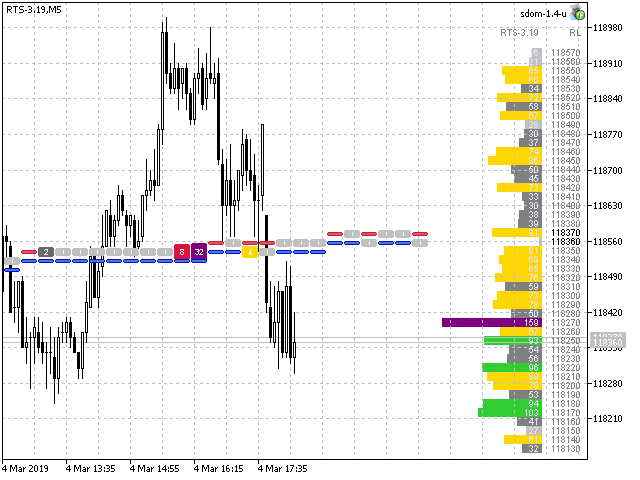
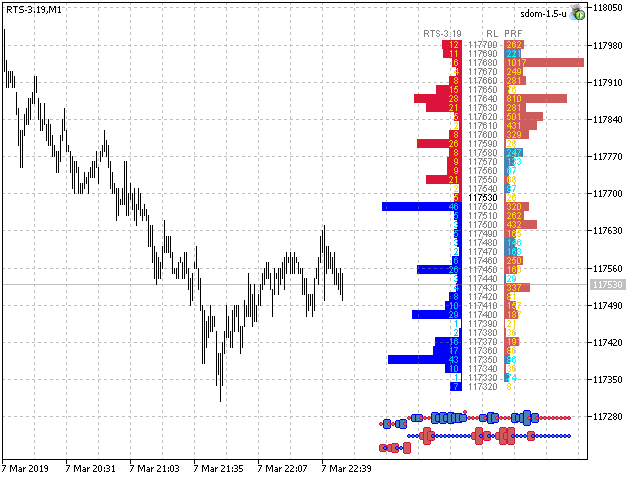
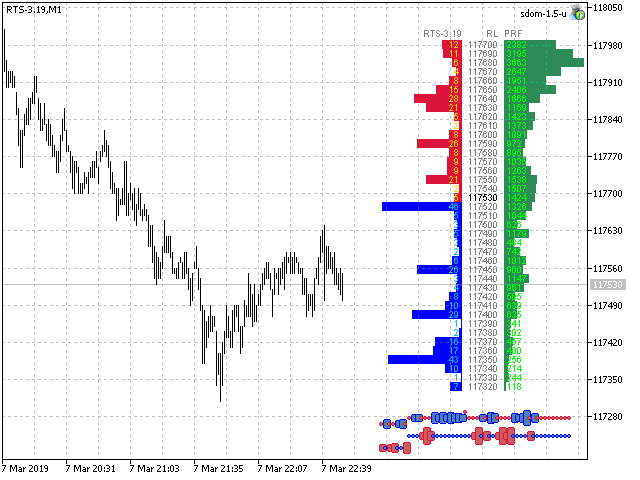
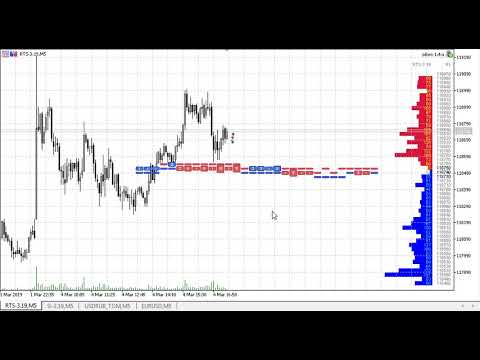
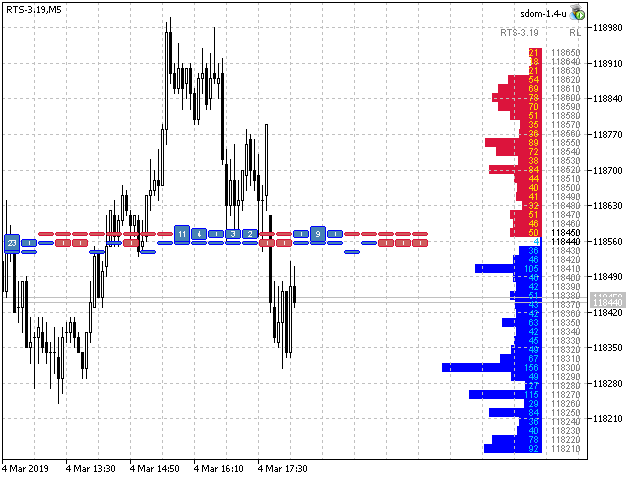
The utility displays the order book, as well as increases its depth, remembering the location of applications that have gone beyond the current "window" view.

With the utility user can perform quick trading actions in one click - placing/cancelling/editing of explicit and hidden orders, and also opening/editing positions.


Utility features

The orders book display works only on those trading symbols for which it is broadcast by the broker.

To reset the information about the rows that were recorded in the Smart mode, switch the indicator to the Fixation mode and double-click on the orders book title.

For currency pairs, as a rule, the deals tape is not broadcast, so the input variable ProfileCalculation must be switched to the Interpretation state. In addition, it is desirable to use the input variable RowsUnite, which groups the rows by a specified number of points (for example, ten).

Hidden orders are not sent to the broker's server, but are stored directly in the utility's memory, and are triggered as direct deals at the touch of the declared price. Therefore, when using HideOrders modes, especially ExitType, a stable connection with the broker server is required.

Due to the specifics of the displayed data, the utility can not work as a trial version, and can not be tested in the strategy tester.


Input variables

A description of the input variables is attached on the "Comments" tab in post 21 of 26.11.2021.

Produtos recomendados
ChartTime
Waheed Hussain
Never miss a candle close again! The Candle Closing Time Remaining indicator is an essential utility tool designed for traders who rely on precise timing, candlestick patterns, and chart confirmation before entering or exiting trades. Whether you trade Forex, Crypto, Gold, Indices, or Stocks, this indicator seamlessly works on every chart, every symbol, and all timeframes .
FREE
Mirror Chart MT5
Andrej Hermann
5 (1)
The Mirror Chart MT5 is a overlay indicator specifically designed to project a second financial instrument directly onto the main chart window. This tool is invaluable for traders who rely on correlation analysis, as it visualizes the price movements of two different instruments in real time. Unlike traditional overlays, this indicator utilizes intelligent, dynamic centering and scaling logic. It continuously analyzes the visible price range in the current window for both symbols and calculates
FREE
See how your account is really doing at a glance, right on the chart. The dashboard reads your account and trade history and never opens, modifies or closes a trade. How it works Every second the dashboard reads balance, equity, margin and open positions. Closed results come from the deal history: for each closing deal the profit, swap, commission and fee are added together. From these deals it calculates closed profit for today, this week and this month, plus statistics for the period you choos
FREE
VM Auto SLTP Basic
Van Minh Nguyen
5 (1)
VM Auto SLTP Basic - Intelligent Trade Management for Scalpers Enhance your scalping strategy to a higher level. VM Auto SLTP Basic automatically manages Stop Loss and Take Profit for orders that are opened manually or by other Expert Advisors. This tool does not open trades on its own, allowing you to maintain full control while enjoying precise risk management. Full documentation available in the product blog:   [User Guide] For additional trade management features, see VM Auto SLTP Pro. It su
FREE
Forex Volume MT5
KEENBASE SOFTWARE SOLUTIONS
KT Forex Volume exibe o volume de compra e venda de um par de moedas na forma de um histograma colorido. O volume é composto por transações de compra e venda de um ativo. No mercado Forex: Se o volume de compra for maior que o de venda, o preço do par de moedas tende a subir. Se o volume de venda for maior que o de compra, o preço do par de moedas tende a cair. Recursos Evite operações ruins confirmando-as com dados de volume por tick. Ajuda você a operar na direção dos grandes players do merca
Order Type Ledger lê o histórico de ordens desta conta - não seu histórico de operações - e conta o que aconteceu com cada ordem enviada. A ferramenta não prevê nem aconselha. Nunca observa resultados de negociação; apenas conta desfechos: executada, cancelada, expirada, rejeitada. Por que existe: a maioria das ferramentas de negociação só olha para trás as operações que foram executadas. Uma ordem limitada que expirou sem ser tocada, uma ordem stop que foi rejeitada, uma ordem que esperou hora
BoxChart MT5
Evgeny Shevtsov
5 (7)
The market is unfair if only because 10% of participants manage 90% of funds. An ordinary trader has slim changes to stand against these "vultures". This problem can be solved. You just need to be among these 10%, learn to predict their intentions and move with them. Volume is the only preemptive factor that faultlessly works on any timeframe and symbol. First, the volume appears and is accumulated, and only then the price moves. The price moves from one volume to another. Areas of volume accumu
TrendVision AI
Murtadha Majid Jeyad Al-Khuzaie
TrendVision AI – Smart Trend Channels & Price Forecasting for MetaTrader 5 Discover market structure and explore potential future price direction with TrendVision AI, an advanced technical indicator for MetaTrader 5 that combines automatic trendline analysis with a machine-learning-based price forecasting model. How Does TrendVision AI Work? TrendVision AI analyzes historical candlestick data within a configurable lookback window. It automatically draws two trendlines directly on the chart:
FREE
Candle Strength Oscillator
Murtadha Majid Jeyad Al-Khuzaie
5 (1)
Candle Pressure Index (CPI) is a powerful yet easy-to-use indicator designed to reveal the hidden buying and selling pressure behind every candle. Instead of simply showing whether the price moved up or down, CPI digs deeper into how strongly buyers or sellers controlled the market within each candle. This makes it a unique tool for identifying trend strength, spotting reversals early, and confirming entry or exit points with higher accuracy. Unlike traditional oscillators that only react to p
FREE
Volume Profile Density V2.40 Mostra a distribuição do volume por nível de preço, revelando áreas de interesse institucional. Diferente do volume clássico (por tempo), mostra onde o volume realmente se concentrou. Conceitos principais: Barras horizontais = volume negociado em cada preço Barra mais longa → maior volume Zonas vermelhas = suportes e resistências fortes Principais usos: Identificar suportes e resistências reais Determinar o POC (Ponto de Controle) Definir a Área de Valor (70 % do vol
FREE
Quick deals EA
Aleksandr Slavskii
Горячие клавиши плюс клик левой кнопки мыши на графике. Советник открывает сделки, выставляет лимитные и стоповые ордера, удаляет ордера и закрывает позиции, также  делает реверс  открытых позиций, выставляет прописанные в настройках стоп лосс и тейк профит. (реверс только на неттинговых счетах) При запуске советника можно посмотреть подсказку как действует советник при нажатии клавиши + клик на графике. Правее последнего бара, ниже цены Ctrl+ЛКМ  - OpenSell Правее последнего бара, выше цены C
O indicador cria cotações atuais, que podem ser comparadas com as históricas e, com base nisso, fazer uma previsão do movimento dos preços. O indicador possui um campo de texto para navegação rápida até a data desejada. Opções: Símbolo - seleção do símbolo que o indicador exibirá; SymbolPeriod - seleção do período do qual o indicador coletará dados; IndicatorColor - cor do indicador; HorisontalShift - deslocamento das cotações desenhadas pelo indicador pelo número especificado de barras; I
Deriv Synthetic HTF Candle Projection GMT2 Higher Timeframe Candle Projection & Previous Levels Tool for Deriv Synthetic Indices (MT5) Overview Deriv Synthetic HTF Candle Projection GMT2 is a professional MetaTrader 5 indicator built specifically for Deriv Synthetic indices . It projects the current forming Higher Timeframe (HTF) candle onto the chart and automatically draws key reference levels from previous candles. This indicator is designed to help traders maintain higher timeframe context
FREE
Neon Profile
Manuel Fernandez Barranco
XBK Neon Profile MT5 Developed by XBK Systems. XBK Neon Profile is an advanced technical indicator for MetaTrader 5 that combines smoothed trend analysis and a dynamic volume profile within a single chart window. The indicator is designed to provide a clear view of market structure and significant volume levels without cluttering the screen. Key Features Smoothed Trend Bands (Neon Trend Bands) Identifies the current trend direction using a custom smoothing algorithm designed to filter out market
FREE
O Pulsar Panel MT5 é um gerenciador de operações no gráfico para o MetaTrader 5: planeje uma ordem com linhas arrastáveis de entrada, Stop Loss (SL) e Take Profit (TP), envie-a com até quatro níveis de TP, break-even e trailing stop, gerencie as posições, controle sua perda diária e revise suas estatísticas. O Pulsar Panel é um Expert Advisor (EA) que desenha seus painéis diretamente no gráfico. Não há aplicativo externo a instalar nem biblioteca de vínculo dinâmico (DLL). Importante - condições
MGD Prop Risk Guard MT5 Professional Account Risk Monitoring for MetaTrader 5 — FREE MGD Prop Risk Guard MT5 is a free account risk monitoring utility designed to help traders stay informed about their daily loss limits, maximum drawdown, and available risk. Whether you trade manually, use Expert Advisors, or participate in proprietary trading firm challenges, MGD Prop Risk Guard provides a clear, real-time overview of your account's risk exposure. Monitor your trading risk directly from your MT
FREE
Was: $249  Now: $99   Market Profile defines a number of day types that can help the trader to determine market behaviour. A key feature is the Value Area, representing the range of price action where 70% of trading took place. Understanding the Value Area can give traders valuable insight into market direction and establish the higher odds trade. It is an excellent addition to any system you may be using. Inspired by Jim Dalton’s book “Mind Over Markets”, this indicator is designed to suit the
Expansoes M
Marcus Vinicius Da Silva Miranda
As Expansões M são variações da Proporção Áurea (Sequência de Fibonacci). É a primeira técnica de projeção, no mercado mundial, desenvolvida para ancoragem em Candle. Vantagens: Fácil Plotagem, pode ser ancorada em apenas um Candle; Alto grau de precisão como suportes / resistências; Excelente relação de Risco x Retorno; Funciona em qualquer tempo gráfico; Funciona em qualquer ativo.   As regiões das Expansões M são classificadas em: M0: Ponto 0 (candle inicial) LC: Linha de suporte inicial
FREE
Cumulative Delta MT5
Evgeny Shevtsov
4.49 (63)
The indicator analyzes the volume scale and splits it into two components - seller volumes and buyer volumes, and also calculates the delta and cumulative delta. The indicator does not flicker or redraw, its calculation and plotting are performed fairly quickly, while using the data from the smaller (relative to the current) periods. The indicator operation modes can be switched using the Mode input variable: Buy - display only the buyer volumes. Sell - display only the seller volumes. BuySell -
FREE
MSS Levels HTF
Milana Muslimova
MSS Levels HTF - Milana Trades Higher-timeframe Market Structure Shift levels that turn into Support / Resistance and Mirror levels as price interacts with them. THE IDEA When price breaks a swing high or swing low on a higher timeframe, that swing becomes an important reference level. The indicator marks it, then follows how price reacts to it: first touch, retest, and finally a flip to the other side. Everything is drawn on your current chart, so you can work on a lower timeframe, while the
FREE
Order Book, known also as Market Book, market depth, Level 2, - is a dynamically updated table with current volumes of orders to buy and to sell specific financial instument at price levels near Bid and Ask. MetaTrader 5 provides the means for receiving market book from your broker, but in real time only, without access to its history. The indicator OrderBook Cumulative Indicator accumulates market book data online and visualizes them on the chart. In addition, the indicator can show the market
Value Chart Candlesticks
Flavio Javier Jarabeck
4.57 (14)
The idea of a Value Chart indicator was presented in the very good book I read back in 2020 , " Dynamic Trading Indicators: Winning with Value Charts and Price Action Profile ", from the authors Mark Helweg and David Stendahl. The idea is simple and the result is pure genius: Present candlestick Price analysis in a detrended way! HOW TO READ THIS INDICATOR Look for Overbought and Oversold levels. Of course, you will need to test the settings a lot to find the "correct" one for your approach. It
FREE
Price Density Profile
Vahidreza Heidar Gholami
Price Density Profile Draws a horizontal histogram on the right side of the chart, showing where price spent most of its time, and uses it to mark key price zones as lines and bands. Similar to a Volume Profile , Market Profile / TPO, or price histogram, it helps you identify high-activity zones , support and resistance levels , the point of control , and low-activity gaps where price moved through quickly. All products are 50% off for a limited time only! Explore my other products to find all
FREE
Supply demand arrows
Smaylle Rafael Coelho Mariano
O indicador   "Supply Demand Arrows"   para MetaTrader 5 (MT5) é uma ferramenta de trading poderosa projetada para ajudar os traders a identificar zonas críticas de oferta e demanda no mercado. Ao marcar visualmente essas zonas com setas, o indicador melhora a precisão das operações e a tomada de decisões. Características Principais Identificação das Zonas de Oferta e Demanda : O indicador destaca efetivamente as zonas-chave de oferta e demanda no gráfico de preços, permitindo que os traders vej
FREE
Wapv Price and volume
Eduardo Da Costa Custodio Santos
O Indicador WAPV Price and Volume para MT5 faz parte do conjunto de ferramentas do (Wyckoff Academy Wave Market) e ( Wyckoff Academy Price and Volume). O Indicador WAPV Price and Volume para MT5 foi criado para facilitar a visualização da movimentação do volume  no gráfico de forma intuitiva. Com ele você pode observar os momentos de pico de volume e momentos em que o mercado não tem interesse profissional Identificar momentos que o Mercado esta se movimentando por inércia e não por moviment
Donchian Breakout And Rsi
Mattia Impicciatore
4.33 (3)
Descrição geral Este indicador é uma versão aprimorada do Canal Donchian clássico, enriquecida com funções práticas para o trading real. Além das três linhas padrão (máxima, mínima e linha do meio), o sistema detecta breakouts e os mostra visualmente com setas no gráfico, exibindo apenas a linha oposta à direção da tendência atual para uma leitura mais limpa. O indicador inclui: Sinais visuais : setas coloridas nos breakouts Notificações automáticas : alerta pop-up, push e e-mail Filtro RSI : pa
FREE
Here   our more valuable tools SMC Trend Trading   ,  Easy SMC Trading  ,  Institutional SMC Architect Volume Analysis Tools  ,  Volume flow Profile  ,  Market volume profile  , FVG with Volume  , Liquidity Heatmap Profile  ,  Volume Spread Analysis The    Liquidity Heatmap   is a sophisticated institutional trading tool designed to reveal where over-leveraged traders are trapped. By calculating estimated liquidation levels based on volume spikes and leverage, this indicator draws a dynamic "h
Session Profiles
Basharat Umar Khan
Short Description Draws rolling Time-Price-Opportunity (TPO) and footprint volume profiles for the Asia, London, and New York sessions with POC/VAH/VAL levels, delta volume bias, order flow overlays, liquidity heatmaps, developing rolling lines, Naked POC (NPOC) tracking, Initial Balance breakouts, multi-session confluence zones, and automatic broker GMT-offset detection. Full Description Plots separate market-profile and volume-profile style histograms for the three major trading sessions (Asi
FREE
Fvg Edge
Ahmad Meftah Abdulsalam Alawwami
5 (3)
FVG Smart Zones – Edição Gratuita Indicador de Detecção de Gap de Valor Justo para MetaTrader 5 (MT5) Está procurando uma ferramenta de trading real – não apenas mais um indicador qualquer? FVG Smart Zones – Edição Gratuita oferece uma visão profissional do mercado detectando automaticamente Gaps de Valor Justo (FVG) e destacando zonas de trading de alta probabilidade diretamente no seu gráfico. Criado para traders que seguem: Conceitos de Smart Money (SMC) Conceitos de Trading ICT
FREE
The Supply and Demand Zone Indicator is a powerful and easy-to-use tool designed to help traders identify critical supply and demand zones on the chart. These zones can provide valuable insight into potential market reversals, breakouts, and important price levels where buyers or sellers are likely to take control. The best   FREE Trade Manager . If you want to create your own Hedging or Grid strategies without any coding make sure to check out the   ManHedger Key Features: Automatic Zone Detect
FREE
Os compradores deste produto também adquirem
Trade Assistant MT5
Evgeniy Kravchenko
4.43 (216)
Ajuda a calcular o risco por comércio, a fácil instalação de uma nova encomenda, gestão de encomendas com funções de fecho parcial, trailing stop de 7 tipos e outras funções úteis. Materiais e instruções adicionais Instruções de instalação   -   Instruções para a aplicação   Função de linha Mostra no gráfico a linha de Abertura, Stop Loss, Take Profit. Com esta função é fácil definir uma nova ordem e ver as suas características adicionais antes da abertura.   Gestão de risco A função de cálcul
Bem-vindo ao Trade Manager EA—uma ferramenta de gestão de risco criada para tornar o trading mais intuitivo, preciso e eficiente. Não é apenas uma ferramenta para executar ordens, mas uma solução abrangente para planejamento de operações, gerenciamento de posições e controle de risco. Seja você um iniciante, trader avançado ou scalper que precisa de execução rápida, o Trade Manager EA adapta-se às suas necessidades, oferecendo flexibilidade em todos os mercados, desde forex e índices até commodi
Farmed Hedge Yield Farming | All Markets (Manual - Hybrid - Semi/Automated EA) VERIFIED TRADING RESULTS - Farmed Hedge Yield Axi Copy:  https://www.mql5.com/en/signals/2356376 - Farmed Hedge Yield Exn Copy:   https://www.mql5.com/en/signals/2356404 - Farmed Hedge Yield V Copy:  https://www.mql5.com/en/signals/2357156 IMPORTANT NOTICE: FarmedHedge is a MANUAL-FOCUSED TRADING UTILITY ,not a fully automated EA. Results shown on this Signal include manual trades and overall strategic management.
O Telegram to MT5 Multi-Channel Copier copia automaticamente os sinais de trading dos seus canais de Telegram e Discord diretamente para o MetaTrader 5. Sem bots, sem extensões de navegador, sem copiar à mão. O sinal chega ao Telegram ou ao Discord e o EA abre a operação no seu terminal em poucos segundos. E antes de copiar um canal, o backtester integrado mostra o que esse canal teria feito na sua conta. O produto inclui dois componentes: um aplicativo de Windows que escuta os seus canais de Te
Local Trade Copier EA MT5
Juvenille Emperor Limited
4.94 (149)
Local Trade Copier EA MT5 é um copiador de operações rápido e flexível para copiar e gerenciar operações entre várias contas MetaTrader 5 no mesmo computador Windows ou Windows VPS. Ele combina a sincronização local de operações com controles no lado do Receiver para tamanho de lote, gerenciamento de risco, filtragem de operações, mapeamento de símbolos, gerenciamento de operações e proteção da conta. Configure seus terminais Transmitter e Receiver em aproximadamente 1 minuto e copie operações
TradePanel MT5
Alfiya Fazylova
4.88 (172)
Trade Panel é um assistente de negociação multifuncional. O aplicativo contém mais de 50 funções de negociação para trading manual e permite automatizar a maioria das tarefas de negociação. Instruções para o aplicativo: https://www.mql5.com/pt/blogs/post/762435 Versão de teste do aplicativo para conta demo: https://www.mql5.com/pt/blogs/post/762547 Como instalar o aplicativo: https://www.mql5.com/pt/blogs/post/762548 Como testar o aplicativo no modo visual: https://www.mql5.com/pt/blogs/post/770
News Trade EA MT5
Konstantin Kulikov
4.55 (11)
Apresento um robô útil que eu mesmo uso há vários anos. Pode ser usado nos modos semiautomático e totalmente automático. >>> Chat <<< O programa contém configurações flexíveis para negociação nas notícias do calendário econômico. Não pode ser verificado no testador de estratégia. Somente trabalho real. Descarregue o ficheiro mais recente de definições: https://www.mql5.com/en/blogs/post/747929 Monitorização de sinais: https://www.mql5.com/en/signals/author/test-standart Ao criar suas próprias
Copie sinais do Telegram com suas próprias regras de negociação Telegram to MT5 Signal Trader copia automaticamente sinais de negociação em texto de canais e grupos públicos e privados do Telegram para o MetaTrader 5. Gerencie vários provedores e contas MT5 em um único aplicativo para desktop, com configurações individuais de risco e de negociação para cada provedor . Você não precisa de um bot do Telegram nem configurar uma API para copiar sinais. Basta entrar com sua própria conta do Telegram
Strategy Ledger Pro
Abdullah Uygar Tuna
5 (14)
Agora disponível em português. Strategy Ledger Pro é um painel de análise de conta somente leitura para o MetaTrader 5. Ele separa os resultados da conta por Expert Advisor, estratégia, símbolo e número mágico, para que você veja o que cada um realmente contribui. O painel está disponível em 11 idiomas: English, Français, Deutsch, Español, Italiano, Português, Русский, Türkçe, 中文, 日本語 e 한국어. Antes de baixar a demo. O Market executa a demo de qualquer produto pago somente no Testador de Estratég
================================================================================ POC BREAKOUT - V20.72. Full Professional Grade Toolkit ================================================================================ POC Breakout is a full MetaTrader 5 trading dashboard for discretionary traders who want breakout signals, Point of Control (POC) context, volume profiles, order flow, market structure, news, alerts, and advanced trade planning in one professional workspace. Attached directly to you
Exp COPYLOT CLIENT for MT5
Vladislav Andruschenko
3.97 (35)
Copiador profissional de operações para MetaTrader 5 Um copiador de operações rápido, profissional e confiável para MetaTrader . COPYLOT permite copiar operações de Forex entre terminais MT4 e MT5 com suporte para contas Hedge e Netting . A versão MT5 do COPYLOT oferece suporte a: - MT5 Hedge → MT5 Hedge - MT5 Hedge → MT5 Netting - MT5 Netting → MT5 Hedge - MT5 Netting → MT5 Netting - MT4 → MT5 Hedge - MT4 → MT5 Netting Versão MT4 Descrição completa + DEMO + PDF Como comprar Como instalar Como
The product will copy all telegram signal to MT5 ( which you are member) , also it can work as remote copier.  Easy to set up, copy order instant, can work with almost signal formats, image signal,  s upport to translate other language to English Work with all type of channel or group, even channel have "Restrict Saving Content", work with  multi channel, multi MT5 Work as remote copier: with signal have ticket number, it will copy exactly via ticket number. Support to backtest signal. How to s
REVDEN AI Desk: Conduza Seu Trading a Partir de Uma Conversa com Sua Própria IA, sobre o Contexto de Mercado do REVDEN Imagine conduzir seu trading a partir de uma única conversa. O REVDEN AI Desk traz isso para o MetaTrader 5: você pergunta à sua própria IA como ela lê o mercado, e ela responde a partir do contexto completo do REVDEN sobre os símbolos que você opera, com o estado de cada um, o quadro de risco e as divulgações que vêm pela frente. As propostas dela chegam com entrada, stop, alvo
EA Overfitter
Stephen J Martret
5 (3)
That backtest looks great. But will it still be making money tomorrow, next week, next month? EA Overfitter re-runs your EA on 100 price histories it has never seen. One score tells you if the edge is real. A backtest tells you what an EA did on one price history — the one that happened to occur. What you cannot tell from it is how much of that result was the strategy and how much was the particular path. EA Overfitter answers that. It builds up to 100 synthetic price histories your EA has n
Power Candles Strategy Scanner - Localizador de configurações multissímbolo com auto-otimização O Power Candles Strategy Scanner utiliza o mesmo motor de auto-otimização que alimenta o indicador Power Candles — em todos os símbolos da sua lista de observação, lado a lado. Um painel indica-lhe quais os símbolos que são estatisticamente negociáveis neste momento, qual a estratégia vencedora para cada um, o par ideal de Stop Loss / Take Profit, e avisa-o assim que um novo sinal é emitido. Esta ferr
Timeless Charts
Samuel Manoel De Souza
5 (9)
Timeless Charts é um utilitário de trading tudo-em-um para traders profissionais. Ele combina tipos de gráficos personalizados, como Gráficos por Segundos e Renko , com análise avançada de fluxo de ordens utilizando Footprints , Clusters , Perfis de Volume , estudos VWAP e ferramentas de análise ancorada para uma visão mais profunda do mercado. O gerenciamento de ordens e posições é realizado diretamente no gráfico por meio de um painel integrado de gerenciamento de operações , enquanto o Market
Painel de Trading para MetaTrader 5 — controle profissional de trading em um clique a partir do gráfico e do teclado Um painel de trading avançado para traders ativos, criado para abrir, gerenciar e fechar operações muito mais rápido do que com a interface padrão do MetaTrader. Esta solução foi desenvolvida para quem deseja controlar posições, ordens pendentes, lucro total e execução em um único espaço de trabalho profissional. Não se trata apenas de mais um utilitário. É um verdadeiro cockpit
Anchor Trade Manager
Kalinskie Gilliam
5 (8)
Your EAs cannot see each other, but Anchor can. Anchor gives you one place to coordinate your EAs, manage risk, and decide when trading is allowed. It works alongside the trading bots you already use without any changes to them. The Problem One EA opens a trade. Then another starts trading. The next thing you know, you wake up to multiple grids built across your account. Each EA may be doing exactly what it was designed to do, but together they can place far more risk on your account than you in
VirtualTradePad PRO SE MT5 — centro profissional de controle de trading para MetaTrader 5 VirtualTradePad PRO SE é um painel de trading premium baseado no gráfico e um ambiente de gerenciamento de operações para MetaTrader 5 . Ele foi desenvolvido para traders que desejam execução mais rápida, controle de posições mais claro, gerenciamento de trades estruturado, planejamento visual de níveis e um fluxo de trabalho profissional diretamente no gráfico. Não é apenas um painel de COMPRA / VENDA. O P
RETAILBERG FOOTPRINT CHART PRO — Order-Flow Workspace for MetaTrader 5 Version 7.00  |  Professional System  |  31 tools  |  One chart A full 150-page illustrated User Manual is included. Please read the full manual to understand this feature packed footprint chart elements and ui. https://www.mql5.com/en/blogs/post/777982 DEMO / STRATEGY TESTER — PLEASE READ FIRST
Trade Dashboard MT5
Fatemeh Ameri
4.94 (135)
Trade Dashboard simplifies how you open, manage, and control your trades, with built-in lot size calculation. It allows you to execute trades, manage risk, and control positions directly on the chart, with tools such as partial close, breakeven, and trailing stop. Designed to reduce manual work and help you stay focused on your trading decisions. A demo version is available for testing. Detailed explanations of features are provided within the MQL5 platform. Installation instructions are include
Trade Indicator Assistant   is a powerful MT5 utility designed to turn indicators into automated trading systems. Its main feature is the ability to automatically detect an indicator’s   BUY and SELL signal buffers , without requiring you to know the buffer numbers, search through indicator settings, or modify the indicator source code. Bonus Indicator:   After purchasing Trade Indicator Assistant, contact me to receive   Trade Signal Pro   completely free as a bonus indicator. [Download Demo V
Seconds Chart MT5
Boris Sedov
4.61 (18)
Seconds Chart - uma ferramenta exclusiva para criar gráficos de segundos no MetaTrader 5 . Com o Seconds Chart , você pode criar gráficos com períodos definidos em segundos, proporcionando flexibilidade e precisão ideais para análise, indisponíveis em gráficos padrão de minutos ou horas. Por exemplo, o período S15 indica um gráfico com velas de 15 segundos. Você pode usar qualquer indicador ou Expert Advisor com suporte a símbolos personalizados. Trabalhar com eles é tão conveniente quanto negoc
Trade Manager DaneTrades
Levi Dane Benjamin
4.13 (31)
Trade Manager para ajudá-lo a entrar e sair rapidamente de negociações enquanto calcula automaticamente seu risco. Incluindo recursos para ajudar a evitar negociações excessivas, negociações de vingança e negociações emocionais. As negociações podem ser gerenciadas automaticamente e as métricas de desempenho da conta podem ser visualizadas em um gráfico. Esses recursos tornam este painel ideal para todos os traders manuais e ajudam a aprimorar a plataforma MetaTrader 5. Suporte multilíngue. Vers
Próxima Atualização — Versão 2.52 em Breve! [NOVO] Prepare-se para 4 Grandes Novos Recursos Projetados para Aprimorar sua Análise de Mercado e seu Fluxo de Trabalho de Trading Estamos levando a análise de mercado a um novo nível com 4 novos recursos desenvolvidos para atender às suas necessidades de trading. Apresentamos: 1. TRADE OVERVIEW DASHBOARD 2. CONFLUENCE AT ZONE 3. STRONG & WEAK HIGH/LOW 4. OTE 1. TRADE OVERVIEW DASHBOARD Um painel que ajuda você a compreender mais facilmente o panoram
MT5 to Telegram Signal Provider é uma utilidade fácil de usar e totalmente personalizável que permite o envio de sinais especificados para o chat, canal ou grupo do Telegram, tornando sua conta um fornecedor de sinais . Ao contrário da maioria dos produtos concorrentes, ele não usa importações de DLL. [ Demonstração ] [ Manual ] [ Versão MT4 ] [ Versão Discord ] [ Canal do Telegram ]  New: [ Telegram To MT5 ] Configuração Um guia do usuário passo a passo está disponível. Não é necessário conhec
Trade copier MT5
Alfiya Fazylova
4.61 (57)
Trade Copier é um utilitário profissional projetado para copiar e sincronizar negociações entre contas de negociação. A cópia ocorre da conta / terminal do fornecedor para a conta / terminal do destinatário, instalada no mesmo computador ou vps. Antes de comprar, você pode testar a versão demo em uma conta demo. Versão de demonstração aqui . Instruções completas aqui . Principais funcionalidades e benefícios: Suporta a cópia de MT5> MT5, MT4> MT5, MT5> MT4, incluindo contas "MT5 netting". Os mod
DrawDown Limiter
Haidar Lionel Haj Ali
5 (23)
DrawDown Limiter v5.0 — Controlador Avançado de Proteção de Conta O DrawDown Limiter v5.0 é um controlador de proteção de conta executado no lado do cliente, desenvolvido para monitorar sua conta de trading e reagir automaticamente quando os limites configurados de risco, lucro, notícias, horário, rollover ou número de posições forem atingidos. Ele pode monitorar operações manuais, estratégias automatizadas, vários Expert Advisors, ordens pendentes e posições abertas a partir de um único gráfico
Telegram To MT5 Ultra
Mirel Daniel Gheonu
5 (5)
Telegram To MT5 — Copiador de sinais Transforme as chamadas de trading dos seus canais do Telegram em ordens reais no MT5 — automaticamente, em quantas contas quiser, com o risco e as regras totalmente sob o seu controlo. O Telegram To MT5 liga os canais VIP / de sinais que já segue no Telegram ao seu terminal MetaTrader 5. Um aplicativo de desktop complementar gratuito lê as mensagens (mesmo de canais que bloqueiam bots), e este Expert Advisor executa-as na sua conta — aplicando as suas própria
RS Trade Copier - o local trade copier ultrarrápido com uma interface gráfica verdadeira . Pare de digitar números de conta manualmente. Chega daquela lista enorme de 200+ parâmetros de entrada incompreensíveis. Uma ferramenta confiável e flexível para cópia de operações comerciais entre múltiplos terminais MT5 e MT4. Atende tanto traders experientes e serviços de sinais quanto investidores individuais. Permite sincronizar negociações de um ou múltiplos Provedores para um ou múltiplos Clientes c
Mais do autor
Clusters Chart MT4
Evgeny Shevtsov
5 (6)
The indicator displays volume clusters or volume profiles to choose from. Input variables StepPoint  - cluster step in points, if the value is zero, the step is assigned automatically. AssociatedTimeframe  - binding the indicator to the specified timeframe of the chart, if the value is equal to Current, the indicator works on all timeframes. ClustersVolume  - volume in clusters: All  - all volume. Active  - active volume (which produced the price movement). ClustersAsDelta  - difference betwee
Cumulative Delta MT5
Evgeny Shevtsov
4.49 (63)
The indicator analyzes the volume scale and splits it into two components - seller volumes and buyer volumes, and also calculates the delta and cumulative delta. The indicator does not flicker or redraw, its calculation and plotting are performed fairly quickly, while using the data from the smaller (relative to the current) periods. The indicator operation modes can be switched using the Mode input variable: Buy - display only the buyer volumes. Sell - display only the seller volumes. BuySell -
FREE
Smart Depth Of Market
Evgeny Shevtsov
4.33 (18)
The indicator displays the orders book, as well as increases its depth, remembering the location of orders that have gone beyond the current "window" view. Indicator capability Display the levels of open positions. Simulation of placing/cancelling/editing pending orders directly in the displayed orders book. Indicator features The orders book display works only on those trading symbols for which it is broadcast by the broker. To reset the information about the rows that were recorded in the Sm
FREE
Cumulative Delta MT4
Evgeny Shevtsov
4.86 (29)
The indicator analyzes the volume scale and splits it into two components - seller volumes and buyer volumes, and also calculates the delta and cumulative delta. The indicator does not flicker or redraw, its calculation and plotting are performed fairly quickly, while using the data from the smaller (relative to the current) periods. The indicator operation modes can be switched using the Mode input variable: Buy - display only the buyer volumes. Sell - display only the seller volumes. BuySell -
FREE
BoxProfile MT4
Evgeny Shevtsov
4.77 (13)
The indicator displays volume profiles based on the nesting principle. Profiles periods are pre-set so that each subsequent profile has a length twice as long as the length of the previous profile. In addition to profiles, the indicator displays volume clusters sorted by color, depending on the volume they contain. Indicator operation features The indicator works on typical timeframes from M5 to MN, but for calculations uses historical data from smaller timeframes: M1 - for timeframes from M5
FREE
BoxInside MT5
Evgeny Shevtsov
5 (4)
This indicator calculates the volume profile and places labels that correspond to the VAH, VAL and POC levels, for each candle individually. Indicator operation features The indicator works on the timeframes from M3 to MN, but it uses the history data of smaller periods: M1 - for periods from M3 to H1, M5 - for periods from H2 to H12, M30 - for the D1 period, H4 - for the W1 period, D1 - for the MN period. The color and location of the VAL, VAH and POC labels on the current candle are considere
FREE
BoxProfile MT5
Evgeny Shevtsov
4.6 (10)
The indicator displays volume profiles based on the nesting principle. Profiles periods are pre-set so that each subsequent profile has a length twice as long as the length of the previous profile. In addition to profiles, the indicator displays volume clusters sorted by color, depending on the volume they contain. Indicator operation features The indicator works on typical timeframes from M5 to MN, but for calculations uses historical data from smaller timeframes: M1 - for timeframes from M5
FREE
FORTS Trading Data
Evgeny Shevtsov
5 (2)
The indicator has been designed for use on FORTS, but it can also work on other markets, at brokers broadcasting the required data. A peculiarity of these data is that they cannot be requested from the broker's server as a section of history, but can only be obtained for the current moment. The indicator periodically requests the broker, collects to a file and displays the following history from the stored file: The weighted average price. The volume of buy pending orders. The volume of sell pen
FREE
BoxInside MT4
Evgeny Shevtsov
4.83 (6)
This indicator calculates the volume profile and places labels that correspond to the VAH, VAL and POC levels, for each candle individually. Indicator operation features The indicator works on the timeframes from M5 to MN, but it uses the history data of smaller periods: M1 - for periods from M5 to H1, M5 - for the H4 period, M30 - for the D1 period, H4 - for the W1 period, D1 - for the MN period. The color and location of the VAL, VAH and POC labels on the current candle are considered to be c
FREE
AnyProfile MT4
Evgeny Shevtsov
5 (27)
The indicator displays market profiles of any duration in any place on the chart. Simply create a rectangle on the chart and this rectangle will be automatically filled by the profile. Change the size of the rectangle or move it - the profile will automatically follow the changes. Operation features The indicator is controlled directly from the chart window using the panel of buttons and fields for entering parameters. In the lower right corner of the chart window there is a pop-up "AP" button
The balance of supply and demand is a simple and effective market analysis method. The supply and demand diagram can show you in advance, even before the trend reversal, where the supply ends and the demand is already emerging, where the demand ends and the supply is emerging, while substantially increasing the probability of making a deal in the right direction and with a high profit factor. Indicator signals The indicator uses the price/volume values to generate signals: ED – excess demand. E
Clusters Chart MT5
Evgeny Shevtsov
4.71 (7)
The indicator displays volume clusters or volume profiles to choose from. For trading symbols which contain the tape of deals, the indicator can perform calculations based on the tape of deals. Input variables StepPoint  - cluster step in points, if the value is zero, the step is assigned automatically. HistoryTicks  - size of tick history (for VolumeType in the mode TimeAndSales). AssociatedTimeframe  - binding the indicator to the specified timeframe of the chart, if the value is equal to Cu
BoxChart MT4
Evgeny Shevtsov
4.4 (5)
The market is unfair if only because 10% of participants manage 90% of funds. An ordinary trader has slim changes to stand against these "vultures". This problem can be solved. You just need to be among these 10%, learn to predict their intentions and move with them. Volume is the only preemptive factor that faultlessly works on any timeframe and symbol. First, the volume appears and is accumulated, and only then the price moves. The price moves from one volume to another. Areas of volume accumu
Market Marker MT4
Evgeny Shevtsov
5 (8)
The indicator displays peak levels of activity formed by the maximum volume, tracks the correlation of the candles on all timeframes (from the highest to the lowest one). Each volume level is a kind of key trading activity. The most important cluster is inside a month, week, day, hour, etc. Indicator operation features A volume level receives Demand status if the nearest volume level located to the left and above has been broken upwards. A volume level receives Supply status if the nearest volu
The balance of supply and demand is a simple and effective market analysis method. The supply and demand diagram can show you in advance, even before the trend reversal, where the supply ends and the demand is already emerging, where the demand ends and the supply is emerging, while substantially increasing the probability of making a deal in the right direction and with a high profit factor. Indicator Signals The indicator uses the price/volume values to generate signals: ED – excess demand. E
The utility refers to probabilistic analysis tools, in particular the Monte Carlo method. The Monte Carlo method is defined as the simulation of processes in purpose to evaluate their probabilistic characteristics and apply them to the solvable task. Operation features The simulation uses a tick model with the subsequent transformation to the candles form, as a model as close as possible to the real market process. The utility generates a stream of a random tick sequence until a result with the
The indicator calculates volume profiles dynamically and displays the result as VAL, VAH and POC curves. Indicator features The indicator uses the historical data of the lower (relative to the current) timeframes for calculations: M1 - for timeframes up to H1, M5 - for timeframe H1, M15 - for timeframe H4, H1 - for timeframe D1, H4 - for timeframe W1, D1 - for timeframe MN. The color of the DPOC curve sections is determined by comparing the volume of the POC levels of all profiles that make up
Neural Predictor MT4
Evgeny Shevtsov
2 (1)
The indicator refers to the means of probabilistic analysis. Prediction is performed by the Monte Carlo method together with a mathematical model of a neuron. But, the modeling of samples for this method is made not artificially, but comes from the original "nature", that is, from history. The number of samples and the detail of their modeling is achieved using the lower (relative current) timeframe. Indicator algorithm : In general terms, the algorithm boils down to the fact that the indica
BoxChart MT5
Evgeny Shevtsov
5 (7)
The market is unfair if only because 10% of participants manage 90% of funds. An ordinary trader has slim changes to stand against these "vultures". This problem can be solved. You just need to be among these 10%, learn to predict their intentions and move with them. Volume is the only preemptive factor that faultlessly works on any timeframe and symbol. First, the volume appears and is accumulated, and only then the price moves. The price moves from one volume to another. Areas of volume accumu
AnyProfile MT5
Evgeny Shevtsov
5 (17)
The indicator displays market profiles of any duration in any place on the chart. Simply create a rectangle on the chart and this rectangle will be automatically filled by the profile. Change the size of the rectangle or move it - the profile will automatically follow the changes. Operation features The indicator is controlled directly from the chart window using the panel of buttons and fields for entering parameters. In the lower right corner of the chart window there is a pop-up "AP" button
Market Marker MT5
Evgeny Shevtsov
3.8 (5)
The indicator displays peak levels of activity formed by the maximum volume, tracks the correlation of the candles on all timeframes (from the highest to the lowest one). Each volume level is a kind of key trading activity. The most important cluster is inside a month, week, day, hour, etc. Indicator operation features A volume level receives Demand status if the nearest volume level located to the left and above has been broken upwards. A volume level receives Supply status if the nearest volu
The utility refers to probabilistic analysis tools, in particular the Monte Carlo method. The Monte Carlo method is defined as the simulation of processes in purpose to evaluate their probabilistic characteristics and apply them to the solvable task. Operation features The simulation uses a tick model with the subsequent transformation to the candles form, as a model as close as possible to the real market process. The utility generates a stream of a random tick sequence until a result with th
Time And Sales Delta
Evgeny Shevtsov
5 (2)
The indicator displays the delta and the cumulative delta based on the "Time & Sales" deals list data. In addition to the standard timeframes, the indicator displays data regarding the seconds timeframes (S5, S10, S15, S20, S30) to choose from. Using the rectangle, user can select an arbitrary area in the indicator subwindow to view the ratio of the volumes of deals of buyers and sellers within this area. Indicator features: The indicator works correctly only on those trading symbols for which
Dynamic POC MT5
Evgeny Shevtsov
5 (1)
The indicator calculates volume profiles dynamically and displays the result as VAL, VAH and POC curves. Indicator features The indicator uses the historical data of the lower (relative to the current) timeframes for calculations: M1 - for timeframes up to H1, M5 - for timeframe H1, M15 - for timeframe H4, H1 - for timeframe D1, H4 - for timeframe W1, D1 - for timeframe MN. The color of the DPOC curve sections is determined by comparing the volume of the POC levels of all profiles that make up
The indicator refers to the means of probabilistic analysis. Prediction is performed by the Monte Carlo method together with a mathematical model of a neuron. But, the modeling of samples for this method is made not artificially, but comes from the original "nature", that is, from history. The number of samples and the detail of their modeling is achieved using the lower (relative current) timeframe. Indicator algorithm : In general terms, the algorithm boils down to the fact that the indica
The indicator colors the candles relative to their volume delta. The calculation of the candles delta is based on the tick history or on the deals tape history (see below for a description of the input variable "Volumes"). Coloring is performed by two parameters : by delta sign, as candle color, by delta value, as candle color contrast against chart window background color. In addition to coloring the candles, the indicator also displays the delta profile on the interval specified by the user
Filtro:
Sem comentários
Responder ao comentário