Manzano Index Intelligence

Manzano Index Intelligence

Analysis of the underlying constituents of the Nasdaq 100, S&P 500 and Dow Jones 30 for MetaTrader 5

It is not just about knowing where an index is moving, but understanding what is driving that move.

BEFORE BUYING OR TRYING: CHECK YOUR BROKER

The indicator requires your broker to provide both the index CFD and CFDs for its constituent stocks within the same MT5 account. Having a Nasdaq 100, S&P 500 or Dow Jones 30 CFD does not necessarily mean the broker also offers its constituents: some brokers provide nearly all US stocks, while others offer only a subset.

Run the free Manzano Index Coverage Checker before trying or purchasing the indicator. Drag it onto any chart. For each index, it displays the detected index CFD and its broker-specific symbol, the number of available stocks, the percentage of index weight covered, the most important missing stocks and a clear verdict:

  • Compatible: 85% or more of the index weight, with the index CFD detected. The indicator can operate with its full level of detail.
  • Limited: from 60% to less than 85%. The indicator operates, but its readings are approximate because important companies are missing.
  • Not compatible: less than 60% of the index weight, or no index CFD detected. We do not recommend using it with that broker.

What matters is covered index weight, not simply the number of stocks: having 77 of the Nasdaq 100's 101 constituents may represent 88% of the index if the largest companies are available. Coverage is assessed separately for each index: a broker may be compatible with the Nasdaq 100 but not the S&P 500.

Free download, installation guide and examples: Broker Compatibility Checker and Guide.

Index and stock symbol names are detected automatically (NDX, NAS100, US100, USTEC, Nas100.cash, US500, SPX500, US30, DJ30, AAPL, AAPL.US, #AAPL, AAPL_US...). If your broker uses unusual names, you can specify them in the inputs.

WHAT IS REALLY HAPPENING BEHIND AN INDEX?

An index price is the combined result of hundreds of companies, but it does not reveal which companies are moving it, how many are participating or whether the broader market supports the move. An index can rise while most of its stocks fall because three or four giants are driving it. It can also trade sideways while its constituents move sharply in opposite directions.

These are particularly relevant situations for index traders: a rally supported by the broad market generally has a different foundation from one sustained by only a handful of names. When the price rises but fewer stocks participate, the move is losing breadth.

Manzano Index Intelligence looks inside the index and displays this information in real time, calculated within MetaTrader 5 using your own broker's data. No DLLs, external connections or additional files are required.

TRADING HOURS

The panel uses the US regular cash session (9:30 a.m.–4:00 p.m. New York time), automatically converted to your broker's server time, including US and European daylight saving time changes.

If your broker quotes stocks during premarket or after-hours trading, the indicator begins working in premarket: it reads the stocks trading outside regular hours and shows their movement since the previous regular-session close.

If your broker does not provide out-of-hours stock quotes, outside the regular session you will see how far the index has moved since the cash close and a complete snapshot of the previous session. Live internal metrics begin at the New York open.

As in financial news and professional terminals, all percentage changes are measured from the previous regular-session close (4:00 p.m. New York time). They may therefore differ from the daily change shown by your broker, which often starts at server midnight. Hover over the header figure to see both reference points.

FIVE MAIN VIEWS

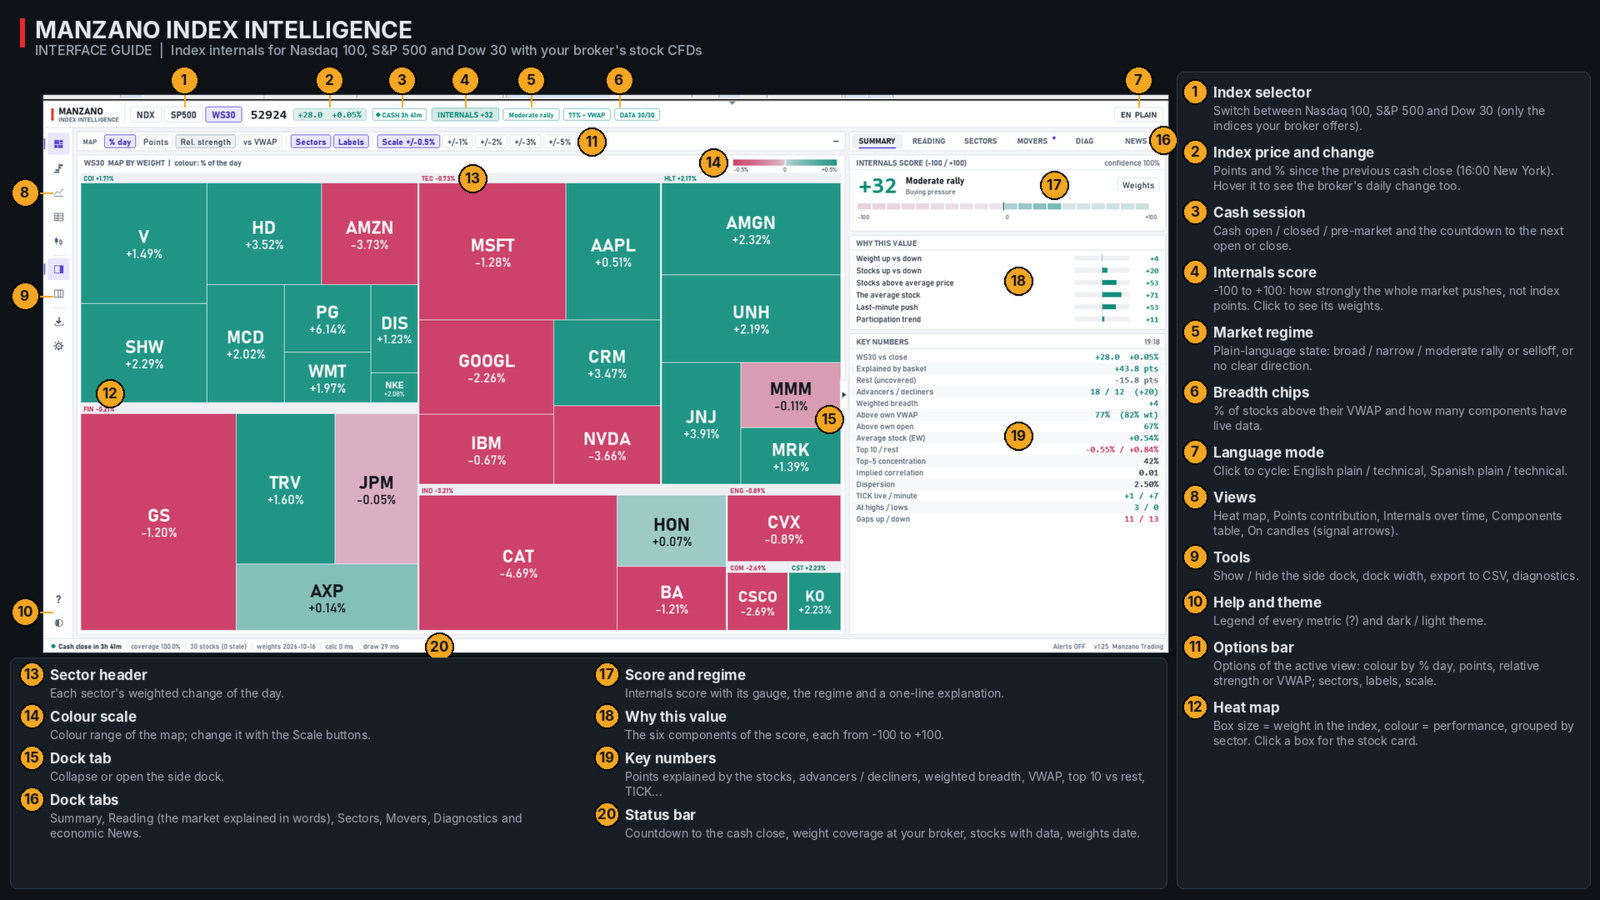
  • Heatmap. Each company appears as a tile sized according to its index weight and grouped by sector. Color can represent its daily percentage change, index-point contribution, relative strength versus the index or distance from VWAP. At a glance, see where the market's strength or weakness is concentrated and whether it affects the stocks that carry the most weight. Click a tile to open the stock's detail view and intraday chart.
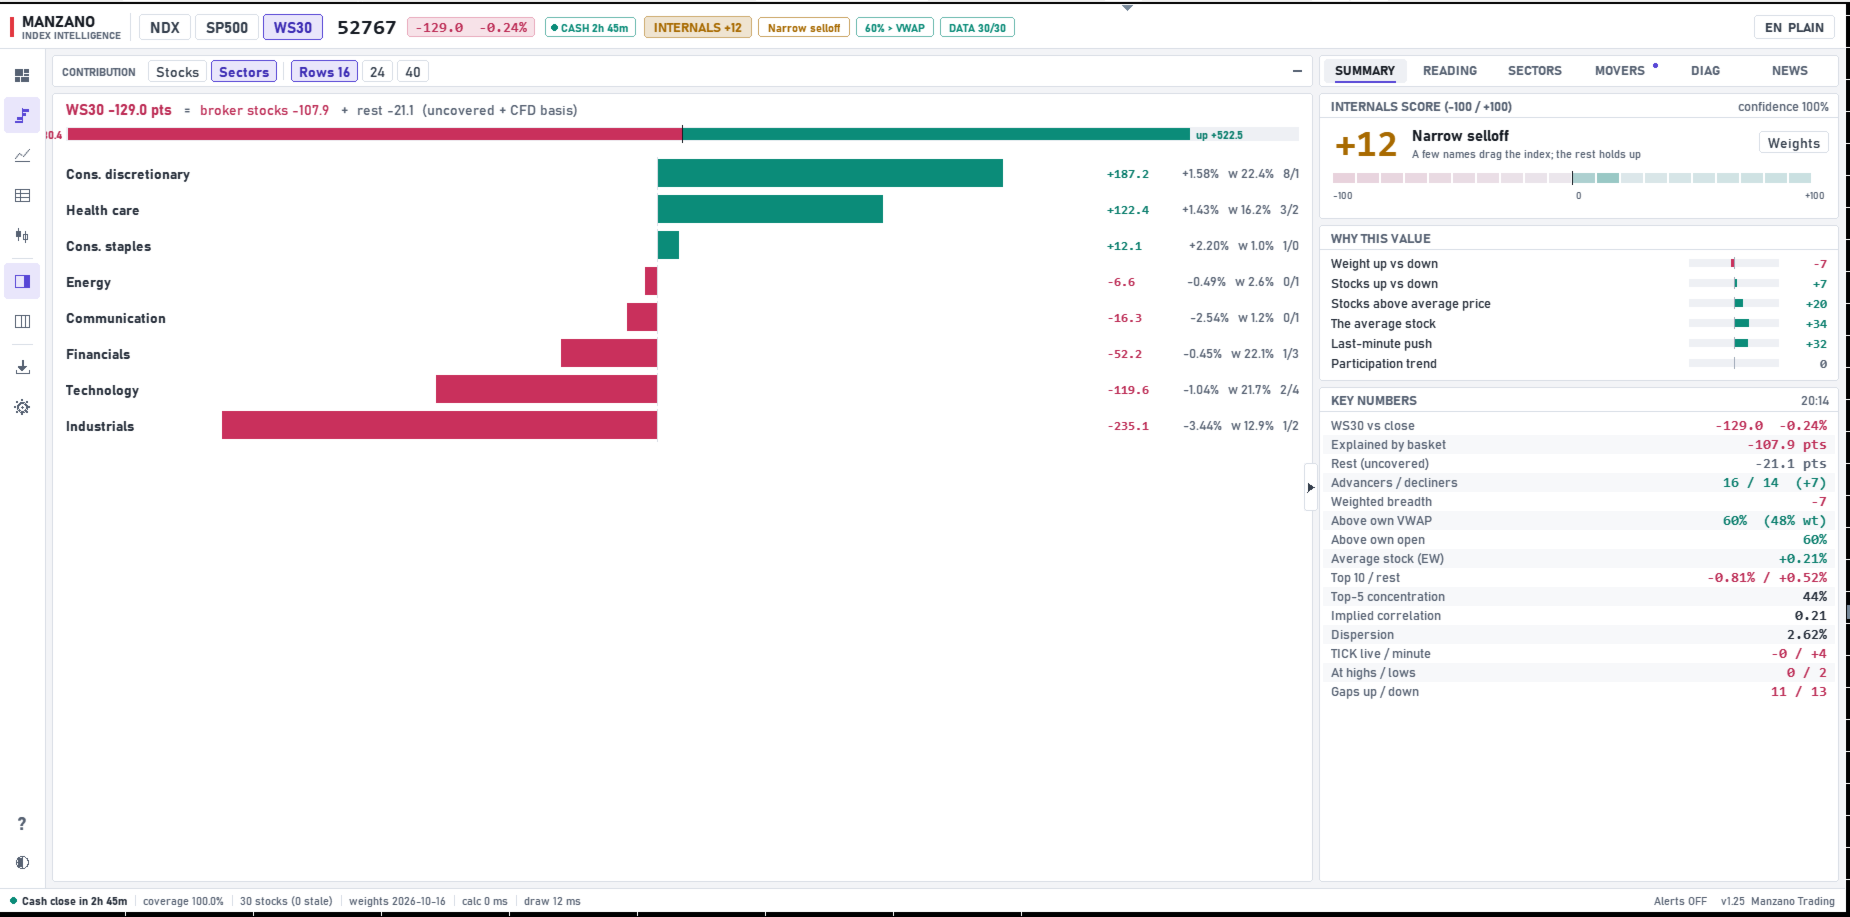
  • Contribution. Bars show how many index points each stock adds or subtracts, ranked from largest positive to largest negative contribution. The header displays the index's point movement, the portion explained by the stocks available from your broker and the remainder. Quickly identify what is moving the index. A sector-level view is also available.
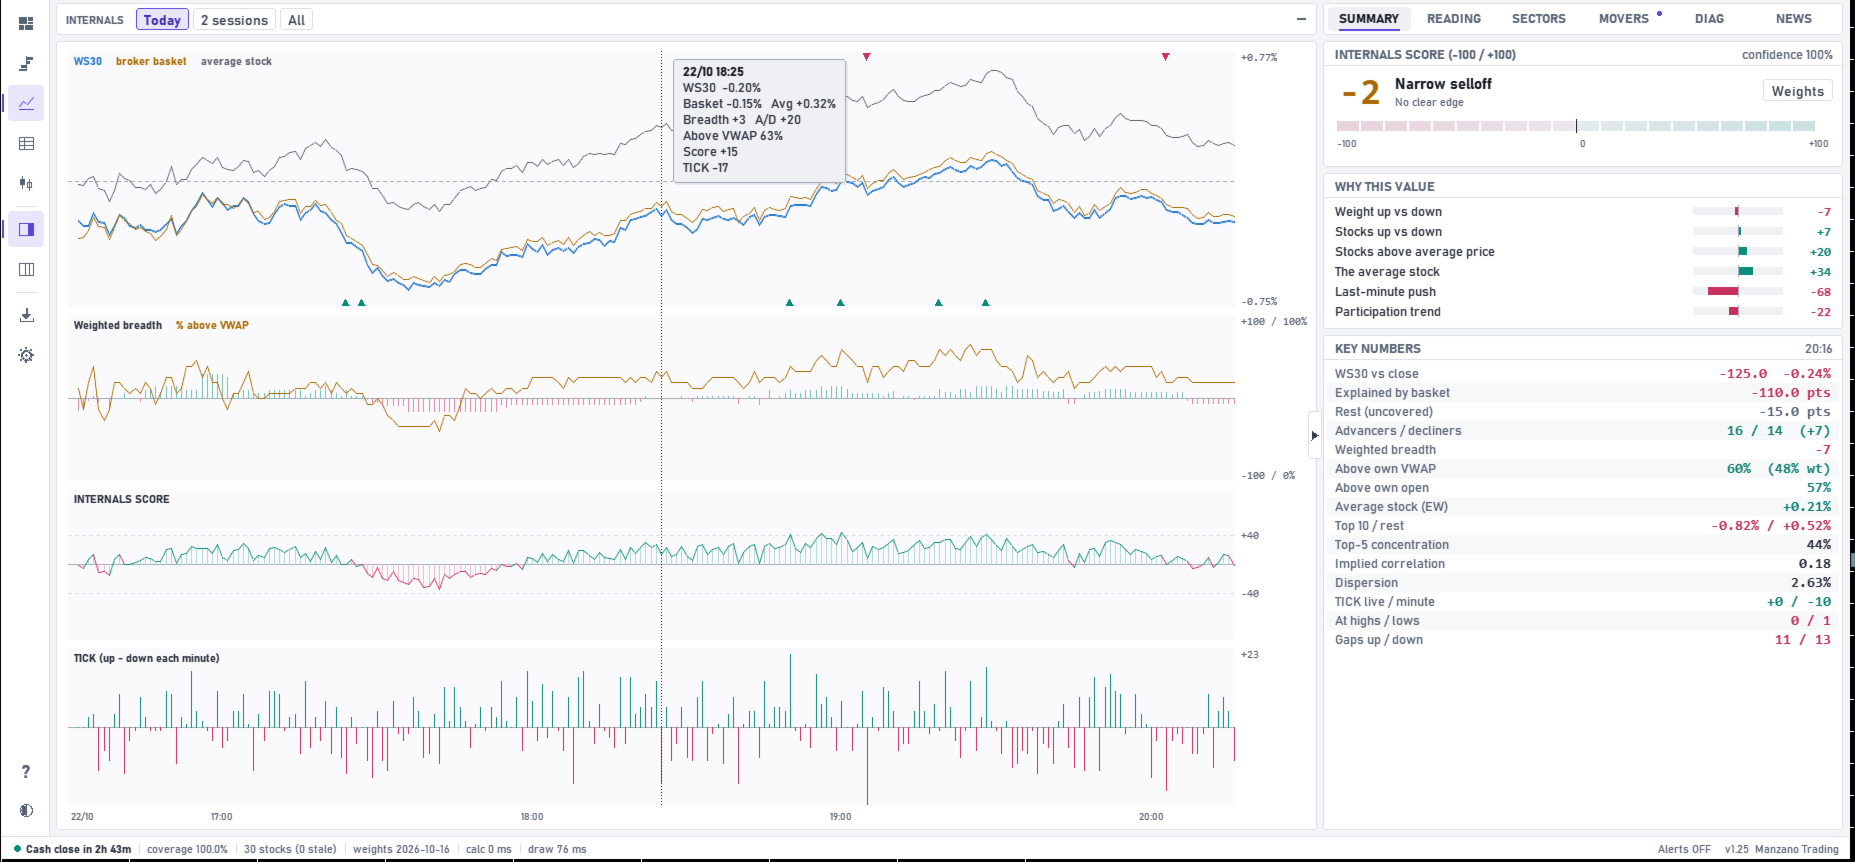
  • Internals Over Time. Four session charts: the index versus your broker's stock basket and the average stock; weighted breadth and the percentage of stocks above VWAP; the Internals Score; and minute-by-minute TICK. Signals are marked, and hovering reveals details for each minute. Display today's session, two sessions or all loaded history.
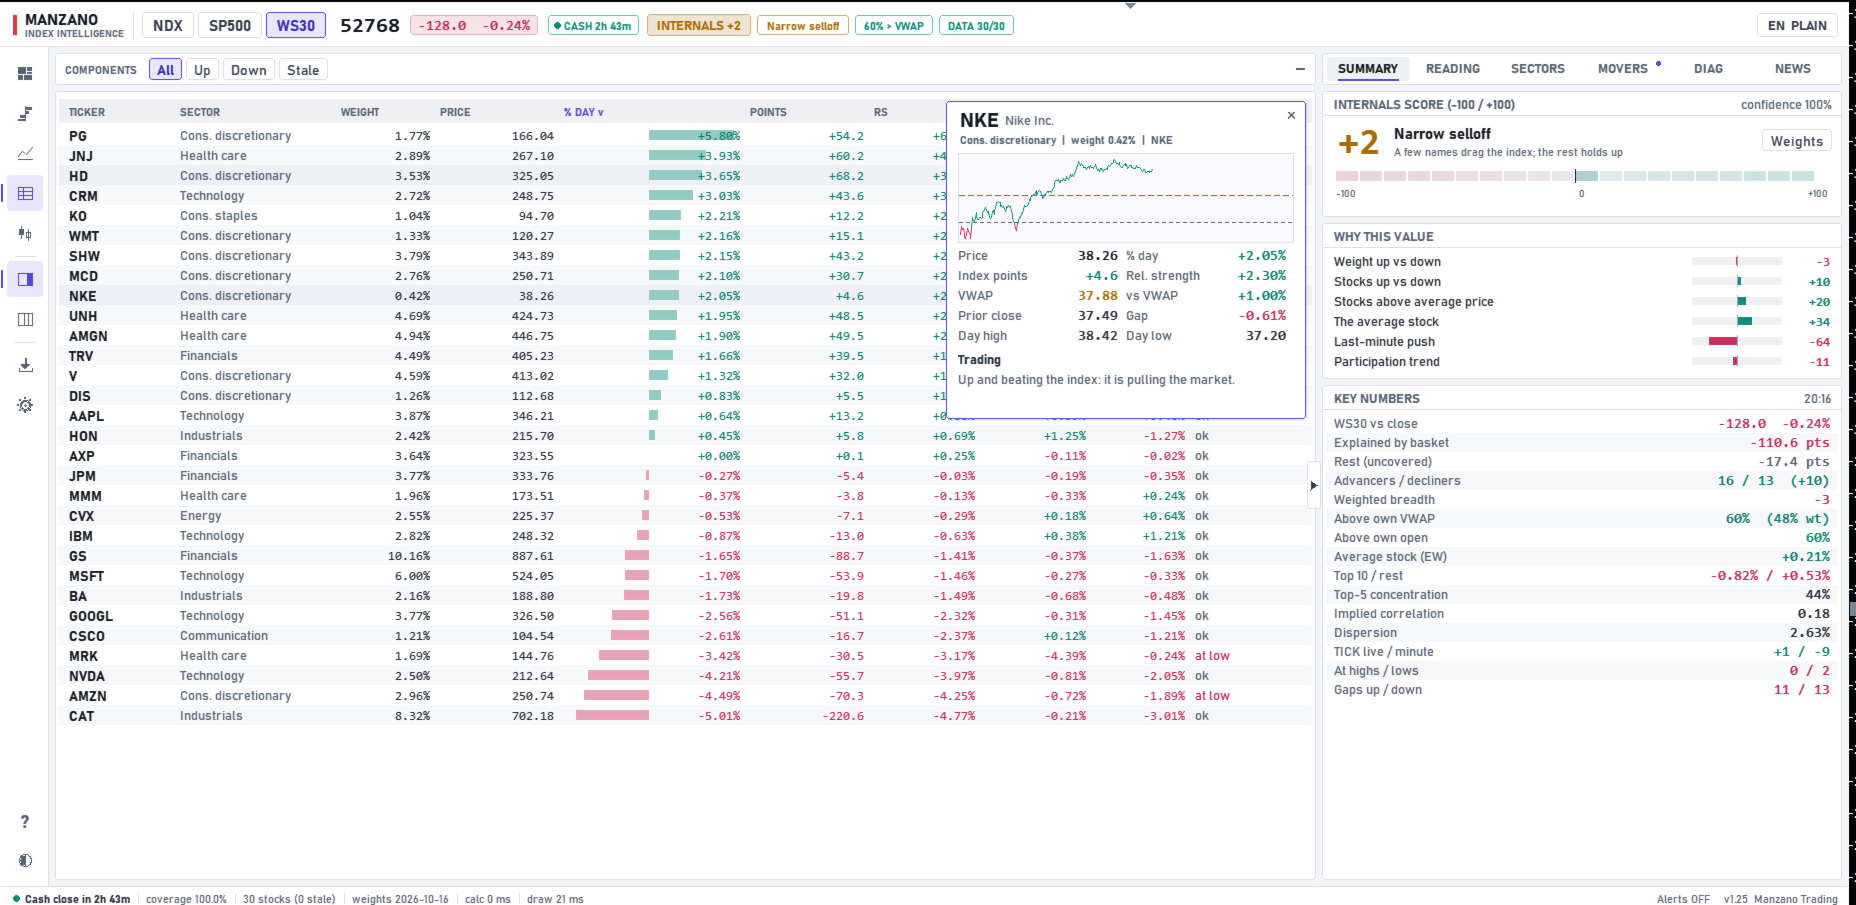
  • Constituent Table. All stocks with their weights, changes, point contributions, relative strength, distance from VWAP and opening gaps. Sort by any column and filter rising, falling or unquoted stocks.
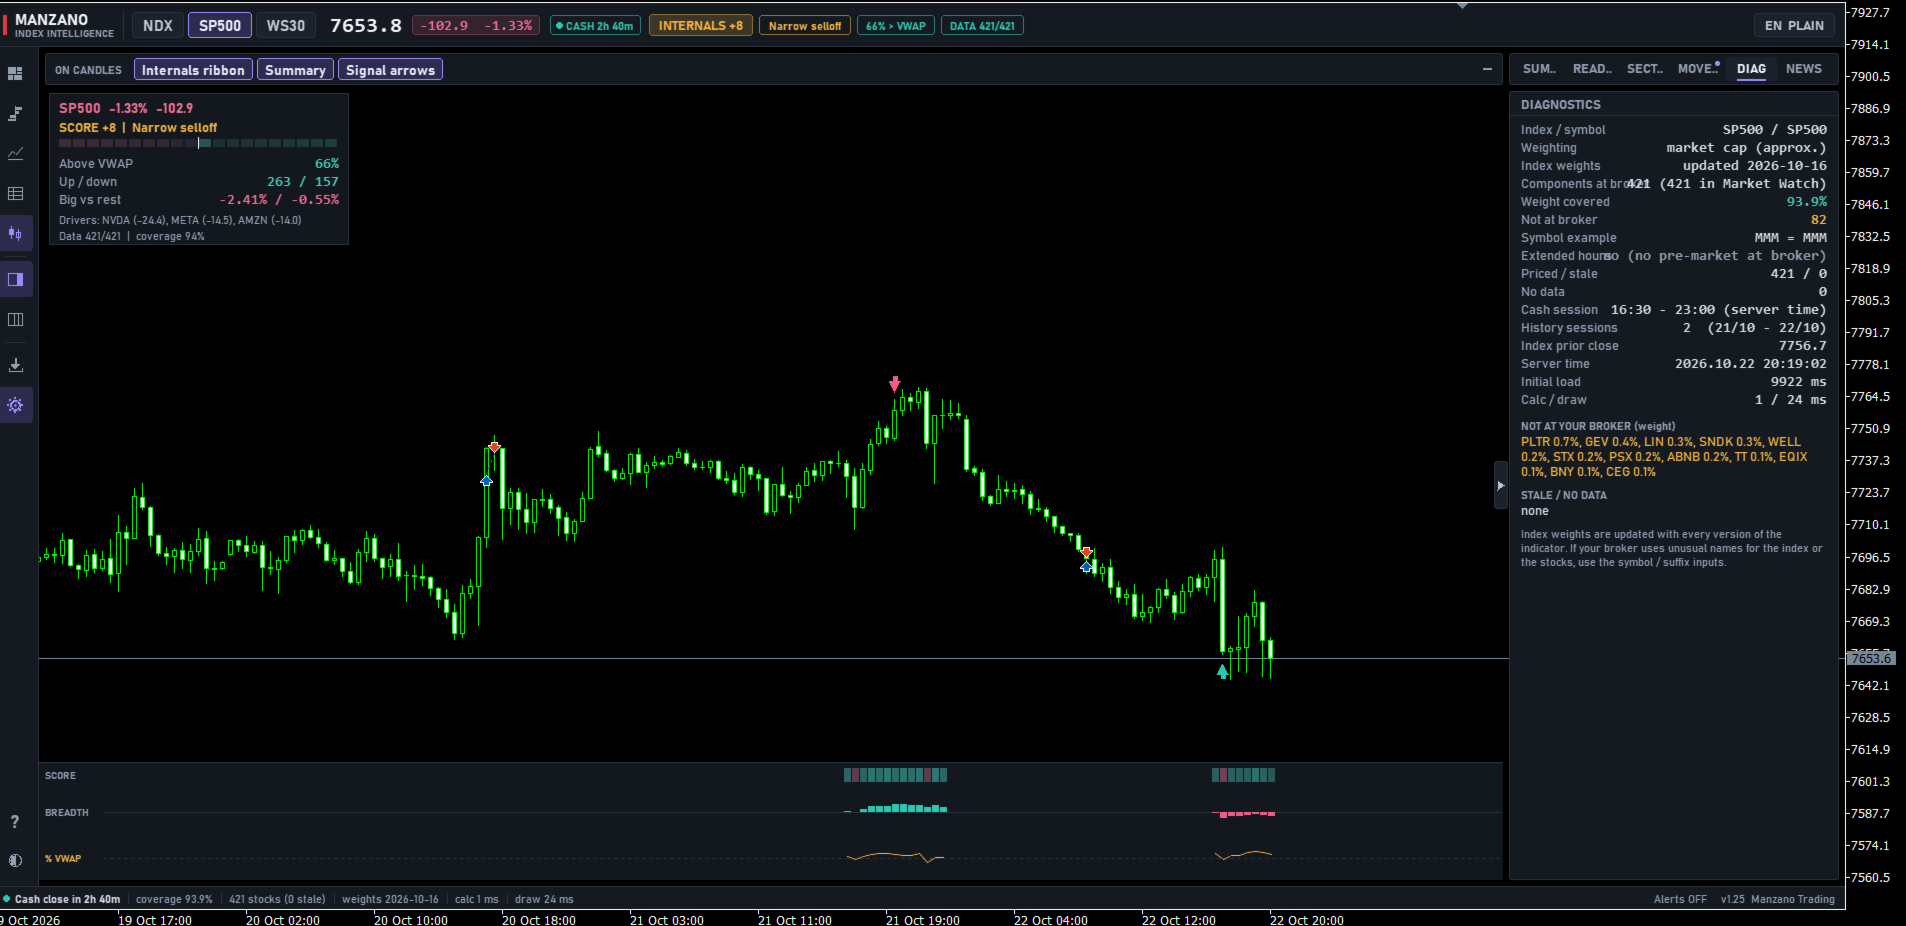
  • Candlestick View. An index candlestick chart with signal arrows, a lower ribbon showing the score, breadth and percentage above VWAP aligned with each candle, and a corner summary. Switching to this view automatically changes the chart to the selected index.

SIDE PANEL

  • Summary. Internals Score from -100 to +100, market regime, an explanation of the score (six components, each ranging from -100 to +100), and key metrics: index points explained by the basket, advancing and declining stocks, weighted breadth, percentage above VWAP and above the open, average stock, mega-caps versus the rest, concentration, implied correlation, dispersion, TICK, stocks at highs or lows, and gaps.
  • Interpretation. A plain-language explanation of the market, like a fellow trader at your desk: current situation, key index drivers, participation, mega-caps versus the rest, momentum, regime, recent signals, conclusion and coverage. Four modes: simple Spanish, technical Spanish, simple English and technical English. Simple mode explains unfamiliar concepts; technical mode is more concise.
  • Sectors. Each sector's performance, weight, point contribution and advancing/declining stock counts, making it easier to see which areas are driving or holding back the market and whether activity is rotating toward defensive sectors.
  • Drivers. The stocks adding and subtracting the most points, the strongest and weakest relative to the index, and the day's signal log.
  • News. The built-in MT5 economic calendar in your broker's server time, showing the next high-impact release with a countdown and actual, forecast and previous values.
  • Diagnostics. The detected index symbol, available stocks, covered index weight and missing constituents, so you always know which data the analysis is based on.

HOW TO READ THE INTERNALS SCORE

The score summarizes the market's underlying participation on a scale from -100 to +100. These are not index points. It combines the weight of rising versus falling stocks, advancing versus declining stock counts, the percentage trading above their intraday volume-weighted average price, average-stock performance, the most recent minute's momentum and the trend in participation.

  • Above +40, with most index weight positive: a broadly supported advance.
  • +20 to +40: an advance with moderate internal support.
  • -20 to +20: no clear advantage in market internals.
  • -40 to -20: a decline with moderate internal support.
  • Below -40, with most index weight negative: broad-based selling.

When the index and its internal metrics move in opposite directions, the panel identifies a narrow advance or decline: a few large companies are moving the index while the rest of the market is not following.

NON-REPAINTING SIGNALS

The indicator marks significant changes in index internals on both the internals view and the candlestick chart:

  • Bearish divergence: the index makes a new high with less participation than at the previous high.
  • Bullish divergence: the index makes a new low with fewer stocks declining than at the previous low.
  • Internals Score threshold: the score crosses above or below a selected level, indicating broad participation in one direction.
  • Breadth thrust: more than 80%, or fewer than 20%, of stocks trade above their VWAP.
  • Concentrated advance or decline: the index moves more than 0.4% while the average stock moves in the opposite direction.
  • Extreme TICK: nearly all stocks rise or fall together during the same minute.

Each signal is calculated using closed M1 candles only. Once plotted, it does not move or disappear, and the same signals are reproduced when the indicator is reloaded. On the candlestick chart, two consecutive arrows in the same direction are not repeated.

ECONOMIC CALENDAR

Macroeconomic releases (CPI, employment reports, Federal Reserve decisions, etc.) can move indices more strongly than any internal reading. The indicator uses MetaTrader 5's built-in economic calendar in your broker's time zone. It shows the next high-impact release in the header with a countdown, adds a warning to the interpretation when a release falls within the preceding or following 30 minutes—when internals can become less reliable—and marks published events on the internals chart.

FOR EXPERT ADVISORS

12 non-repainting buffers accessible via iCustom, with one value per candle: 0 buy arrow, 1 sell arrow, 2 signal code, 3 Internals Score, 4 index percentage change, 5 broker basket percentage change, 6 average stock percentage change, 7 weighted breadth, 8 percentage of stocks above VWAP, 9 A/D, 10 TICK and 11 index level. We recommend reading bar 1, the most recently closed candle.

WHAT CAN YOU USE IT FOR?

  • Determine whether an index move is supported by the broad market or just a few companies.
  • Avoid chasing advances or declines driven by only a handful of mega-caps, which may reverse quickly.
  • Spot when price and market participation begin to diverge.
  • Identify which companies and sectors explain the day's index movement.
  • Stay aware of economic releases that may disrupt market behavior.
  • Complement index technical analysis with information from the underlying constituents.

For example, a Nasdaq 100 rally in which 80% of index weight is advancing and most stocks trade above VWAP has a very different internal structure from a rally driven by only three mega-caps while the average stock declines.

INSTALLATION

  1. Run the free compatibility checker with your broker (link above).
  2. Attach the indicator to any chart. It automatically detects the index and its constituents and adds the stocks to Market Watch.
  3. On first launch, it downloads M1 history for each constituent. This may take some time, especially for the S&P 500 with approximately 500 stocks. Progress is shown on the panel.
  4. Switch indices, views and languages from the panel. Your chosen interface settings and language are remembered.

Index weights are updated with each new indicator version.

MAIN INPUT PARAMETERS

Initial index and symbol names (blank = automatic detection), stock symbol suffix, regular-session hours (blank = automatic), historical sessions, language and explanation mode, initial view, theme and colors, economic calendar (enable, minimum importance, hours ahead), signal arrows, alerts and push notifications.

IMPORTANT CONSIDERATIONS

This is an analytical tool, not an automated trading system. It does not place trades, guarantee profits or predict market direction with certainty. Divergences and signals provide context; they are not standalone trade-entry instructions.

Results may vary between brokers due to available symbols, constituent coverage and quote quality.

Questions and support: please send me a private message on MQL5.

Manzano Trading

おすすめのプロダクト
SMC Alpha Engine SMC Alpha Engine is a Smart Money Concepts indicator for MetaTrader 5 designed to identify Order Blocks, Fair Value Gaps, Liquidity Sweeps, and market structure changes directly on the chart. The indicator focuses on displaying the most recent valid Order Block together with automatically calculated TP and SL levels for simplified chart analysis. Main Features Automatic Order Block detection Buy and Sell zone visualization Automatic TP and SL calculation Fair Value Gap (FVG) det
Xerxes Quantum Vanguard The Omni-Asset Hybrid Daily Action System (Trend + Mean Reversion | Multi-Asset ATR Logic | Quantum Dashboard)  Conquer Every Market Condition Xerxes Quantum Vanguard is not a single-strategy robot. It is a dual-core Hybrid Trading System- engineered for the active trader who demands daily market action. By seamlessly combining Trend Breakout- and Mean Reversion- algorithms, Xerxes adapts to whatever the market throws at it. Built from the ground up to support multiple
Phantom Edge SMC — The Ultimate Smart Money Indicator for MT5 Tired of manually drawing structures while trading SMC or ICT concepts? Let Phantom Edge SMC do the heavy lifting for you. Key Features Internal & Swing Structure: Automatically detects BOS and CHoCH across two structural levels. Order Blocks (OB): Identifies Internal and Swing OBs with automated mitigation tracking. Equal Highs / Lows: Highlights EQH / EQL to pinpoint Liquidity pools. Fair Value Gaps (FVG): Displays FVGs with
概要 このインジケーターは、クラシックな ドンチャンチャネル を強化したバージョンで、実践的なトレード機能を追加しています。 標準の3本線(上限、下限、中央線)に加え、 ブレイクアウト を検出し、チャート上に矢印で視覚的に表示します。また、チャートを見やすくするために、 現在のトレンド方向と逆側のラインのみを表示 します。 インジケーターの機能: 視覚的シグナル :ブレイクアウト時にカラフルな矢印を表示 自動通知 :ポップアップ、プッシュ通知、Eメール RSIフィルター :市場の相対的な強弱に基づいてシグナルを検証 カスタマイズ可能 :色、ラインの太さ、矢印コード、RSI閾値など 動作原理 ドンチャンチャネルは次のように計算します: 上限線 :直近N本のクローズ済みローソク足の最高値 下限線 :直近N本のクローズ済みローソク足の最安値 中央線 :最高値と最安値の平均値 上方ブレイクアウト は終値が上限線を超えたときに発生し、 下方ブレイクアウト は終値が下限線を下回ったときに発生します。 インジケーターは以下を行います: 3本のドンチャンラインを描画 方向転換後の最初のブレイクアウト
FREE
TrendVision AI
Murtadha Majid Jeyad Al-Khuzaie
TrendVision AI – Smart Trend Channels & Price Forecasting for MetaTrader 5 Discover market structure and explore potential future price direction with TrendVision AI, an advanced technical indicator for MetaTrader 5 that combines automatic trendline analysis with a machine-learning-based price forecasting model. How Does TrendVision AI Work? TrendVision AI analyzes historical candlestick data within a configurable lookback window. It automatically draws two trendlines directly on the chart:
FREE
Apex Point is a trend-following indicator for MetaTrader 5, transforming complex market data into signals for traders. It displays blue dots for uptrends, red dots for downtrends, and yellow crosses at potential reversals, helping users identify momentum shifts quickly. Key features include a confirmation system requiring multiple bars (default: 3) to validate changes, reducing false signals; dynamic ATR-based offsets for adaptive trailing, with instant ratcheting in the trend direction and smo
FREE
HMA Scalper Pro EA
Vladimir Shumikhin
5 (2)
HMA Scalper Pro EA — Hull Moving Average (HMA) インジケーターに基づく MetaTrader 5 用自動売買アドバイザー 概要 HMA Scalper Pro EA は、Hull Moving Average (HMA) の方向にトレードする MetaTrader 5 用のプロフェッショナルなトレーディングロボット(Expert Advisor)です。HMA インジケーターは現在のトレンド方向を判定し、アドバイザーはその方向にトレードを執行し、Smart Risk キャピタルマネジメント、アダプティブグリッドトレーディング、トレイリングストップ、ブレイクイーブン、タイムフィルターでエントリーを補完します。 このアドバイザーは Netting アカウントと Hedging アカウントの両方をサポートし、金(XAU/USD)、外国為替通貨ペア、原油、指数、暗号資産の取引に適しています。 HMA SCALPER PRO EA を選ぶ理由 - Hull Moving Average シグナル — HMA の方向に基づくエントリー。HMA
Market Maestro: Your Ideal Partner for Automated Forex Trading If you're looking for a reliable assistant for trading in the currency market, Market Maestro is exactly what you need. This modern Forex bot is built using the latest technologies and algorithms, allowing it to effectively analyze market data and make informed trading decisions in real-time. Key Features of Market Maestro 1. Multicurrency Capability for Broad Opportunities Market Maestro can work with a wide range of currency pairs,

NHK Local Time Scale NHK Local Time Scale displays your PC/local time directly on the MT5 chart , alongside the broker's native chart time. The trader can easily compare both time zones for any candle. Benefits for Traders: Quickly convert Broker Time ↔ Local/PC Time . Helps accurately set News Stop/News Filter times. Makes London, New York, Asian and other trading sessions easier to identify in your local time. Helps verify that EA session and news time settings are correct. Reduces mistakes ca
FREE
RBreaker Gold Indicatorsは、金先物の短期日内取引戦略であり、トレンドフォローと日内反転の2つの取引手法を組み合わせたものです。トレンド相場での利益を捉えるだけでなく、相場が反転した際には迅速に利確し、その流れに沿ってポジションを反転させることができます。 この戦略は、アメリカの雑誌『Futures Truth』において、15年連続で最も収益性の高い取引戦略トップ10に選ばれた実績を持ち、非常に長いライフサイクルを誇り、現在も国内外で広く使用・研究されています。 本インディケーターは、2026年の金先物の値動きに対応し、14日間のATR指標に基づいて、ブレイクアウト係数A、観察係数B、リバーサル係数Rをより合理的な値で定義しています。非常に優れたインディケーターであり、安定的な年間収益を実現しています。ぜひおすすめします〜
Aureus Trader is an automated scalping robot for MetaTrader 5 designed to trade actively on liquid forex and crypto pairs with strict risk control and low latency execution. ​ What Aureus Trader does Aureus Trader focuses on short-term price movements, opening and closing trades frequently during high-liquidity sessions. ​ The algorithm uses technical filters to avoid abnormal spreads and low-volatility periods, aiming to capture quick intraday moves rather than long trends. ​ Risk management T


PROMETHEUS TECHNICAN VERSION Free | By THE SONS A gift from The Sons — no strings, no trial, no expiry. Every trader deserves access to professional-grade market intelligence. That belief is why Prometheus Technical Version exists, and why it costs nothing. Consider it our handshake to the trading community. What You're Getting This is not a simplified tool dressed up as a gift. Prometheus Technican Version is a fully built, institutional-quality technical analysis indicator running a dual-model
FREE
CosmiCLab SMC FIBO CosmiCLab SMC FIBO is a professional trading indicator designed for traders who use Smart Money Concepts (SMC), market structure analysis and Fibonacci retracement levels. The indicator automatically detects market swings and builds Fibonacci levels based on the latest impulse movement. It also identifies market structure changes such as BOS (Break of Structure) and CHOCH (Change of Character), helping traders understand the current market direction. CosmiCLab SMC FIBO also pr
Gold EA: Proven Power for 1-Minute Gold Trading Transform your trading with our Gold EA, meticulously crafted for 1-minute charts and delivering over 2000% growth in 5 years from just $100-$1000 . No Martingale, No AI Gimmicks : Pure, time-tested strategies with robust money management, stop loss, and take profit for reliable performance across multiple charts. Flexible Trading Modes : Choose Fixed Balance for safe profits, Mark IV for bold growth, or %Balance for high rewards—combine Mark IV an
Magic EA MT5
Kyra Nickaline Watson-gordon
Magic EA is an Expert Advisor based on Scalping, Elliot Waves and with filters such as RSI, Stochastic and 3 other strategies managed and decided with the robot smartly. Large number of inputs and settings are tested and optimized and embedded in the program thus inputs are limited and very simple. Using EA doesn't need any professional information or Forex Trading Knowledge. EA can trade on all symbols and all time frames, using special and unique strategies developed by the author. The EA w
ONNYX INDICATOR バージョン 1.14 MetaTrader 5 用のサプライ・デマンド分析インジケーターです。確定したスイングからゾーンを作成し、ATR で幅を調整し、品質をパーセント表示します。確定足の BUY/SELL シグナルは後から消えない設計です。 主な機能 - ゾーン内に品質パーセントを表示するサプライ・デマンドゾーン。 - 確定足で表示される大きな BUY/SELL 矢印。 - EMA トレンドフィルターとローソク足反発確認。 - トレンド、価格レベル、市場状況パネル。 - 関連する経済指標を最大5件表示。発表前は Forecast/Previous、発表後は Actual を表示。 - 60秒ごとのニュース更新とストラテジーテスター用カレンダーキャッシュ。 - ポップアップ、プッシュ、メール通知。 - iCustom 用バッファ:0=BUY価格、1=SELL価格。 使用方法 チャートに適用し、履歴の読み込みを待ってから、トレンドと有効ゾーンを確認し、確定足シグナルを独自のリスク管理と組み合わせてください。XAUUSD H1 は見やすい構造、M15 はより
Free automatic Fibonacci is an indicator that automatically plots a Fibonacci retracement based on the number of bars you select on the BarsToScan setting in the indicator. The Fibonacci is automatically updated in real time as new highest and lowest values appears amongst the selected bars. You can select which level values to be displayed in the indicator settings. You can also select the color of the levels thus enabling the trader to be able to attach the indicator several times with differe
FREE
The Bitcoin Reaper
Profalgo Limited
3.71 (34)
発売プロモーション: 現在の価格で入手できるコピーの数はごく限られています。 最終価格: 999ドル 新規 (349 ドルから) --> 1 EA を無料で入手 (取引口座番号 2 つ)。 究極のコンボディール   ->   こちらをクリック 公開グループに参加する: ここをクリック   LIVE SIGNAL LIVE SIGNAL V2.0 UPDATE 2.0 INFO BITCOIN REAPER へようこそ!   Gold Reaper が大成功を収めた後、同じ勝利の原則を Bitcoin 市場に適用する時が来たと判断しました。そして、それは非常に有望に見えます!   私はこれまで 20 年以上にわたってトレーディング システムを開発してきましたが、私の専門分野は「断然」ブレイクアウト戦略です。 このシンプルながらも効果的な戦略は、常に最高の取引戦略の上位にランクインしており、基本的にあらゆる市場に適用できます。     特にビットコインのような変動の激しい市場では、真価を発揮します。   それで、この戦略はどのように機能するのでしょうか? ブレイクアウト戦略は、重要なサ
TradeVisonPro Forex Analyzer Pro MT5取引口座分析・モニタリングダッシュボード TradeVisonPro Forex Analyzer Proは、MetaTrader 5ユーザー向けに設計された取引分析および口座モニタリングソリューションです。 本製品は、MT5の取引データを構造化されたWebダッシュボードに整理し、口座情報の確認、保有ポジションの監視、取引履歴の分析、戦略の追跡、トレードジャーナルの記録、パフォーマンス統計の確認を可能にします。 TradeVisonPro Forex Analyzer Proは、取引情報を整理し、対応するデスクトップおよびモバイルWebブラウザからアクセスできるようにすることを目的としています。 主な機能 • MT5口座ダッシュボード • 保有ポジション監視 • 取引履歴分析 • トレードカレンダー • 戦略追跡 • トレードジャーナル • 口座パフォーマンス統計 • パフォーマンスレポート • 取引通知 • 複数口座対応 • 共有可能な読み取り専用レポート MT5口座ダッシュボード MetaTrader 5取引口
FREE
My Grid Scalper
Ahmad Aan Isnain Shofwan
3 (2)
MyGrid スキャルパー あなたがそれを導くか、それがあなたを導くかのどちらかだ。 私は、2022年以来3万回以上ダウンロードされているMT4バージョンをベースにしたMT5バージョンを、宣伝や大々的な発表、割引などは一切行わずにリリースします。 このEAは無料で、今後もずっと無料です。このEAがもたらす善行や恩恵から得られる霊的な報酬は、来世で亡き母に捧げます 。 理解している人々の手による一貫した実行 基本情報 シンボル: 任意(デフォルトの最適化済みシンボル:XAUUSD) 時間枠: 任意(デフォルト最適化:M5) タイプ: ソフトマルチンゲールを用いたグリッドベースのEA(デフォルト値:1.5) ロット制御: 固定ロットの場合は乗数を1.0に設定します アカウントの種類: ECNを推奨しますが、必須ではありません。 ブローカー: どのブローカーでも可(スプレッドの低いブローカーが望ましい) ライブ配信とデモ配信に対応: バックテスト、フォワードテスト、最適化済み もう安心できる定番のパターンは卒業しましたか? 無料ツールは安心感を約束する。しかし、真のツールはコントロールを
FREE
Fvg Edge
Ahmad Meftah Abdulsalam Alawwami
5 (3)
FVG Smart Zones – 無料版 MetaTrader 5 (MT5)用 公正価値ギャップ(FVG)検出インジケーター ただのランダムなインジケーターではなく、 本格的なトレーディングツール をお探しですか? FVG Smart Zones – 無料版 は、公正価値ギャップ(FVG)を自動で検出し、チャート上に 高確率トレーディングゾーン をハイライトして、プロフェッショナルな市場の洞察を提供します。 以下のトレーダー向けに設計されています: スマートマネーコンセプト (SMC) ICTトレーディングコンセプト プライスアクション (Price Action) 需給分析 (Supply & Demand) 機関投資家向けトレーディング戦略 このインジケーターは、 価格が反応しやすいゾーン に集中するのを助けます。 主な機能 スマートゾーン検出 上昇・下降FVGの自動検出 クリーンでプロフェッショナルなビジュアルゾーン 弱い、または関連性の低いギャップを除去するインテリジェントフィルター 高度な確認機能 上位時間軸(HTF)
FREE
Smart Trendline Detector Smart Trendline Detector is an automatic multi-timeframe trendline analysis indicator for MetaTrader 5 that detects and ranks rising support and falling resistance structures using market swing points. Instead of filling the chart with every possible trendline, the indicator evaluates qualifying structures and displays only a controlled number of the strongest candidates according to configurable ranking criteria. The result is a cleaner chart with relevant trendline str
FREE
AURIC MOHD-iK is a dynamic, logic-based Expert Advisor (EA) engineered specifically for trading XAUUSD (Gold). Unlike standard trading systems that rely on lagging, unreliable indicators, this EA operates purely on clean price logic—executing trades the way an experienced human trader naturally reads the market. This version is completely free with limitations, offering permanent value to your trading setup with zero hidden costs. Active Auric Mode That's it!!!!!!!!!! Core Trading Parameters Ac
FREE
Hamster Scalping mt5
Ramil Minniakhmetov
4.72 (244)
Hamster Scalpingは、マーチンゲールを使用しない完全に自動化された取引アドバイザーです。夜のスキャルピング戦略。 RSIインジケーターとATRフィルターが入力として使用されます。アドバイザには、ヘッジ口座タイプが必要です。 実際の作業の監視、およびその他の開発については、https:// www.mql5.com/en/users/mechanic/sellerを参照してください 。 一般的な推奨事項 最小デポジット$ 100、最小スプレッドのECNアカウントを使用し、eurusd M5 gmt +3のデフォルト設定。 入力パラメータ EAは、4桁と5桁の両方の引用符で機能します。入力パラメータでは、5文字の値をポイントで示し、すべてを4文字で自動的に再計算します。 NewCycle-モードがオンの場合、アドバイザーは停止せずに動作します。モードがオフの場合、一連の取引の完了後、アドバイザーは新しい注文を開きません。 期間インジケーター1-最初のインジケーターの期間。 アップレベル-アドバイザーが売りを開始する最初のインジケーターの上位レベル。 ダウンレベル
Crystal Ball – Trend-Backed Mean Reversion EA for MT5 Crystal Ball is not just another trading robot—it's a precision engine designed to capture the market’s natural rhythm. By combining the pullback-catching power of Mean Reversion with the momentum-following logic of Trend Trading , Crystal Ball enters trades with intention and exits with purpose. It’s built to avoid random noise, capitalize on structure, and adapt as the market moves. How It Works Wait for Deviation: Crystal Ball wat
TITAN TREND ARCHITECT — The Ultimate Strategy Builder EA "Don't just buy an EA. Buy the Blueprint. Build Your Own Edge." > Inspired by the market's leading Strategy Builder EAs, but forged with TumWebTH's unmatched Aegis Shield technology. Are you tired of buying black-box Expert Advisors where you have no control over the entry logic? Titan Trend Architect- changes the game. It is a No-Code Strategy Builder- that allows you to Mix & Match Entry Triggers, Trend Filters, and Exit Logic direct
Caicai L&S Yield Histogram Important Notice: This indicator is an integral tool of the automated EA Caicai Long and Short Pair Trading . This indicator visually displays the percentage deviation (Yield %) of a pair's current spread relative to its own historical mean. It is an excellent tool for quickly visualizing the gross financial potential of a market distortion in Long & Short operations. Main Features: Percentage Visualization: Understand the size of the distortion in palpable percentage
MACD Sniper Pro is an advanced automated trading system designed for traders seeking high-precision entries and robust risk management. By combining the classic momentum of MACD Crossover with a strict ADX Volatility Filter and Dynamic ATR Management , this EA completely eliminates emotional trading and filters out dangerous flat/sideways markets. Unlike standard MACD indicators that suffer during consolidation, MACD Sniper Pro verifies trend strength before entering and protects your capital us
Ultimate ICT Gold Scalper v3.15 Advanced XAUUSD Scalping EA with ICT-Inspired Market Analysis, Liquidity, FVG, Order Blocks, Silver Bullet Sessions & Automated Risk Management BAKOME Ultimate ICT Gold Scalper v3.15 is an automated MetaTrader 5 Expert Advisor designed primarily for XAUUSD (Gold) scalping on the M5 timeframe . The EA combines ICT-inspired market analysis with volatility filtering, liquidity-level detection, Fair Value Gap analysis, Order Block detection, session-based trading, Sil
QM Gold Pattern EA Backtest results from 01/10/2021 to 01/10/2026 QM GOLD – QM HYBRID PRO EA V1.0 MT5 Expert Advisor trading based on the Quasimodo (QM) patternAn EA for MetaTrader 5 that automatically identifies QM patterns. It waits for the price to pull back to the zone before entering a trade. Every order includes a Stop Loss (SL), and lot sizes are automatically calculated based on risk. Why choose this EA? Not Martingale, Not Grid No
このプロダクトを購入した人は以下も購入しています
Boba Analysis Suite
Trade Ready Solutions LLC
5 (1)
Boba Analysis Suite Boba Analysis Suite は、MetaTrader 5 向けの分析インジケーターです。市場構造、重要な価格帯、相場全体の状況を、一つのチャート画面にまとめて表示します。 トレーダーおよびトレーディング指導者としての実務経験をもとに開発され、市場の方向性の評価、重要な価格水準の特定、複数の時間足を組み合わせた分析など、体系的な分析プロセスを支援します。 相場の背景を踏まえた分析 個々のシグナルの意味は、相場の状況によって変わります。Boba Analysis Suite は、現在のチャート状況をより大きな市場構造と関連付け、あらかじめ定めたルールに沿って取引アイデアを検討するための分析を支援します。 主な分析機能: トレンドと市場構造: 市場の方向性と、その背景にある構造を評価します。 重要な価格帯と価格水準: さらに分析すべき重要な領域を視覚的に表示します。 複数の時間足: 異なる時間足の情報を組み合わせ、相場全体の状況を評価します。 視覚的な分析プロセス: 分析情報をチャート上で直接確認できます。 自主的な取引判断を支援 Boba
ARIPoint
Temirlan Kdyrkhan
1 (4)
ARIPoint is a powerful trading companion designed to generate high-probability entry signals with dynamic TP/SL/DP levels based on volatility. Built-in performance tracking shows win/loss stats, PP1/PP2 hits, and success rates all updated live. Key Features: Buy/Sell signals with adaptive volatility bands Real-time TP/SL/DP levels based on ATR Built-in MA Filter with optional ATR/StdDev volatility Performance stats panel (Success, Profit/Loss, PP1/PP2) Alerts via popup, sound, push, or email Cu
Neuro Poseidon is a new indicator by Daria Rezueva. It combines precise trading signals with adaptive TP/SL levels - creating best possible trades as a result! Message me and get  Neuro Poseidon Assistant  as a gift to automize your trading process! What makes it stand out? 1. Proven profitability on all assets and timeframes 2. Only confirmed BUY and SELL signals present on the chart 3. Adaptive TP & SL levels generated by the software for each trade 4. Easy to understand - suitable for al
トレーダーの皆さん、こんにちは! 多くの個人トレーダーは、動作の遅いウェブスクリプトに頼っています。真の収益性を実現するには、体系化されたフレームワークが必要です。 Astro AIインジケーターは、一般的なチャートオーバーレイではありません。これは、ターミナル上で直接動作する2つのエージェントを含む、コンパイル済みのニューラルネットワークです。 システムの具体的な技術は以下のとおりです。 1. エージェント1:アナリスト(グラフィカルニューラルネットワーク - GNN) 市場は孤立した価格バーではなく、相互に連結されたデータネットワークです。 機能:エージェント1は、グラフィカルニューラルネットワークを使用して、これらの複雑で非線形な関係をマッピングします。 利点:一般的なインジケーターは過去の移動平均しか考慮しませんが、当社のGNNは市場の深い構造的関係をリアルタイムで処理し、個人トレーダーの取引量が大きな影響を与える前に、隠れた相関関係を明らかにします。 2. エージェント2:エグゼキューター(近接戦略最適化 - PPO) パターン認識は、戦いの半分に過ぎません
もう勘でトレードしなくていい。 エントリーのタイミング、決済の場所、相場がどちらに傾いているか、そのすべてが1つのチャートで分かります。 RelicusRoad Proは、20種類近くのツールを1つのインジケーターにまとめました。自分のトレードスタイルに合うツールだけをオンにできます。 エントリーは明確に。決済も明確に。すべてのチャートに計画を。 心当たりはありませんか? 買った途端、1分もしないうちに価格が逆行する。 早めに決済してしまい、その後も値動きが続くのを眺めている。 チャートにインジケーターを5つ並べても、答えは5通りある。 ストップロスの位置は、なんとなく決めている。 開発した理由 私たちは18年間、FXを取引してきました。RelicusRoadの中核となるアルゴリズムは、最初は非公開で、私たちプロのトレーダー仲間のために作られました。 きっかけは個人的なものでした。毎回同じラインを手で引き、自分たちで決めたルールを破り、チャート上の重要な一点を見落とすことに、私たちは疲れていたのです。 私たちにとって効いたのは一貫性です。毎日同じ方法で相場を読み続け、それが体に染みつく
UZFX {SSS} スキャルピング・スマートシグナル v5.0 MT5は、変動の激しい市場において正確かつリアルタイムのシグナルを求めるスキャルパー、デイトレーダー、スイングトレーダー向けに設計された、リペイントのない高性能な取引インジケーターです。(UZFX-LABS)によって開発されたこのインジケーターは、価格行動分析、トレンド確認、スマートフィルタリングを組み合わせることで、すべての通貨ペアおよび時間枠において、高確率の売買シグナル、警告シグナル、トレンド継続の機会を生成します。 トレードの判断に迷うのはもうやめましょう。明確さ、正確さ、そして規律ある市場執行を求めるトレーダーのために設計された、体系的なシグナルシステムに従い始めましょう。 間違いなく、MQL5で入手可能な最高のインジケーターの一つです。絶対に見逃さないでください!!「スマートなトレーダーのためのスマートシグナル」 最新バージョン5.0がリリースされました。価格は予告なく最大499.99ドルまで値上がりする可能性がありますので、チャンスを逃さないようお早めにお求めください!! 購入を決める前に!無料トライアル
IQ FX Gann Levels a precision trading indicator based on W.D. Gann’s square root methods . It plots real-time, non-repainting support and resistance levels to help traders confidently spot intraday and scalping opportunities with high accuracy. William Delbert Gann (W.D. Gann) was an exceptional market analyst, whose trading technique was based on a complex blend of mathematics, geometry, astrology, and ancient mathematics which proved to be extremely accurate. We don't offer free or bonus indic
Azimuth Pro
Ottaviano De Cicco
5 (7)
Azimuth Pro V2:MT5向けシンセティック・フラクタル構造分析と確認済みエントリー 概要 Azimuth Pro は Merkava Labs によるマルチレベルスイング構造インジケーターです。4つのネストされたスイングレイヤー、スイングアンカーVWAP、ABCパターン検出、3タイムフレーム構造フィルタリング、そして確定バーでの確認済みエントリー — 1つのチャートで、ミクロスイングからマクロサイクルまでを網羅するワークフロー。 これはブラインドシグナル製品ではありません。ロケーション、コンテキスト、タイミングを重視するトレーダーのための構造ファーストワークフローです。 ️ サマーセール — 夏至とThe Oracle Proの発売を記念して、Azimuth Proが30%オフ。現在279 USD(通常399 USD)。期間限定の夏季オファー。 1. V2での変更点 シンセティック・マルチタイムフレームエンジン 上位タイムフレーム分析をMeridian Proと同じ独自のシンセティックアーキテクチャで一から再構築。よりクリーンなHTFコンテキスト、安定したライブ動作、
PainX 400 FAKEOUT DETECTOR MT5 Custom Indicator  ·  Sell-Side Bias  ·  Scalping  ·  RSI(6) Filtered   OVERVIEW   The Spike Fakeout Detector is a non repaint precision technical indicator built exclusively for Crash / PainX synthetic indices on the platform. It is engineered around one of the most consistent and exploitable patterns on this instrument — the false breakout above resistance followed by a sharp price drop. Crash/PainX is a growing index that produces a significant price drop appr
ARICoin is a powerful trading companion designed to generate high-probability entry signals with dynamic TP/SL/DP levels based on volatility. Built-in performance tracking shows win/loss stats, PP1/PP2 hits, and success rates all updated live. Key Features: Buy/Sell signals with adaptive volatility bands Real-time TP/SL/DP levels based on ATR Built-in MA Filter with optional ATR/StdDev volatility Performance stats panel (Success, Profit/Loss, PP1/PP2) Alerts via popup, sound, push, or email Cust
• G signals are counter-move entries taken after an extended move. • E signals are entries in the direction of the prevailing trend. • Signals appear only after the candle has closed. A signal that is displayed will not disappear or move. 1. Entering a Trade Wait for the signal candle to close. Enter at the open of the next candle, or at the close of the signal candle if your platform allows it. Take only the signal types you have chosen to trade. Treat G and E as separate strategies with sepa
GEM Signal Pro GEM Signal Pro は、MetaTrader 5 向けのトレンドフォロー型インジケーターです。より明確なシグナル、より整理されたトレードセットアップ、そして実用的なリスク管理をチャート上で確認したいトレーダーのために設計されています。 単純な矢印だけを表示するのではなく、GEM Signal Pro はトレード全体の考え方を、より見やすく分かりやすい形で表示します。条件が確認されると、インジケーターはエントリー価格、ストップロス、利確目標をチャート上に表示し、トレードセットアップをより効率的に確認できるようにします。 動作の仕組み このインジケーターは、まず内部ロジックに基づいて有効なシードシグナルを検出します。 確認条件が満たされると、GEM Signal Pro はチャート上に完全なセットアップを表示します。これにより、トレーダーはトレード構造をより明確に把握し、手作業による分析を減らすことができます。 チャート上のトレードレベル 確認済みシグナルに対して、GEM Signal Pro は以下を表示できます。 エントリー価格 ストップロス テ
以下は Chimera Volume の日本語訳です。 MetaTrader 5用 Chimera Volume 高度な出来高分析と市場活動の可視化 Chimera Volumeは、MetaTrader 5向けに設計されたカスタムインジケーターです。正規化された出来高の動きを分析し、動的な視覚的フレームワークを通じて市場参加者の変化をリアルタイムで表示します。 このインジケーターは、適応型正規化アルゴリズムを用いてティック出来高データを処理し、出来高の強さ、蓄積フェーズ、および異なる市場条件下での活動シフトを構造化して表現します。 生の出来高を表示する標準的なインジケーターとは異なり、Chimera Volumeは追加の計算を適用することで、市場活動の相対的な変化を強調し、チャートの視認性を向上させます。 主な機能 ルート・インテント・ヒストグラム (Root Intent Histogram): 正規化された出来高の強さと市場参加度を視覚化する動的ヒストグラムです。適応型カラー・トランジションを採用しており、活動の活発化と参加の減少を明確に区別します。 慣性ライン (Inertia
MERAVITH SCANNERは、MetaTrader 5用のプロフェッショナルな金融市場インジケーターで、複数の分析ツールを一つの統合システムにまとめています。独自の出来高加重平均価格(VWAP)手法を使用してすべての計算を自動で行い、主観的な解釈を完全に排除します。 このインジケーターは、すべての資産クラス(FX、株式、指数、商品、暗号通貨)およびM1から月足までのすべての時間軸で動作します。基本原理は「価格は出来高に従う」というものです。MERAVITHは機関投資家の出来高が集中するポイントを特定し、その集中から数学的に正確な価格レベルを導き出します。予測や投機は行わず、計算のみを行います。 MERAVITH SCANNERを使用すると、28の主要FX通貨ペアをすべての時間軸でわずか2~3分でスキャンできます。また、任意の市場をスキャンすることも可能です。例えば、約100銘柄の株式を約10分でスキャンできます。 インジケーターは、消耗レベル、均衡線、偏差、統計レベル、およびターゲット予測を算出します。 チャート要素 Origin Point :すべての計算が始まる起点です。イン
note: this indicator is for METATRADER4, if you want the version for METATRADER5 this is the link:  https://www.mql5.com/it/market/product/108106 TRENDMAESTRO ver 2.5 TRENDMAESTRO recognizes a new TREND from the start, he never makes mistakes. The certainty of identifying a new TREND is priceless. DESCRIPTION TRENDMAESTRO identifies a new TREND in the bud, this indicator examines the volatility, volumes and momentum to identify the moment in which there is an explosion of one or more of these da
MERAVITH は MetaTrader 5 向けのマルチタイムフレームの出来高・流動性インジケーターで、すべての時間足でトレンド、サポートとレジスタンスのゾーン、エントリー、ターゲット、ストップロスを表示します。市場の完全な流動性マップ、ヘッジファンド流の流動性ツールを提供し、独自の出来高加重平均価格の手法ですべての計算を自動で行うため、主観的な解釈はありません。 FX、ゴールド(XAUUSD)、指数、仮想通貨に対応し、すべての時間足で機能します。 購入後の特典:MERAVITH での取引方法を解説した動画レッスン集。購入後にメッセージをお送りください。 MERAVITH の機能 すべての時間足を分析し、それぞれで有効なトレンドを表示します。 流動性ゾーン(Volume Equilibrium)を示します。強気と弱気の出来高が等しくなる場所です。 すべての時間足の流動性レベルをチャート上に直接表示します。 参考用に市場のテキスト分析を書き出します。 現在のトレンドからエントリー、ターゲット、サポートレベル、ストップロスを計算します。 取引のリスクリワード比を計算します。 口座残高に
Cycles Plotter 移動平均と開始日を備えたカスタマイズ可能なサイクルインジケーター Cycles Plotter は、ユーザー入力のみに基づいて、完全にカスタマイズ可能な2つの正弦波サイクルを描画する高度なテクニカルインジケーターです。サイクルを自動生成しません。すべてのサイクルは、ユーザーが設定したパラメーターのみに基づいて計算され、価格の振動と潜在的なトレンド変化を研究するための視覚的ツールをトレーダーに提供し、自動シグナルや予測は生成しません。 重要なポイント: ユーザー定義のサイクル: サイクル 1 P1 と 2 P2 はユーザーが完全に設定できます。サイクルの長さ、振幅、移動平均、正確な開始日と時刻を設定できます。ユーザーがパラメーターを入力しない場合、サイクルは描画されません。 振幅の制御: 各サイクルは異なる振幅を持つことができ、基準となる移動平均に対して振動の高さを調整できます。 トレンド検出: 高速および低速移動平均はサイクルの方向を示します: Fast MA が Slow MA より大きい 上昇フェーズ 緑 lime Fast MA が Slow MA
AriX
Temirlan Kdyrkhan
1 (4)
AriX Indicator for MT5 A powerful trend-following and signal-evaluation tool AriX is a custom MT5 indicator that combines Moving Averages and ATR-based risk/reward logic to generate clear buy/sell signals. It visualizes dynamic SL/TP levels, evaluates past trade outcomes, and displays win/loss statistics in a clean on-chart panel. Key features include: Buy/Sell signals based on MA crossovers ATR-based SL/TP1/TP2/TP3 levels with visual lines and labels Signal outcome tracking with real-time stat
相場が本当は何をしているのかを見抜く。   3つの市場フェーズ(収縮・拡張・トレンド)を目の前でライブに捉え、トレンド・フェーズの初期段階でより優れたエントリーを取りましょう   。      当て推量はもう終わり。機関投資家やスマートマネーのように相場を読み始めましょう。   Apex Market Structure Pro(MT5版)は、ノイズを取り除き、あらゆるローソク足の下にある真の構造を見せる高精度のスマートマネー分析ツ   ールです。流動性、構造転換、蓄積ゾーン、トレンドバイアスを、ひとつのクリーンでプロフェッショナルなオーバーレイに集約します。遅行   指標に見切りをつけ、明晰さをもってトレードする準備のできた本気のトレーダーのために作られました。   重要:本インジケーターは Heikin Ashi(平均足)ローソク足での動作を前提に設計されています。使用前にチャートを Heikin Ashi   に設定し、その真価を解き放ってください。分析のすべては Heikin Ashi の価格の流れを軸に構築されています。Apex Market Structure Pr
Title:FX-AIEA Supply and Demand Zone Indicator (MT5) — Technical Overview Version: 2.51 | Platform: MetaTrader 5 Introduction Supply and demand zones are considered a core manifestation of institutional order flow, providing a more direct reflection of buying and selling pressure than traditional support/resistance levels. This indicator attempts to automate the identification of high-probability supply and demand zones using an adaptive ZigZag algorithm, reducing the subjectivity and time asso
ORB Seeker MT5
Marcela Goncalves De Oliveira
数量限定で特別価格!希少性を維持するための特別価格です! たったの599ドル! ご購入後、ボーナスとしてORB Seeker EAと個人最適化セットファイルをお受け取りいただくため、私にご連絡ください。 クリーンなセッションブレイクアウトを自信を持ってキャッチしましょう! ORB Seeker MT5は、正確性、シンプルさ、柔軟性、そして明確なチャート構造を求めるトレーダー向けに開発された、プロ仕様のオープニングレンジブレイクアウト(ORB)インジケーターです。 このシステムは、あらゆる銘柄のプレマーケットまたはカスタムセッションのレンジを自動的にプロットし、エントリー、ストップロス、テイクプロフィット、およびオプションの50%部分TPレベルを含む明確なブレイクアウトシグナルを提供します。すべての計算結果はリアルタイムでチャート上に表示されます。 ロンドンオープン、ニューヨークセッション、アジアセッション、または独自のカスタム市場時間帯で取引できます。ORB Seeker MT5は選択したセッション時間帯に合わせて調整されるため、市場レンジ、ブレイクアウトレベル、トレードレベルの位
Volume Arrow Signal Product Description Volume Arrow Signal is a smart trading indicator designed to help traders identify potential buy and sell opportunities using price action, volume behavior, and directional arrow signals. The indicator places clear arrows directly on the chart, making it easy to spot possible market reversals, trend continuations, and entry opportunities without spending hours analyzing charts manually. Whether you are trading Gold (XAUUSD) , Forex pairs, Indices, or Crypt
MATADOR GOLD XAUUSD M5 Scalp Signals for MT5 MATADOR GOLD is a decision-support indicator for MetaTrader 5, designed for traders who analyze short-term Gold movement on the M5 timeframe. The indicator does not open, close, or manage trades automatically. It provides buy and sell signal guidance so the user can make their own trading decisions according to their risk plan, broker conditions, and trade management rules. Main purpose MATADOR GOLD is built to help traders avoid noisy signal flow and
Footprint は、オーダーフロー(Order Flow)と出来高分析のためのインジケーターです。 クラスターレベルでの市場構造の特定、アクティビティの高い主要ゾーンの発見、そして設定ウィンドウを毎回開くことなくチャート上で直接フィルター操作を行うのに役立ちます。 Footprintインジケーターの機能 Bid x Ask、Deltaのクラスターチャート; チャート上のコントロールパネル; フィルター調整用のスライダー; Absorption; Initiative; Stacked Imbalances; Big Trades; dPOC / Dynamic Point of Control; Delta; サイドマーケットプロファイル; 累積デルタ(Cumulative Delta)。 主な利点 高密度のティックフローに対する高速な計算とデータ表示; チャート内管理 — 設定を開くことなく、主要モードとフィルターを直接切り替え可能; 重要な価格レベルとクラスターを強調するためのフィルタリング; シグナルの視覚的ハイライト:吸収、主導権、インバランス、大口取引; 日、週、または現
Zain Gold ScalpingV5
Ahmed Gamal Abdel Nasser Mohamed
Zain Gold Scalping V5 is a technical analysis indicator for MetaTrader 5 designed for Forex and Gold markets. It provides chart-based market information, trend analysis, signal conditions, and an on-screen dashboard to help traders analyze price movement across multiple timeframes. Main Features The indicator supports multiple timeframes, including M1, M5, M15, M30, H1 and higher timeframes. It can be used with Gold (XAUUSD), Forex currency pairs, indices and other supported instruments. The in
Quantum Momentum Guard (QMG) Advanced Breakout & Momentum Indicator for MetaTrader 5 Quantum Momentum Guard (QMG) is a next-generation MetaTrader 5 trading indicator designed to identify high-probability breakout opportunities using a powerful combination of advanced momentum analysis and high-level mathematical calculations . Unlike ordinary indicators that generate signals based on a single condition, QMG confirms every breakout with momentum strength and mathematical validation , ensuring
KenKem Master Volume Profiler - Brief Introduction A Display-only volume-profile cockpit for XAUUSD, BTCUSD and other liquid symbols. Draws profile structure, multi-timeframe flow, EMA trend and study-only setup markers. Places no orders. Not a signal service.  It maps where the market has actually traded and reads recent order flow, so you can see structure and lean at a glance.  What it shows: Master and local volume profiles (POC and value-area high/low) - the price shelves that matter. A liv
VTrende Pro
Andrii Diachenko
5 (1)
VTrende Pro - MTF indicator for trend trading with a display panel for MT5 *** Videos can be translated into any language using subtitles (video language - Russian) Although the signals of the VTrende Pro indicator can be used as signals of a full-fledged trading system, it is recommended to use them in conjunction with the Bill Williams TS. VTrende Pro is an extended version of the VTrende indicator. Difference between Pro version and VTrende: - Time zones - Signal V - signal 1-2 waves -    S
First time on MetaTrader, introducing IQ Star Lines, an original Vedic Astrology Based Intraday Trading Indicator. We don't offer free or bonus indicators in exchange of reviews from you. You won't need any free products with this indicator to make it work. ;) Enjoy! Welcome to the new and updated  IQ Star Lines , the ultimate fusion of ancient planetary cycles and modern quantitative trading, published for the first time on Metatrader. This is an indicator built by the developer, who has spent
Navigator Equilibrium:市場のフェーズ、モメンタム、ピーク、ダイバージェンスをひとつのウィンドウで モメンタム・オシレーター、トレンドフィルター、ボラティリティ指標、ダイバージェンス・スキャナーを行き来する必要はもうありません。Navigator Equilibrium は、それらを色分けされたひとつのウィンドウにまとめました。モメンタムが強まっているのか弱まっているのか、どちらが主導権を握っているのか、相場がトレンド中なのか持ち合いなのか、そして価格とモメンタムがどこで食い違っているのかが、ひと目でわかります。 相場を明確に読み取りたい裁量トレーダーにも、整理されたドキュメント付きのバッファを必要とする EA 開発者にも向いています。 他との違い 上昇・下落だけではない、5つの状態を持つヒストグラム。 方向に加えて、モメンタムが強まっているのか、弱まっているのか、ピーク状態まで伸びきっているのかを色で示します。 相場環境を示すゼロライン。 色が変わり、相場がトレンド中か持ち合い中かを教えてくれます。 「誰が主導権を握っているか」がひと目でわかる。 ヒストグラムの棒
作者のその他のプロダクト
MANZANO FOOTPRINT ORDER FLOW Footprint, Order Flow and Volume Analysis for MetaTrader 5 Manzano Footprint Order Flow is an analytical indicator for MetaTrader 5 that brings together Footprint charts, Bid x Ask, Delta, Cumulative Delta (CVD), Imbalances, Volume Profile, VWAP, Market Depth and Time & Sales in an interactive environment. It allows traders to examine activity within individual candles, identify volume concentrations, compare buying and selling pressure, and analyse how market partic
Manzano SMC Institutional Pro Smart Money Concepts, ICT, historical statistics, market structure and liquidity analysis for MetaTrader 5. Any SMC indicator can draw zones. Manzano SMC Institutional Pro measures how those zones have performed in your market and compares their results against randomly selected price levels. See the structure. Examine the historical evidence. Understand the market context. Manzano SMC Institutional Pro combines Smart Money Concepts (SMC), ICT methodology, Market St
Manzano Risk Reward Box The PRO version, including direct trade execution and automatic R-based trailing management, is available. For information about the PRO version, please contact us via MQL5 private message. Manzano Risk Reward Box is a visual trade planning and risk management tool for MetaTrader 5, designed to help traders prepare their positions directly on the chart before execution. It allows users to create visual BUY and SELL scenarios, define the percentage of the account they want
FREE
Harmonic Pattern Suite Pro Introduction Harmonic Pattern Suite Pro is an indicator designed to identify and display harmonic structures on the chart based on X-A-B-C-D sequences. Its purpose is to present pattern formations that meet geometric and proportional criteria, providing a clear visual representation directly on the chart. The indicator automates the detection process, removing the need for manual measurement of ratios and allowing the user to review the structural configuration withou
FREE
Smart Adaptive Trend Flow MT4 Professional adaptive trend, market structure, price levels and flow analysis indicator for MetaTrader 4. Would you like to test it before purchasing? Request a fully functional trial version by sending us a private message through MQL5.com and evaluate the indicator directly on your own charts. A Complete Market View Smart Adaptive Trend Flow MT4 combines several analytical components in a single indicator: Adaptive trend analysis. BULLISH and BEARISH market regim
Smart Adaptive Trend Flow MT5 Professional adaptive trend, market structure, price levels and flow analysis indicator for MetaTrader 5. Would you like to test it before purchasing? You can request a fully functional trial version by sending us a private message through the MQL5 messaging system . This allows you to evaluate the indicator and all its features before making a purchase decision. A Complete Market View in a Single Chart Smart Adaptive Trend Flow MT5 has been developed to provide a
Plan, execute and protect every trade in MetaTrader 5: exact risk-based lot size, automatic management, baskets and Prop Firm rules in a single panel. Manzano Trade Manager Pro is a professional trade manager for MetaTrader 5, designed especially for traders who trade funded accounts (Prop Firms) and need advanced control over risk, execution and position management. It brings together in one tool visual trade planning, automatic lot size calculation, individual, collective and basket managemen
フィルタ:
レビューなし
レビューに返信