Apex Point
- インディケータ
- バージョン: 1.1
- アップデート済み: 2 3月 2026
- アクティベーション: 5

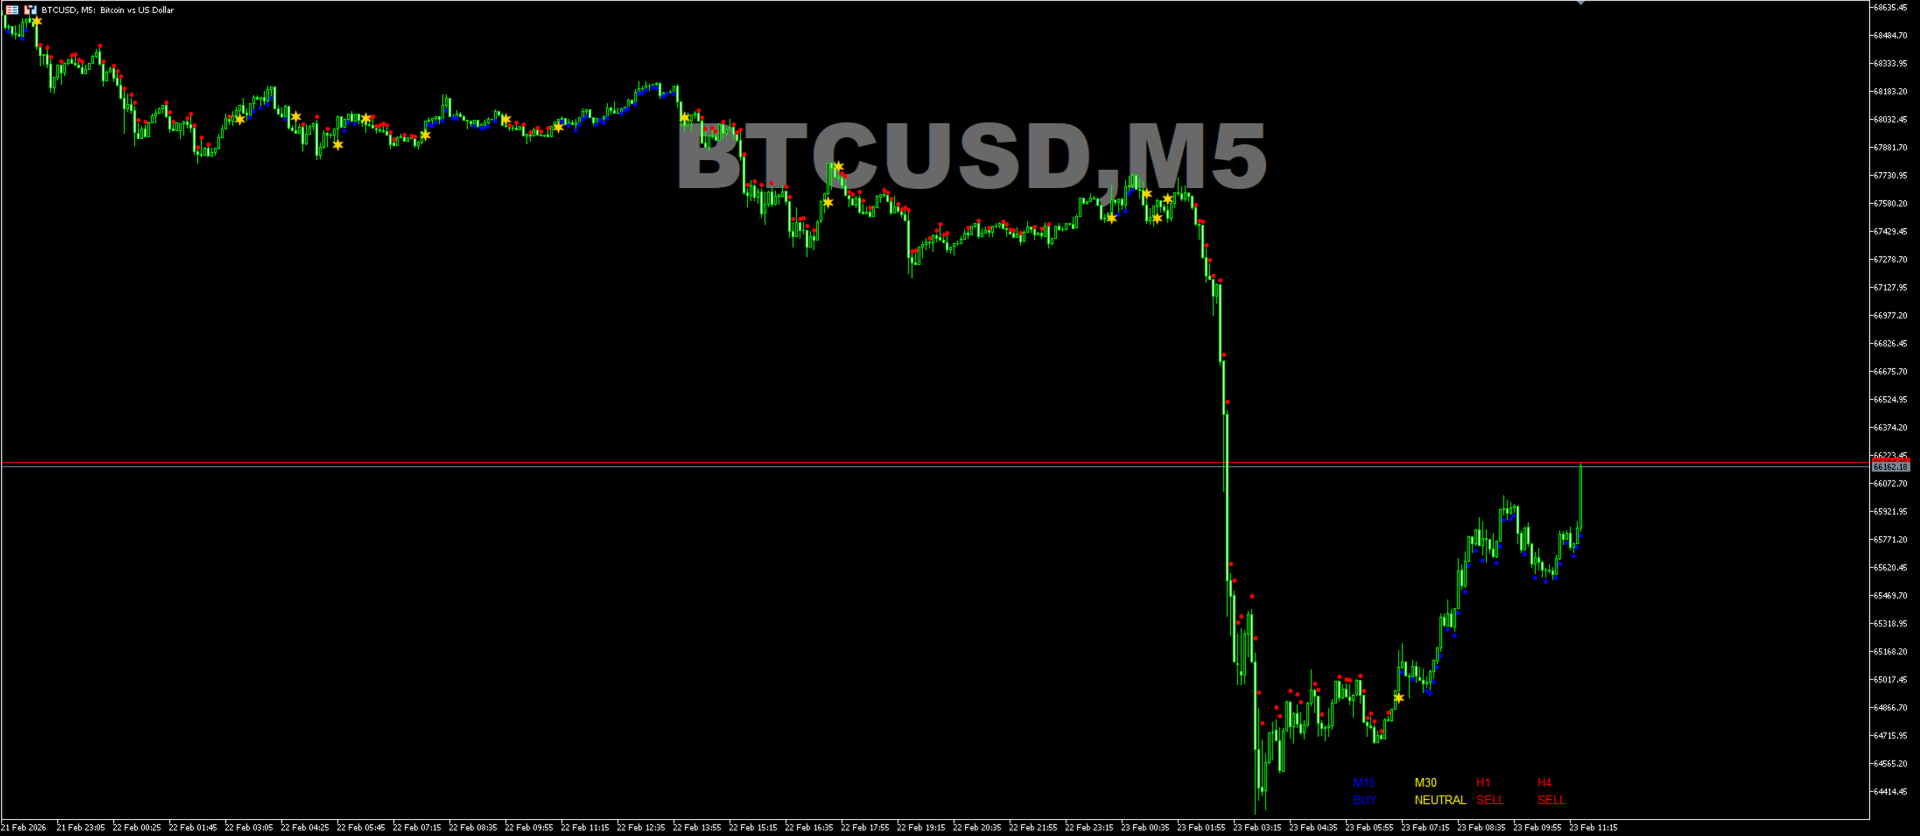
Apex Point
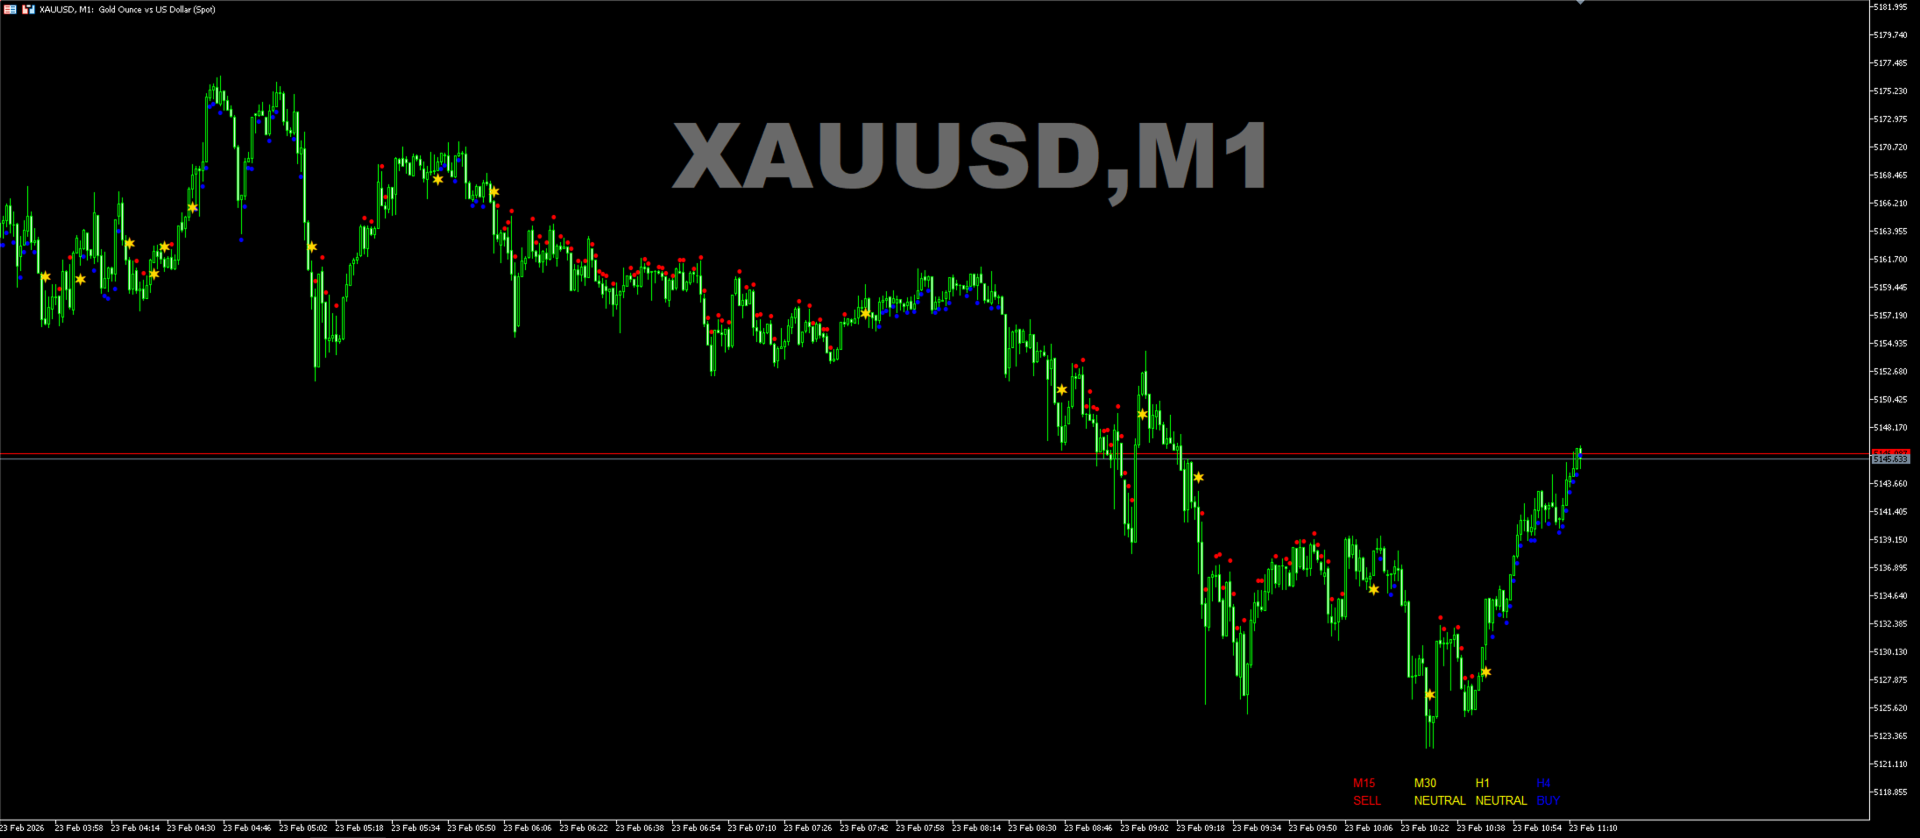
is a trend-following indicator for MetaTrader 5, transforming complex market data into signals for traders.
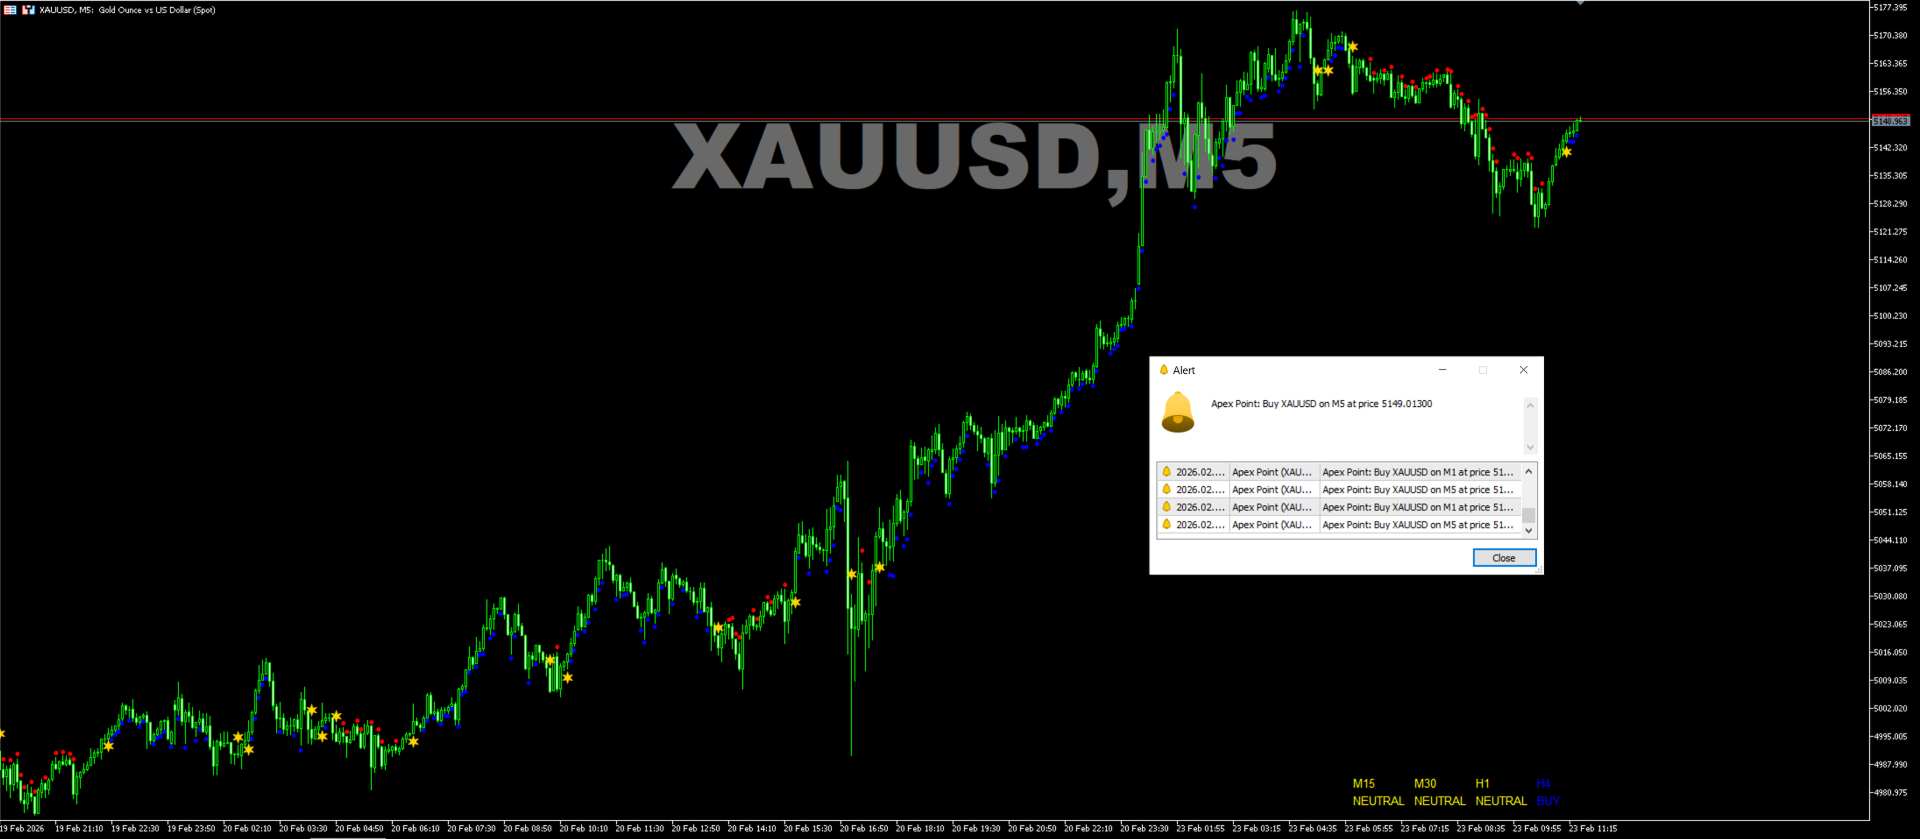
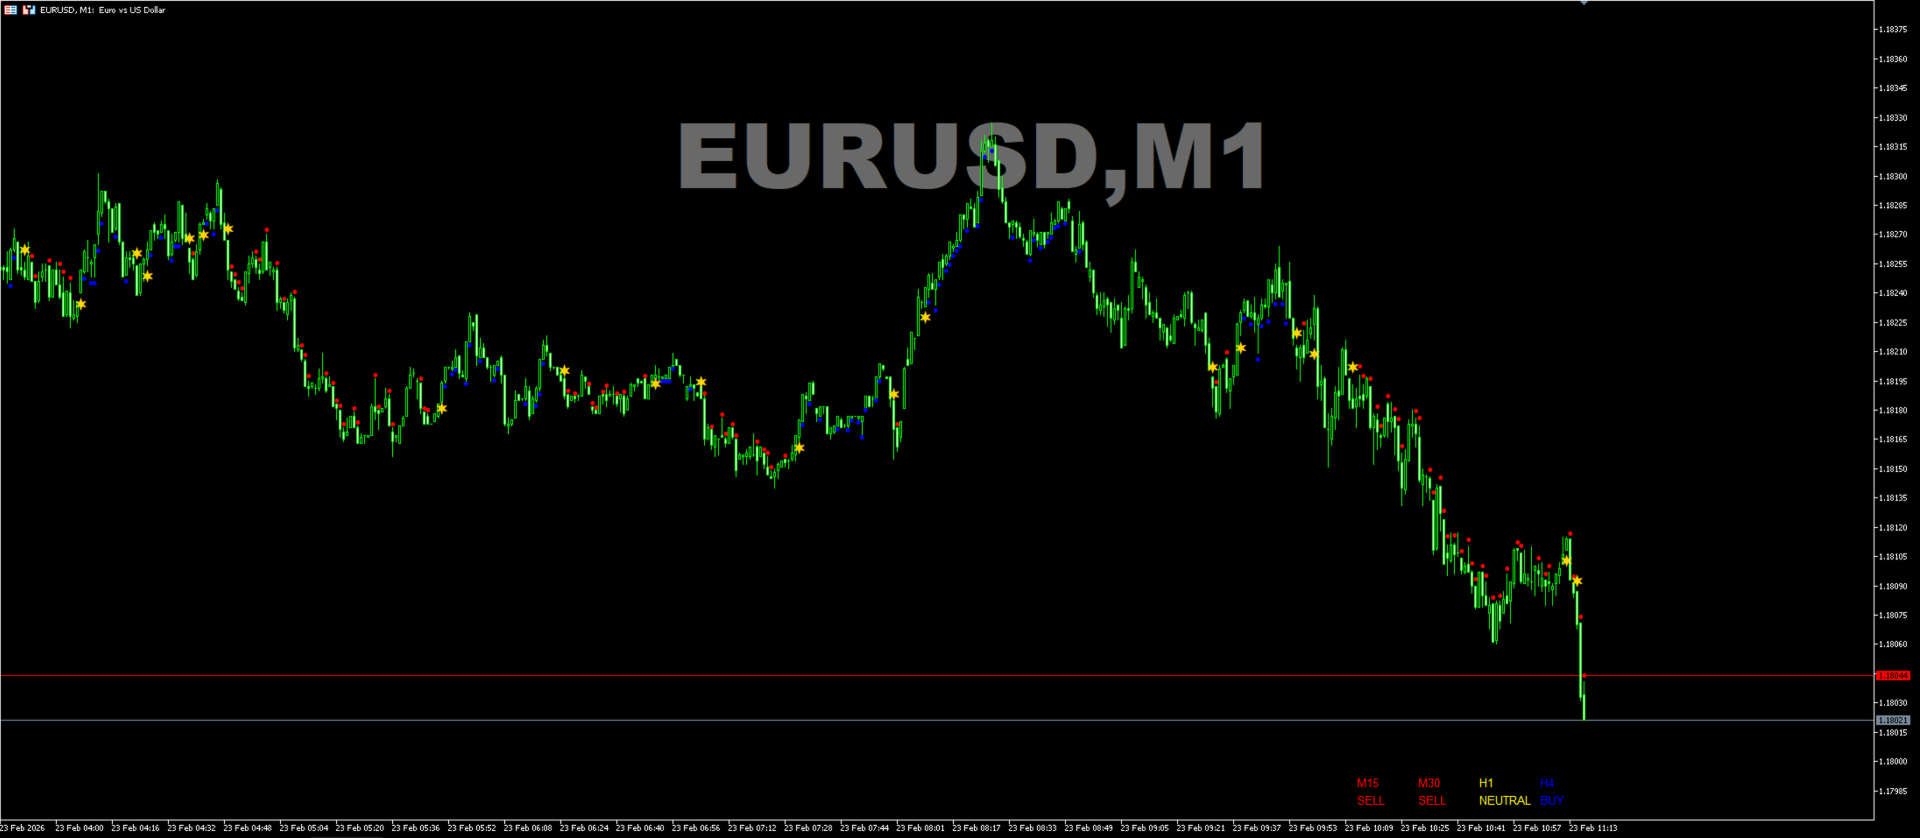
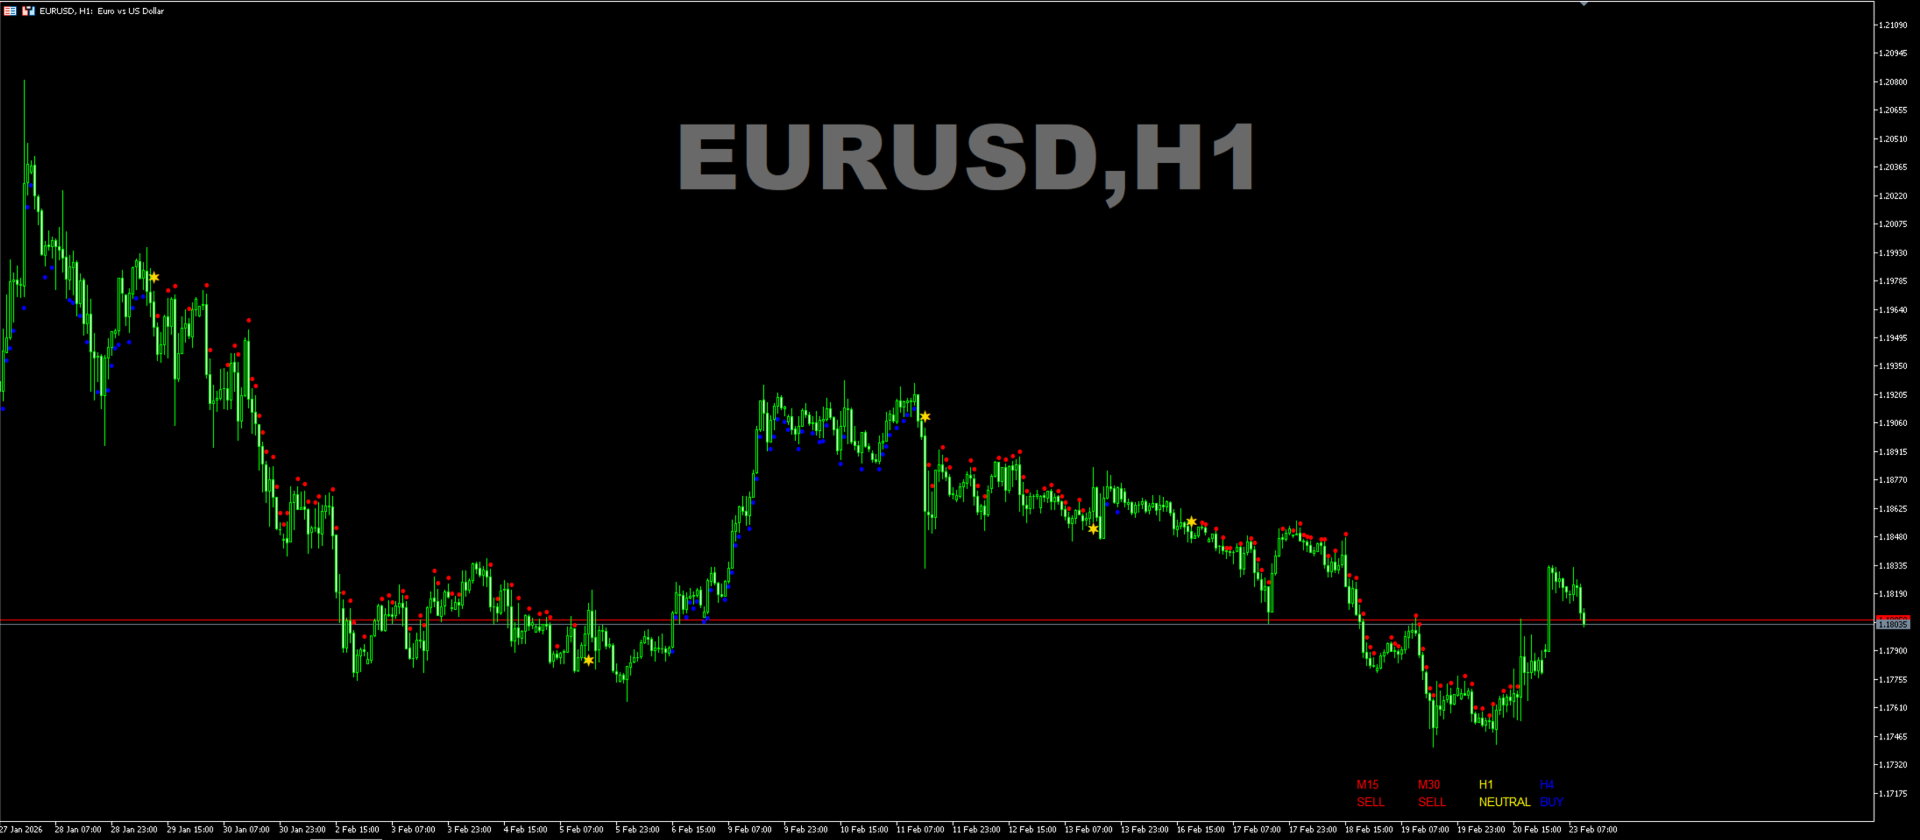
It displays blue dots for uptrends, red dots for downtrends, and yellow crosses at potential reversals, helping users identify momentum shifts quickly.
Key features include a confirmation system requiring multiple bars (default: 3) to validate changes, reducing false signals; dynamic ATR-based offsets for adaptive trailing,
with instant ratcheting in the trend direction and smoothed adjustments against it; an optional moving average filter for alignment with broader trends; and a minimum candle body size to filter noise.
It also offers multi-timeframe trend labels (M15 to H4) using RSI, MACD, or both for buy/sell/neutral insights, plus configurable alerts (popup, push, email, sound) after consecutive dots post-reversal.
Display limits optimize chart performance.
Ideal for trending markets in forex, stocks, or commodities, it supports disciplined trading through confirmed signals and risk management, though backtesting is recommended for asset-specific tuning. I
n ranging conditions, signals may be sparse, emphasizing its strength in directional moves.
Works great on M1 for scalping.
Support and questions via MQL5 product comments.
Detailed description in the first comment.
For questions, updates, and to connect with other traders, join my official MQL5 group ForexEAandMore
Standard for Settings for XAUUSD.
Settings
DisclaimerConfirmationBars
MinBodySizePoints
MaxDotsShown
UsePopupAlert
UseNotification
UseEmail
This indicator is provided for informational purposes only and does not constitute financial advice. Past performance calculated using historical data does not guarantee future results, and trading involves risk of loss. Always test the product in a demo account, combine it with appropriate risk management, and consult a professional advisor if necessary. The developer assumes no liability for any trading decisions made based on this tool. Translations are available via MQL5 tools for global accessibility.