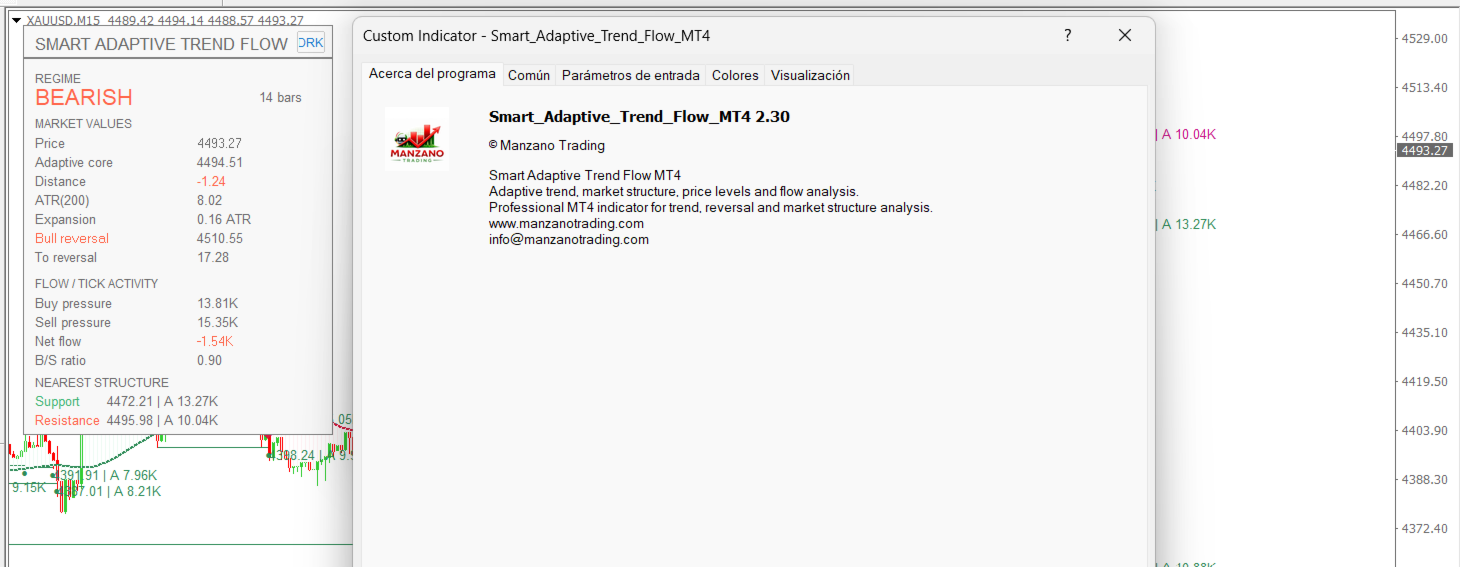
Smart Adaptive Trend Flow MT4

Smart Adaptive Trend Flow MT4

Professional adaptive trend, market structure, price levels and flow analysis indicator for MetaTrader 4.

Would you like to test it before purchasing? Request a fully functional trial version by sending us a private message through MQL5.com and evaluate the indicator directly on your own charts.

A Complete Market View

Smart Adaptive Trend Flow MT4 combines several analytical components in a single indicator:

  • Adaptive trend analysis.
  • BULLISH and BEARISH market regimes.
  • Trend-change arrows.
  • Automatic market structure.
  • Dynamic support and resistance.
  • Activity associated with structural levels.
  • Buy/Sell Pressure and Net Flow.
  • Volatility and price expansion.
  • Potential reversal levels.
  • Integrated analysis dashboard.

The objective is to display trend, structure, volatility and market activity within the same visual context, reducing the need to combine multiple separate indicators.

Adaptive Trend Engine

The indicator uses an adaptive trend engine that adjusts its response according to market conditions and price behavior.

Unlike a conventional moving average with a fixed response, the adaptive core evolves with the market. A volatility filter also helps prevent small fluctuations around the central line from being automatically interpreted as trend changes.

The chart clearly distinguishes:

Green: Bullish regime.
Red: Bearish regime.

The adaptive line and trend area provide an immediate visual representation of the prevailing market regime.

Trend-Change Arrows

When a transition between bullish and bearish regimes is confirmed, the indicator plots an arrow directly on the chart.

A bullish arrow identifies the confirmation of a new bullish regime, while a bearish arrow identifies the confirmation of a new bearish regime.

Regime changes are confirmed using closed candles. Once confirmed, historical transitions remain stable.

The arrows represent changes detected by the trend engine and should not be interpreted by themselves as automatic Buy or Sell orders.

Automatic Market Structure

Smart Adaptive Trend Flow also analyzes price structure and automatically identifies relevant confirmed pivots.

From these structures, the indicator generates horizontal levels that can highlight:

  • Structural support.
  • Structural resistance.
  • Relevant highs and lows.
  • Unresolved structures.
  • Levels subsequently reached or swept by price.

There is no need to draw these areas manually. The indicator creates and manages structural levels automatically as the market evolves.

The user can also choose whether previously swept historical levels remain visible.

Price and Activity Values

Each structural level can display its exact price and the activity recorded around its formation.

For example:

158.420 | A 24.70K

The first value represents the structural price and A represents Activity.

Values are automatically displayed as:

K = thousands
M = millions

Activity is calculated using tick activity supplied by the broker around the formation of the structure.

Therefore, it does not represent pending orders or actual resting liquidity at that price.

Flow Analysis

The indicator includes a directional activity analysis module.

During each market regime, it analyzes tick activity together with price behavior to estimate:

Buy Pressure — activity associated with buying pressure.
Sell Pressure — activity associated with selling pressure.
Net Flow — difference between both values.
B/S Ratio — relationship between Buy Pressure and Sell Pressure.

For example, a B/S Ratio above 1 means that the activity estimated as buying pressure is greater than the estimated selling activity during the analyzed period.

Smart Adaptive Trend Flow displays these calculated values directly without converting them into artificial probability or confidence percentages.

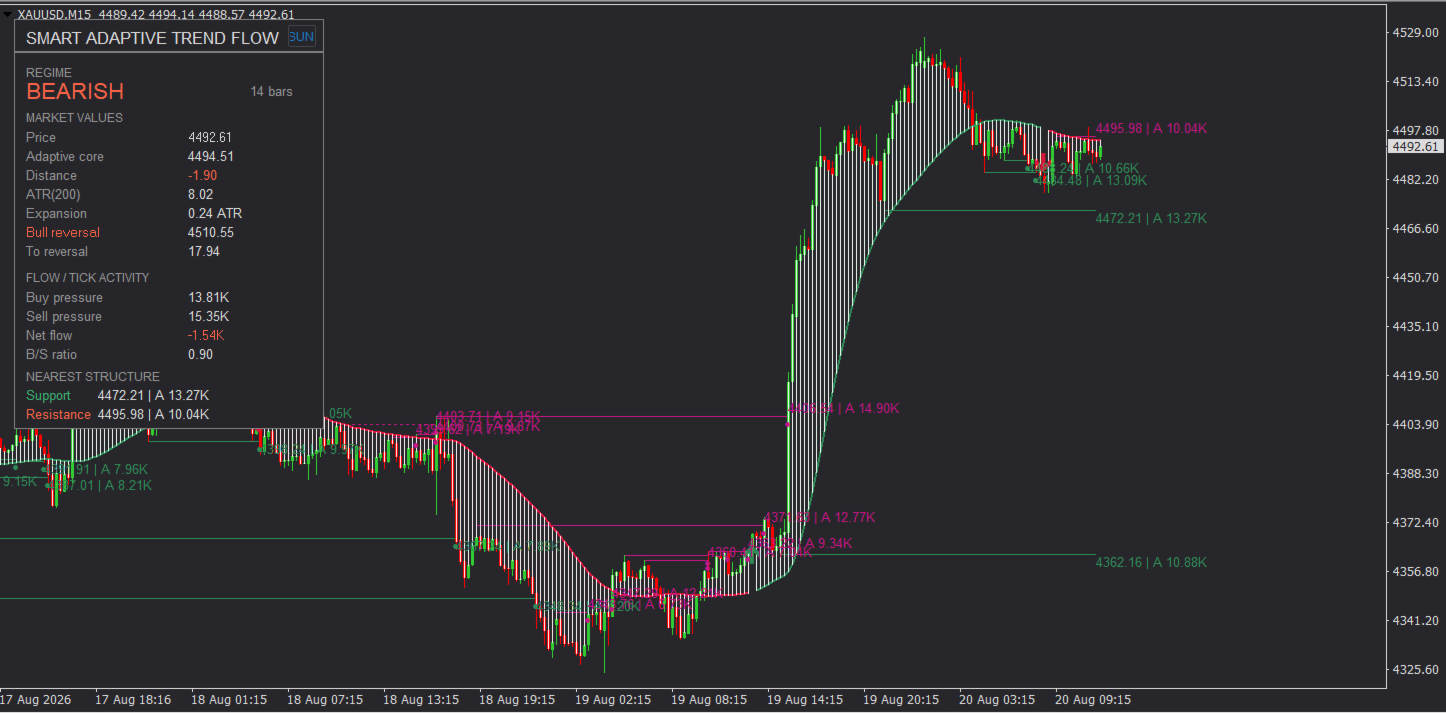
Analysis Dashboard

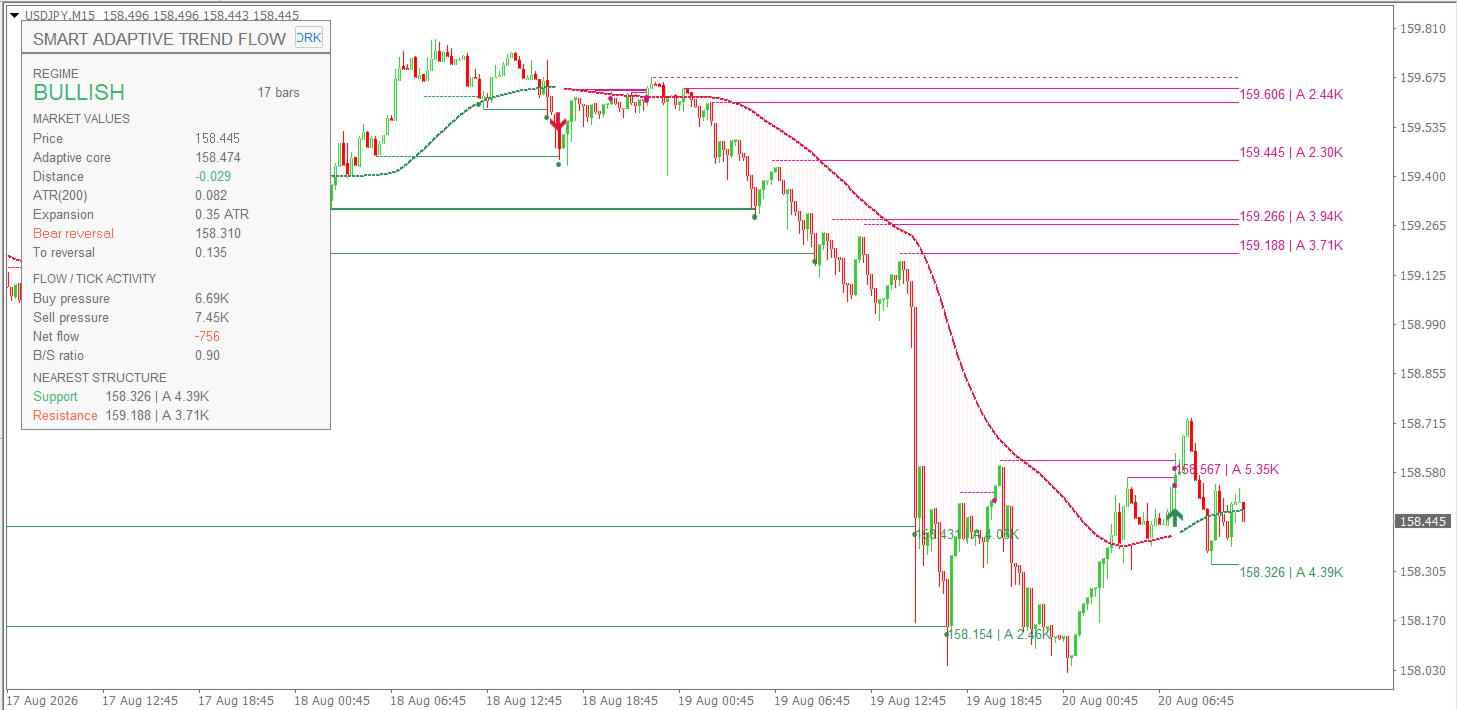
The integrated dashboard concentrates the main information calculated by the indicator.

REGIME

Displays:

BULLISH / BEARISH

together with the number of bars for which the current regime has remained active.

This makes it easy to distinguish between a recent transition and a trend that has already been developing for a longer period.

MARKET VALUES

Price
Current market price.

Adaptive Core
Dynamic reference generated by the adaptive engine.

Distance
Actual distance between price and the Adaptive Core.

ATR
Current volatility value used by the system.

Expansion
Distance between price and the adaptive core expressed in ATR units.

For example:

Expansion: 1.35 ATR

means that price is approximately 1.35 ATR away from its adaptive reference. It is a measurement of distance and volatility, not a probability.

Reversal Level

The dashboard also displays:

Bear Reversal or Bull Reversal

depending on the active regime.

This provides a specific price level associated with a potential transition from the current market regime.

To Reversal displays the distance between the current market price and that level.

This allows the trader to see the current direction, the potential transition level and the distance remaining to reach it.

Nearest Structure

The dashboard automatically identifies the nearest unresolved structures:

Support
Resistance

together with their exact price and Activity.

Example:

Support: 158.420 | A 24.70K

This provides immediate access to nearby structural levels without having to manually locate them among all the horizontal lines on the chart.

Main Features

  • Adaptive Trend Engine.
  • Automatic BULLISH/BEARISH regimes.
  • Trend-change arrows.
  • Closed-candle confirmation.
  • Dynamic trend line and visual trend area.
  • Automatic market structure detection.
  • Structural support and resistance.
  • Unresolved and swept levels.
  • Price + Activity for structural levels.
  • Buy Pressure and Sell Pressure.
  • Net Flow and B/S Ratio.
  • ATR and Expansion.
  • Bull/Bear Reversal Level.
  • Distance to Reversal.
  • Nearest Support/Resistance.
  • Integrated dashboard.
  • Light and dark themes.
  • Customizable colors and visualization.
  • Designed for MetaTrader 4.

Markets and Timeframes

Smart Adaptive Trend Flow MT4 can be used with different instruments available in MetaTrader 4, including:

Forex, Gold and other metals, indices, CFDs and other instruments supported by your broker.

It can be used on different timeframes according to the trader's preferred type of analysis.

Volatility and especially tick activity can vary between instruments and brokers. For this reason, Flow and Activity values should always be interpreted within the context of the symbol and data provider being used.

How to Use It

The indicator does not impose a specific trading strategy. Its different components can be combined, for example, as:

Trend → Expansion → Flow → Structure → Reversal

A trader can first identify the prevailing regime, analyze expansion relative to the Adaptive Core, evaluate directional activity and then locate relevant structural and reversal levels.

It can also be used as a trend filter, market structure tool, support/resistance reference or additional confirmation tool within an existing strategy.

Customization

The user can configure different aspects of the indicator, including:

  • Trend sensitivity.
  • Structure history.
  • Maximum number of levels.
  • Swept-level visualization.
  • Price and Activity labels.
  • Buy/Sell Ratio.
  • Dashboard position.
  • Trend and structure colors.
  • Visual trend fill.
  • Light/dark theme.
  • Candle colors.

Fully Functional Trial

Would you like to test it on your own charts before purchasing?

Request a fully functional trial version of Smart Adaptive Trend Flow MT4 by sending us a private message through MQL5.com.

You can evaluate its behavior and analysis tools before making a purchase decision.

Important Information

Smart Adaptive Trend Flow MT4 is a technical analysis tool. It is not an Expert Advisor and does not automatically open, modify or close trades.

Trend-change arrows, market regimes, structural levels, reversal levels, Activity, Buy/Sell Pressure, Net Flow and other information displayed by the indicator do not constitute financial advice and do not guarantee future price movements.

Activity and Flow values use tick data supplied by the broker and do not represent centralized volume, institutional orders, actual resting liquidity or order-book information.

The indicator does not promise or guarantee profits, profitability, win rate or future results. Historical behavior does not guarantee future performance.

Trading involves risk, and all trading and risk-management decisions remain the sole responsibility of the user.

おすすめのプロダクト
Stop Switching Between Charts. Monitor Them All. Multi Chart Moving Average Alert  gives you a powerful dashboard to monitor Moving Average conditions across up to 20 open charts from a single window . Instead of checking every currency pair and timeframe manually, see the market status at a glance and get alerted when your selected MA conditions occur. KEY FEATURES Monitor Up to 20 Charts Track multiple symbols from one dashboard. Two Independent Timeframes Monitor two selected tim
ComplexPulse - pulse indicator or signal. Sensitive and responsive to price movements. The indicator shows the interdependence of various currency pairs, namely: USD, EUR, GBP, CHF, JPY. Currencies are measured in relative units, so in each unit of time the sum of all currencies will be equal to zero. Hence, one of the main elements of cluster indicators is the zero line, or the balance line (zero line). If a currency is below the balance line, then it is said that the currency is oversold rela
通貨強度メーターは、現在どの通貨が強いか、どの通貨が弱いかをすばやく視覚的にガイドします。 メーターは、すべての外国為替クロスペアの強度を測定し、それらに計算を適用して、個々の通貨の全体的な強度を決定します。 28ペアのトレンドに基づいて通貨の強さに基づいて計算します。 MQL5ブログにアクセスすると、インジケーターの無料バージョンをダウンロードできます。 Metatrader Testerの制限なしで、購入する前に試してみてください: ここをクリック 1.ドキュメント すべてのトレンド通貨強度のドキュメント(手順)と戦略の詳細は、MQL5ブログのこの投稿で入手できます: ここをクリックしてください。 2.お問い合わせ ご不明な点がある場合やサポートが必要な場合は、プライベートメッセージでご連絡ください。 3.作成者 SAYADI ACHREF、フィンテックソフトウェアエンジニア、Finansyaの創設者。
Scalping Strategy Having a strategy in the market is one of the main conditions for trading. The presence of various and complicated indicators and tools sometimes makes trading difficult, and the user gets confused after trying various methods and gets stuck in a loss cycle, the result of which is usually clear. This indicator is a simple strategy based on the detection of pivots and short-term trends, which helps you to easily trade in trends. Sometimes a simple but efficient strategy has a be
MyZtrade Margin Zones (NKZ) The indicator shows on the chart the zones where major players — market makers and central banks — concentrate their activity, as well as key price levels derived from extremes. **Zones:** - market maker / central bank percentage zones - **5%, 10%, 15%, 20%, 25%** and fine 0.5%…5%; - NKZ zones from highs and lows - 1/4, 1/2, 3/4, 100%, 200%; - ATR zones of higher timeframes (H4, D1, W1, MN). **Features:** - automatic zone building from the latest price extremes; -
MT5 Version Kill Zones Kill Zones allows you to insert up to 3 time zones in the chart. The visual representation of the Kill Zones in the chart together with an alert and notification system helps you to ignore fake trading setups occurring outside the Kill Zones or specific trading sessions. Using Kill Zones in your trading will help you filter higher probability trading setups. You should select time ranges where the market usually reacts with high volatility. Based on EST time zone, followin
Waddah Attar Statistical Predictor This indicator show you the Statistical Forecast for any symbol. it depends on a history data . the result show on a new day and still with no change until end of the day . with this indicator you can : know the main direction . know the range of the movement . know high and low in the current day . use indicator levels in any expert you made to auto trade . Preferably used with main symbols like EURUSD, GBPUSD, AUDUSD, NZDUSD, USDJPY, USDCHF, USDCAD, Gold, S
With Fixed Range Volume Profile,The traces left by the big players will not go unnoticed by you. Professional   Volume Profile   Indicator reveals Institutional order flow. This advanced market indicator will teach you to spot the buying and selling. Dont want to say more because its well known by most professionals  trader. This Indicator : -  Quickly Identify the Strongest Institutional S/R Zones. - W orks with all Trading Instruments (Forex, Futures, Indexes, Commodities, Stocks, Cryptocur
AZ AI Core Pro Indicator Overview AZ AI Core Pro Indicator is a smart trading analysis tool designed to help traders identify potential market opportunities through trend analysis, multi-timeframe confirmation, support and resistance zones, AI-based filtering, and early signal detection. The indicator combines multiple analytical layers into a single visual system, allowing traders to identify BUY and SELL opportunities with greater confidence while reducing unnecessary market noise. Suitable fo
This indicator calculates the strength of the major currencies (EUR, USD, CAD, GBP, CHF, NZD, USD, JPY) and shows the top 4 strongest currency pairs that are currently in a high probability trend for the day or for the week. Usage The indicator displays 8 currency pairs with a trend direction (e.g. "EURUSD-DOWN") and ranked according to strength, with 1 being ths strongest. There will be 4 pairs for intraday and 4 pairs for intraweek If a currency pair is present in the top 4 intraday, it is in
説明 この製品は "PULSE OF MARKET" プロジェクトの一部として作成されました。 EA「Undefeated Triangle」は、AUD、CAD、NZD通貨間の価格の相互関係に基づいて動作します。観察によると、これらの通貨ペアは相関した動きを示すことがあり、強い変動の後に価格が戻る場合があります。この特性により、グリッドベースの管理手法を使用できます。 このEAは3つの通貨ペアを使用します:AUDCAD、AUDNZD、NZDCAD。 MT5版 特徴 類似製品と比較して低価格 小規模口座でも利用可能 シンプルなパラメータ 設定が容易 パラメータ Short Name – 履歴コメント Print Logs On Chart – 情報パネル Display Options – 表示設定 One Chart Setup Pairs – 通貨ペア一覧 Magic – 識別子 No more Initial Trades – 新規エントリー無効 Symbols open same time – 同時取引数 Lot Sizing Method – リスク設定 Fixed Lot –
DoIt EA Monitor - Multi EA Performance Dashboard for MT5 Your account can be profitable while one EA quietly drags down the portfolio. MetaTrader history shows the combined result, but it does not clearly show which strategy deserves more capital and which one needs attention. DoIt EA Monitor runs on one chart and separates live and historical performance by magic number, EA and symbol. It is completely read-only. It never opens, closes or modifies a trade. KNOW WHICH EA IS EARNING ITS PLACE Aut
FREE
The   Quantitative Qualitative Estimation   (QQE) indicator is derived from Wilder’s famous Relative Strength Index (RSI). In essence, the QQE is a heavily smoothed RSI. Modification of this version: (   converted from tradingview   script by Mihkell00, original from Glaz, 100% identical output) So there are Two QQEs. One that is shown on the chart as columns, and the other "hidden" in the background which also has a 50 MA   bollinger band   acting as a zero line. When both of them agree - y
Trend New Trend Indicator, shows the signals for entry. Displays both entry points and the trend itself. Shows statistically calculated moments for entering the market with arrows. When using the indicator, it is possible to optimally distribute the risk factor. Settings: Uses all one parameter for settings. Selecting a parameter, it is necessary to visually resemble it so that the appropriate graph has a projection of extremes. Options: Length - the number of bars for calculating the indica
Have you ever wondered why so many Forex traders get trapped in weak positions on the wrong side of the market? One of the easiest ways the market makers do this, is by using volatility. A currency pair moves suddenly, often on a news release or economic data. Traders jump in, expecting some quick and easy profits, but the move suddenly moves in the opposite direction. This happens in all timeframes, and in all currency pairs. The candle or bar closes, with a wide spread, but then reverses sharp
New version 1.22. Partagas    The AG algorithm is an element of a comprehensive trading system for trading a basket of currencies across 8 major currencies across all 28 currency pairs. The algorithm serves as a signal block for determining entry/exit from a position. To collect initial values, AG uses data from the CSS Currency Slope Strength cluster indicator. This indicator was not chosen by chance - it performed very well during testing of the algorithm. A. AG determines the width of the e
FREE
UniTradeXpertをご紹介します:あなたの究極の外国為替プログラム! UniTradeXpertの非凡な潜在力を明らかにする、洗練されたエキスパートアドバイザーで、外国為替取引の体験を向上させることを目的としています。ほぼ7年にわたる包括的なデータ分析のサポートにより、このEAは99.9%の驚異的な正確さで競争の激しい市場で決定的な優位性を提供します。 UniTradeXpertの優れた点は、AUDCAD通貨ペアの1時間のタイムフレームでの振動取引に焦点を当てていることです。このプロフェッショナルなアプローチは、市場の振動の本質を捉えることで、最大の効率と収益性を確保します。 UniTradeXpertはリスク管理に注力し、堅固なストップロスメカニズムを組み込んでおり、市場の変動中に資本を保護し、安心感を提供します。この戦略的アプローチにより、マーチンゲールのような高リスクな戦略を採用することなく、長期的な成功を確保します。 UniTradeXpertの真の特長は、ユーザーセントリックなアプローチにあります。3つの推奨される資金管理戦略を慎重に組み込み、視覚的に魅力的なグラフィ
The Trend Professor is a moving average based indicator designed for the purpose of helping the community of traders to analyse the price trend. The indicator will be displayed in the main chart as it is indicated on the screenshot section. How it works The indicator has lines of moving averages and colored histograms to depict the direction of the trend. There will be a fast signal line colored blue/yellow/red at some points. The red/yellow colored lines stands for bearish trend/signal while th
The 4 headed dragon is an indicator that has two functions. 1) Set the background trend. 2) Mark the predominant trend. By combining these two indicator signals, we will be able to trade for or against the trend, adapting the signals to your reading of the market. You can download the demo and test it yourself. 1) Set the background trend.   Define four possibilities of trend that are the four heads of the dragon, marked by colors on the indicator, marking a) Powerful buying trend. b) Weak
The Pairs Cross indicator is a unique tool for negatively correlated trading instruments, such as EURUSD and USDCHF currency pairs. It is based on a concept called pairs trading (or spread trading). Our indicator compares the strength of two currency pairs that are inversely correlated and quickly tells you when it’s time to buy the first pair and short a second pair, and vice versa. This is a straightforward approach to trading currency pairs that works very well. How to you use the Pairs Cro
The arrow indicator for Forex and Binary options is based on tick volumes. Unlike many volume indicators, the "Super volumes" indicator calculates bullish and bearish volumes and gives signals based on the predominance of any of them. If, say, there was an advantage of bullish volumes in this range at the moment, then the signal will be on Buy. Or if the predominance was bearish volumes, then, accordingly, the signal will be on Sell. In the indicator settings in the "volumes" variable, you can
A technical indicator that displays information about the trading volume in the form of a histogram of distribution by price levels. It is used as an independent indicator that helps to evaluate the current objective situation of the instrument, as well as in the format of integration with other methods of analysis, to confirm or filter when making trading decisions. Key Features: Interactive profile update, real-time work Five modes of histogram calculation The possibility of separating the vol
Do you want to beat the market? This indicator uses advanced mathematical formulae That include regression analysis to predict market trends. So what happens is  That when the price is above the indicator line as depicted in the screenshot The trend is rising and when the price is below the indicator line the Trend is falling. This opportunities appear multiple times each day enabling You to profit. This indicator makes the trend your friend.
This EA has been developed, tested and traded live on NASDAQ M15 TF. Everything is ready for immediate use on real account. Very SIMPLE STRATEGY with only FEW PARAMETERS. Strategy is based on EXPANSION ON THE DAILY CHART. It enters if volatility raise after some time of consolidation. It uses STOP pending orders with ATR STOP LOSS. To catch the profits is a TRAILING PROFIT function in the strategy.  EA has been backtested on more than 10-year long tick data with 99% quality of modeling and verif
This is a fully automatic Expert Advisor. It can trade any market, any timeframe and any currency pair. The EA uses simple indicators like SMA, RSI and CCI, and a smart martingale system, that does not open systematical new positions, but waits for a new signal for each new order, wich is limiting drawdown compared to other martingale systems. It uses a combination of seven strategies you can select in the parameters to fit your needs. The strategy tester in MetaTrader 4 can give you the setup y
GridProfit
Hafis Mohamed Yacine
Grid Profit  Grid Profit EA Working with all pairs. TimeFrame - 5-15-30-1H Minimum Deposit Recommended : $1000 USD lot 0.01  Grid Profit EA  V 1.00  would probably come about in the event the volatility to your commodity begins to diminish. In the case some sort of examine benefits are generally in the beginning to travel sideways, that ATR profit would probably figure out how to drop off of. This can trigger that trailing terminate to travel in excess since examine benefits began to be way
MT5 Version: https://www.mql5.com/en/market/product/124107 A Day in the Life of a Trader: Discovering the Forex Matrix Dashboard In the fast-paced world of forex trading, keeping track of multiple currency pairs can feel overwhelming. That’s where the   Forex Matrix Dashboard   comes in, making the life of a trader much easier. Imagine opening the dashboard and instantly seeing all your favorite currency pairs, like EUR/USD, GBP/USD, and USD/JPY, displayed clearly with their latest prices. No mo
Mr Pip Scalping Indicator is a momentum indicator that measures the magnitude of recent price changes to evaluate overbought or oversold conditions in the price of a stock or other asset with few major tweaks. This is NOT RSI. Features V2: Added Supply/Demand Filter You can select which zone to see on the chart ( Important Resistance/Support; Verified Resistance/Support; etc ).  You get alerts when prices is entering on a specific supply/demand zone. How to use? When the signal comes, you will
A combination of trend, pullback, range breakouts and statistics in one indicator Mainly functions as an Entry indicator. Works in any pair and timeframe. Suggested Combination Cluster Helix with Strength Meter Strategy: Confirm signals with ideal strength levels Watch Video: (Click Here) Features Detects range breakouts on pullback zones in the direction of the trend Analyzes statistics of maximum profits and calculates possible targets for the next signal Flexible tool, can be used in many w
The indicator is the main part of Michael Huddleston's ICT (Inner Circle Trader) trading strategy. His legendary trading strategy is based on the concept of "Smart Money". To analyze the medium -term trend , the  ICT offers an analysis based on  twenty -day levels . The indicator builds levels , while showing the turning points with arrows . An important feature of the indicator is the automatic display of levels for different periods . You do not have to change the indicator settings when chang
このプロダクトを購入した人は以下も購入しています
Trend SniperX MT4
Sarvarbek Abduvoxobov
5 (3)
Trend Sniper X は、トレーダーがトレンドの方向性と潜在的な反転ポイントを明確かつ正確に特定できるように設計された、MetaTrader 5 用のマルチタイムフレーム・トレンドフォロー指標です。 MT5版はこちら: https://www.mql5.com/en/market/product/181101 価格情報: 現在の価格はプロモーション価格であり、今後のアップデートや新機能の追加に伴い変更される場合があります。 Code2Profit チャンネル マルチタイムフレーム分析で市場をマスターしよう! Trend Sniper Xで勝率を最大化する方法:ルールとセッションのコツ 技術仕様 プラットフォーム MetaTrader 5 インジケータータイプ マルチタイムフレーム・トレンドインジケーター 動作タイムフレーム すべてのチャート時間足(上位足M1~MN1を独立して選択可能) 主要対象銘柄 為替(Forex)、ゴールド(XAUUSD)、その他のCFD 推奨口座 すべての口座タイプ ビジュアル表示 トレンドカラーローソク足(買い/売り/弱い/変化)+ 買い/売りシグナル
Miraculous Indicator Binary & Forex v3 StrategySafe Miraculous Indicator Binary & Forex v3 StrategySafe は、明確なシグナル、強力な確認ツール、そして Binary と Forex 市場で使える体系的な取引アプローチを求めるトレーダー向けのプロフェッショナル指標です。 v3 では、MIR Dashboard、Miraculous Confirmation Dashboard、GANN Law、Square of 9 レベル、GANN 角度、そしてより高度な Forex モードが搭載されています。 主な特徴 Binary と Forex の両方に対応。 MIR Dashboard による素早い市場分析。 Miraculous Confirmation Dashboard によるエントリー確認。 Forex 分析用の GANN Law drawing lines。 Square of 9 のライン、レベル、方向表示。 1x1 GANN Angle によるトレンド圧力の確認。 Entry I
SR Liquidity は、市場の流動性が集中し、価格が最も強く反応する「隠れたゾーン」を可視化するために設計されたトレーディング指標です。こうした流動性の高いエリアは強力なサポート(支持)およびレジスタンス(抵抗)レベルとして機能し、市場が反転する可能性が最も高いポイントを明確に示してくれます。 単なる一般的なサポートラインやレジスタンスラインを描画するのではなく、「SR Liquidity」は実際の価格変動を分析し、売りと買いの圧力が集中するゾーンを特定します。これらは、市場の真の動きを牽引する「流動性のプール(溜まり場)」そのものです。それらをチャート上に直接可視化することで、価格が実際に反応する前に、その動きを予測することが可能になります。つまり、このインジケーターは価格の方向性が変わる可能性を予測するのです。生のプライスアクションを、市場の重要な水準(転換点となり得るポイント)を示す、明確で実用的なロードマップへと変換してくれます。 このインジケーターは、FX、株価指数、貴金属、仮想通貨など、あらゆる銘柄や時間足で使用可能です。 ご購入後、取引手順や無料の優れた追加インジケ
Gann Made Easy は、ミスター・ギャンの理論を使用した取引の最良の原則に基づいた、プロフェッショナルで使いやすい外国為替取引システムです。 W・D・ガン。このインジケーターは、ストップロスとテイクプロフィットレベルを含む正確な買いと売りのシグナルを提供します。 PUSH通知を利用して外出先でも取引可能です。 ご購入後、取引方法の説明と優れた追加インジケーターを無料で入手するには、私にご連絡ください! おそらく、ギャンの取引手法についてはすでに何度も聞いたことがあるでしょう。通常、ギャンの理論は初心者のトレーダーだけでなく、すでにある程度の取引経験がある人にとっても非常に複雑なものです。なぜなら、ギャンの取引手法は理論的にはそれほど簡単に適用できるものではないからです。私はその知識を磨き、最良の原則を私の外国為替インジケーターに組み込むために数年を費やしました。 このインジケーターは非常に簡単に適用できます。必要なのは、それをチャートに添付し、簡単な取引推奨事項に従うだけです。このインジケーターは常に市場分析の仕事を行い、取引の機会を探します。適切なエントリーポイントを検出す
プレシジョン・インデックス・オシレーター(Pi-Osc)は、Precision Trading SystemsのRoger Medcalfによるものです。 バージョン2は、チャートにスーパーファストでロードされるように注意深く再コードされ、その他の技術的な改良も組み込まれて、エクスペリエンスを向上させています。 Pi-Oscは、市場が強制的に行かなければならない、すべての人のストップを取り除くためのポイントである、極限のエクソースト・ポイントを見つけるために設計された正確な取引タイミング信号を提供するために作成されました。 この製品は、極限のポイントがどこにあるかを知るという古代の問題を解決し、トレーダーの生活をはるかにシンプルにします。 これは、業界標準のオシレーターとは異なる強力な要素を持つ高度なコンセンサス・インジケーターです。 使用されている一部の機能には、需要指数、マネーフロー、RSI、スティリング、パターン認識、出来高分析、標準偏差の極値などがあり、異なる長さでこれらのバリエーションが多く含まれています。 初めて見ると、訓練されていない目には、他のオシレーター
DayTrader PRO MT5:  https://www.mql5.com/en/market/product/186222 DayTrader PROは、ジョン・エリュース(John Ehlers)のラグuerreフィルターと強力な自動最適化エンジンを組み合わせた、高度なトレーディング・インジケーターです。固定されたパラメーターを使用するのではなく、直近の市場状況に基づいて最適な設定を自動的に検索するため、手動による絶え間ない調整をすることなく、変化する市場のボラティリティに適応できます。 本インジケーターは、明確な「買い(BUY)」および「売り(SELL)」シグナルを生成し、現在の市場ボラティリティから算出された適応型のストップロス(Stop Loss)およびテイクプロフィット(Take Profit)レベルを表示します。トレンド、効率レシオ(Efficiency Ratio)、ボラティリティ、およびローソク足フィルターが内蔵されており、精度の低いセットアップを排除し、シグナルの精度を向上させます。 リアルタイム・パフォーマンスパネルには、現在最適化されている設定、プロフィッ
通貨強さウィザードは、取引を成功させるためのオールインワン ソリューションを提供する非常に強力な指標です。このインジケーターは、複数の時間枠のすべての通貨のデータを使用して、このまたはその外国為替ペアのパワーを計算します。このデータは、使いやすい通貨インデックスと通貨パワーラインの形式で表され、特定の通貨のパワーを確認するために使用できます。 必要なのは、取引したいチャートにインジケーターを接続することだけです。インジケーターは、取引する通貨の実際の強さを示します。このインジケーターは、トレンドに合わせて取引するときに有利に利用できる売買高の圧力の極値も示します。このインジケーターには、フィボナッチに基づく可能なターゲットも表示されます。 このインジケーターは、PUSH 通知を含むあらゆるタイプのアラートを提供します。 購入後ご連絡下さい。私の取引のヒントをあなたと共有し、素晴らしいボーナスインジケーターを無料で提供します! 幸せで有益な取引をお祈りします。
M1 Sniper
Oleg Rodin
4.97 (30)
M1 SNIPER は使いやすいトレーディングインジケーターシステムです。M1時間足向けに設計された矢印インジケーターです。M1時間足でのスキャルピングのためのスタンドアロンシステムとして、また既存のトレーディングシステムの一部としても使用できます。このトレーディングシステムはM1時間足での取引に特化して設計されていますが、他の時間足でも使用できます。元々、この手法はXAUUSDとBTCUSDの取引用に設計しましたが、他の市場においても役立つと考えています。 インジケーターのシグナルは、トレンドの方向と逆方向に取引できます。インジケーターのシグナルを利用して両方向に取引するのに役立つ特別な取引テクニックをご紹介します。この手法は、特別な動的なサポートとレジスタンスの価格帯を利用することに基づいています。 ご購入後、M1 SNIPER矢印インジケーターをすぐにダウンロードできます。さらに、M1 SNIPERツールのすべてのユーザーに、以下のスクリーンショットに表示されているApollo Dynamic SRインジケーターを無料で提供しています。この2つのインジケーターを組み合わせることで
PRO Renko Systemは、特別にRENKOチャートを取引するために設計された高精度の取引システムです。 これは、様々な取引商品に適用することができる普遍的なシステムです。 システムは効果的に正確な逆転信号へのアクセスを与えるいわゆる市場の騒音を中和する。 表示器は非常に使いやすく、信号の生成に責任がある1つの変数だけがあります。 あなたは簡単にお好みの任意の取引ツールとレンコバーのサイズにツールを適応させることができます。 私はいつもあなたが私のソフトウェアで収益性の高い取引を支援するために余分なサポートを提供する準備ができています! 私はあなたに幸せで収益性の高い取引をしたいです! ご購入後にご連絡ください! 私はあなたに私のレンコチャートジェネレータを送信します。 私はまた、私の個人的な推奨事項やシステムの他のモジュールを無料で共有します!
スイングトレーディング は、トレンドの方向のスイングと可能な反転スイングを検出するように設計された最初のインジケーターです。トレーディングの文献で広く説明されているベースラインスイングトレーディングアプローチを使用します。インディケータは、いくつかの価格と時間のベクトルを調査して、全体的なトレンドの方向を追跡し、市場が売られ過ぎまたは買われ過ぎて修正の準備ができている状況を検出します。 [ インストールガイド | 更新ガイド | トラブルシューティング | よくある質問 | すべての製品 ] むち打ちを起こさずに市場スイングの利益 インジケーターは常にトレンドの方向を表示します 色付きの価格帯は機会のベースラインを表します 色付きのダッシュは、可能な反転スイングを表します この指標は、独自の品質とパフォーマンスを分析します 複数時間枠のダッシュボードを実装します カスタマイズ可能なトレンドおよびスイング期間 電子メール/サウンド/プッシュアラートを実装します インジケータは再描画またはバックペインティングではありません Swing Tradingとは Swing Tradingは
この製品は 2026 年の市場向けに更新され、最新の MT5 ビルドに最適化されています。 価格更新のお知らせ: Smart Trend Trading System は現在 $99 で提供されています。 次の 30 件の購入 後、価格は $199 に上がります。 特別オファー: Smart Trend Trading System を購入後、私にプライベートメッセージを送ることで、 Smart Universal EA を無料 で受け取り、Smart Trend のシグナルを自動売買に変えることができます。 Smart Trend Trading System は、リペイントなし、再描画なし、遅延なしの完全なトレーディングシステムです。よりクリーンなシグナル、より明確なトレンド方向、そしてより整理された取引方法を求めるトレーダー向けに作られています。 Online course , manual and [download presets] . このシステムは、トレンド検出、反転ゾーン、Smart Cloud、トレーリングストップロジック、サポートとレジスタンス、ローソク足の色分け
TPA True Price Action indicator reveals the true price action of the market makers through 100% non-repainting signals (except early signals mode) strictly at the close of a candle! TPA shows entries and re-entries, every time the bulls are definitely stronger than the bears and vice versa. Not to confuse with red/green candles. The shift of power gets confirmed at the earliest stage and is ONE exit strategy of several. There are available now two free parts of the TPA User Guide for our custom
Quantum Naked SMC Prime is a streamlined Smart Money Concepts indicator designed for traders who prefer a clean chart, structured market analysis and clear visual trade setups without unnecessary complexity. The indicator combines market structure, liquidity behavior, institutional zones and confirmation logic into a compact analytical framework. Instead of flooding the chart with technical indicators, Quantum Naked SMC Prime focuses on the core elements of price action and Smart Money Concepts.
KURAMA GOLD SIGNAL PRO MT4版 ゴールドのサインに、目で見えるトレード計画を。 ゴールドのサインが出た。利確はどこか。損切りはどこか。エントリー前に何を確認すべきか。 KURAMA GOLD SIGNAL PROは、その判断材料をチャートに集約します。XAUUSDのM5、M15向けに、売買サイン、自動計算TP/SL、3段階のサイン評価、注意すべき相場条件を知らせるMARKETパネルを搭載。 セットアップ、決済目安、相場の注意点を一か所で確認。情報を集める手間を減らし、トレードの判断に集中できます。 買い切り購入者限定特典 AI Zone Radar MT5版と完全PDFマニュアルを無料プレゼント。 ご購入後にMQL5でメッセージをお送りください。買い切り購入が対象です。レンタルは対象外です。 AI Zone Radarを見る サインから、具体的なトレード計画へ SMA 13、21、75、100へのタッチを使ったセットアップを検出。各サインに売買方向と対象MAを表示するため、浅い押し目、戻りと深い調整を区別して確認できます。 チャートとパネルには、次の情報を表示し
ご紹介     Quantum Breakout PRO は 、ブレイクアウト ゾーンの取引方法を変革する画期的な MQL5 インジケーターです。 13年以上の取引経験を持つ経験豊富なトレーダーのチームによって開発された Quantum Breakout PROは 、革新的でダイナミックなブレイクアウトゾーン戦略により、あなたの取引の旅を新たな高みに押し上げるように設計されています。 クォンタム ブレイクアウト インジケーターは、5 つの利益ターゲット ゾーンを備えたブレイクアウト ゾーン上のシグナル矢印と、ブレイクアウト ボックスに基づいたストップロスの提案を提供します。 初心者トレーダーにもプロのトレーダーにも適しています。 量子EAチャネル:       ここをクリック MT5バージョン:   ここをクリック 重要!購入後、インストールマニュアルを受け取るためにプライベートメッセージを送ってください。 推奨事項: 時間枠: M15 通貨ペア: GBPJPY、EURJPY、USDJPY、NZDUSD、XAUUSD アカウントの種類: ECN、Raw、またはスプレッドが非
Introducing the POWER TRADE Indicator Created by a small group of experienced traders with years of profitable experience in the financial markets, the Power Trade Indicator is a plug-and-play trading tool designed to help traders spot high-quality setups with ease and confidence. What It Does: It provides powerful entry signals, profit-taking zones, and rebound areas — giving you a complete view of where price action is most likely to move next. The indicator reacts in real time, al
Dark Support Resistance  is an Indicator for intraday trading. This Indicator is programmed to identify  Support and Resistance Lines , providing a high level of accuracy and reliability. Key benefits Easily visible lines Only the most important levels will be displayed Automated adjustment for each timeframe and instrument Easy to use even for beginners Never repaints, never backpaints, Not Lag 100% compatible with Expert Advisor development All types of alerts available: Pop-up, Email, Push
Scalper Inside PRO は日中トレンドの分析を助け、エントリー前にトレードを組み立てられるインジケーターです。中核となるのは、相場をより正確に読むための3つの専用ストラテジー。シグナルが出た瞬間に方向を自動で判断し、主要な価格帯を計算するので、想定エントリーポイント、予想ストップロス、複数の利確レベルを前もって確認できます。詳細なパフォーマンス統計が、各銘柄とストラテジーが過去にどう機能したかを示し、今の相場に合った資産選びを助けます。単体のスキャルピングツールとしても、あなたのシステムの一部としても、自作 EA のベースとしても使えます。MetaTrader 4 プラットフォームで動作します。 インジケーターはエントリー、3つの利確レベル - TP1、TP2、TP3、そして任意のストップロスをチャート上に直接表示します。自作の矢印インジケーターを接続し、その統計と収益性を検証することも可能です。 ご購入後は直接ご連絡ください。専用のボーナス add-ons、実トレードでの活用に関する追加情報、そしてご自身のトレードシステムや EA への正しい接続のサポートをお渡しします
トレンドトレーディング は、タイミングのプルバックとブレイクアウトにより、市場で起こっているトレンドから可能な限り利益を得るように設計された指標です。確立されたトレンドの中で価格が何をしているかを分析することにより、取引の機会を見つけます。 [ インストールガイド | 更新ガイド | トラブルシューティング | よくある質問 | すべての製品 ] 自信を持って効率的に金融市場を取引する むち打ちにならずに確立されたトレンドから利益を得る 収益性の高いプルバック、ブレイクアウト、早期の逆転を認識する この指標は、独自の品質とパフォーマンスを分析します 複数時間枠のダッシュボードを実装します インジケーターは再描画されていません 電子メール/音声/視覚アラートを実装します 確立されたトレンドは多くの取引機会を提供しますが、ほとんどのトレンド指標はそれらを完全に無視しています。インジケーターの解釈はかなり簡単です: (1) トレンドの変化 (2) トレンドの方向への後退 (3) トレンドの方向へのブレイクアウト 赤いダッシュ は下降トレンド中の修正です 青いダッシュ は上昇トレンド中
This is a professional chart indicator designed for traders focused on stability and clear price action. It helps filter market noise and provides clear visual entry and exit zones for your trading decisions. Core Features: Strictly Non-Repainting: The system is built with strict non-repaint logic. What you see on the chart is the true historical performance. Confirmed Signals: Signals are triggered and confirmed only after the candle closes . Once a trading arrow appears on a closed candle, it
現在30%OFF! 初心者やエキスパートトレーダーのためのベストソリューション! このダッシュボードソフトウェアは、28の通貨ペアで動作しています。それは私達の主要な指標(高度な通貨の強さ28と高度な通貨インパルス)の2に基づいています。それは全体の外国為替市場の大きい概観を与えます。それは、すべての(9)時間枠で28の外国為替ペアのための高度な通貨の強さの値、通貨の動きの速度と信号を示しています。チャート上で1つのインディケータを使用して市場全体を観察し、トレンドやスキャルピングの機会をピンポイントで見つけることができたら、あなたのトレードがどのように改善されるか想像してみてください。 このインディケータには、強い通貨と弱い通貨の識別、潜在的な取引の識別と確認がより簡単になるような機能が搭載されています。このインディケータは、通貨の強さや弱さが増加しているか減少しているか、また、すべての時間枠でどのように機能しているかをグラフィカルに表示します。 新機能として、現在の市場環境の変化に適応するダイナミックなマーケットフィボナッチレベルが追加され、すでに当社のAdvanced
このインジケーターは、反転ポイントと価格戻りゾーンを正確に表示します。     主要プレーヤー 。新たなトレンドが形成される場所を把握し、最大限の精度で意思決定を行い、すべての取引をコントロールします。 TREND LINES PRO インジケーターと組み合わせることで、その潜在能力を最大限に発揮します。 VERSION MT5 インジケーターが示す内容: 新しいトレンドの始まりに活性化する反転構造と反転レベル。 リスクと報酬の比率を最小限に抑えた利益 確定 と 損失停止の レベルの表示     RR 1:2   。 インテリジェントな削減ロジックによるストップロス。 指定されたインジケーターから 2 つのトレンド タイプの反転パターンを表示します。 指標: トレンドを追う   TREND LINES PRO   (世界的なトレンドの変化) TREND PRO   (クイックトレンド変更) シンプルで効果的   スキャナー   リアルタイムトレンド(新機能)。 マルチタイムフレームのインストゥルメント フィルタリング。 画面   利益     LOGIC AI信号の後。 当日プラス方
Here   our MT5 version more valuable tools SMC Trend Trading   ,  Easy SMC Trading  ,  Institutional SMC Architect Volume Analysis Tools  ,  Volume flow Profile  ,  Market volume profile  , FVG with Volume  , Liquidity Heatmap Profile  ,  Volume Spread Analysis 2. Key Features Dynamic Filtering : The core feature. As soon as the current price crosses a historical liquidity level, that level disappears. This reduces chart clutter and prevents you from trading off "dead" support/resistance. Liqui
トレンドラインプロ   市場の真の方向転換点を理解するのに役立ちます。この指標は、真のトレンド反転と主要プレーヤーが再び参入するポイントを示します。 分かりますか     BOSライン   複雑な設定や不要なノイズなしに、より長い時間足でのトレンドの変化と重要なレベルを把握できます。シグナルは再描画されず、バーが閉じた後もチャート上に残ります。 VERSION MT 5     -     RFI LEVELS PRO インジケーター と組み合わせることで、その潜在能力を最大限に発揮します。 インジケーターが示す内容: 本当の変化   トレンド(BOSライン) 一度シグナルが現れたら、それは有効です!これは、リペイント機能を持つインジケーターとの重要な違いです。リペイント機能を持つインジケーターは、シグナルを発した後、それを変更し、資金の損失につながる可能性があります。これにより、より高い確率と精度で市場に参入できます。また、矢印が現れた後、目標値(利益確定)に達するか、反転シグナルが現れるまで、ローソク足の色を変更する機能もあります。 繰り返しエントリ       主要プレーヤーの
現在20%OFF! 初心者やエキスパートトレーダーに最適なソリューションです。 このインディケータは、エキゾチックペア・コモディティ・インデックス・先物など、あらゆるシンボルの通貨の強さを表示することに特化したインディケータです。金、銀、原油、DAX、US30、MXN、TRY、CNHなどの通貨の強さを表示するために、9行目にどのシンボルでも追加することができます。独自の機能を多数搭載し、新しい計算式を採用したため、ユニークで高品質、かつ手頃な価格のトレーディングツールとなっています。新しいトレンドやスキャルピングチャンスのトリガーポイントを正確に把握することができるため、あなたのトレードがどのように改善されるか想像してみてください。 ユーザーマニュアル:ここをクリック   https://www.mql5.com/en/blogs/post/708876 すべての時間枠に対応します。あなたはすぐにトレンドを見ることができるようになります! 新しいアルゴリズムに基づいて設計されているため、潜在的な取引の特定と確認がより簡単になります。これは、8つの主要通貨と1つのシンボルの強弱
この製品は 2026 年の市場向けに更新され、最新の MT5 ビルドに最適化されています。 価格更新のお知らせ: Atomic Analyst は現在 $99 で提供されています。 次の 30 件の購入 後、価格は $199 に上がります。 特別オファー: Atomic Analyst を購入後、私にプライベートメッセージを送ることで、 Smart Universal EA を無料 で受け取り、Atomic Analyst のシグナルを自動売買に変えることができます。 Atomic Analyst は、リペイントなし、再描画なし、遅延なしの Price Action トレーディングインジケーターで、手動取引、シグナルの明確化、EA 自動化のために設計されています。 User manual: settings, inputs and strategy.     &   User Manual PDF . 価格行動、強さ、モメンタム、マルチタイムフレーム方向、高度なフィルターを分析し、トレーダーがノイズを減らし、弱いセットアップを避け、より構造化された取引判断を行えるようにします。 こ
PipFinite Breakout EDGE
Karlo Wilson Vendiola
4.93 (488)
The Missing Edge You Need To Catch Breakouts Like A Pro. Follow a step-by-step system that detects the most powerful breakouts! Discover market patterns that generate massive rewards based on a proven and tested strategy. Unlock Your Serious Edge Important information here www.mql5.com/en/blogs/post/723208 The Reliable Expert Advisor Version Automate Breakout EDGE signals using "EA Breakout EDGE" Click Here Have access to the game changing strategy that will take your trading to the next l
Price & Time Market Structure Indicator A professional market structure tool that analyzes waves through both price and time — not price alone. Main Description NeoWave PRO is a professional market structure indicator for MetaTrader 4 designed for traders who want to move beyond traditional one-dimensional wave tools such as ZigZag, swing indicators, and basic high/low systems. Most wave indicators analyze only one thing: Price. But a real market wave is not only a price movement. A true wave de
MD Trend Pro — 4-Stage Trend Confirmation Indicator MD Trend Pro stops you from either jumping in too early on noise, or missing the move altogether by waiting for "perfect" confirmation. It only prints a signal once three independent trend tools agree, in the correct order — and it tells you when that signal is backed by extra strength. Pleas Note| You must have Template File for Results. Download Tamplate How it works — the 4-stage chain Stage 1 — Hull MA turns / changes colour, establishing
Neuro Poseidon is a new indicator by Daria Rezueva. It combines precise trading signals with adaptive TP/SL levels - creating best possible trades as a result! Message me and get  Neuro Poseidon Assistant  as a gift to automize your trading process! What makes it stand out? 1. Proven profitability on all assets and timeframes 2. Only confirmed BUY and SELL signals present on the chart 3. Adaptive TP & SL levels generated by the software for each trade 4. Easy to understand - suitable for all
作者のその他のプロダクト
Manzano Risk Reward Box The PRO version, including direct trade execution and automatic R-based trailing management, is available. For information about the PRO version, please contact us via MQL5 private message. Manzano Risk Reward Box is a visual trade planning and risk management tool for MetaTrader 5, designed to help traders prepare their positions directly on the chart before execution. It allows users to create visual BUY and SELL scenarios, define the percentage of the account they want
FREE
Harmonic Pattern Suite Pro Introduction Harmonic Pattern Suite Pro is an indicator designed to identify and display harmonic structures on the chart based on X-A-B-C-D sequences. Its purpose is to present pattern formations that meet geometric and proportional criteria, providing a clear visual representation directly on the chart. The indicator automates the detection process, removing the need for manual measurement of ratios and allowing the user to review the structural configuration withou
FREE
¡¡ 7-Day Free Trial!! info@manzanotrading.com Advanced Statistical Market Structure, Volume Analysis and Decision Support Framework for MetaTrader 5   Manzano Quant Engine is an advanced analytical indicator that combines adaptive trend modelling, statistical deviation analysis, volume-based market structure, multi-timeframe confirmation, and quantitative scoring — all within a single visual framework.   Its objective is not to predict future prices, but to help traders interpret market behaviou
Manzano Quant Engine Advanced Statistical Market Structure, Volume Analysis and Decision Support Framework for MetaTrader 5   Manzano Quant Engine is an advanced analytical indicator that combines adaptive trend modelling, statistical deviation analysis, volume-based market structure, multi-timeframe confirmation, and quantitative scoring — all within a single visual framework.   Its objective is not to predict future prices, but to help traders interpret market behaviour more effectively and ma
7-day free trial available with full functionality. Contact us at info@manzanotrading.com to request yours. Manzano Squeeze Pro is a professional squeeze momentum dashboard for MetaTrader 5. It is designed to identify periods of low volatility where the market is accumulating energy before a significant directional move, and to help traders position themselves in the direction of that move at the earliest possible moment. The core concept behind Manzano Squeeze Pro is volatility compression. Wh
If you would like a free 7-day trial with full access to all features, send me a private message on MQL5 and I will walk you through how to get the complete evaluation version. Manzano Market Intelligence Matrix Every trade is shaped by far more than the chart in front of you. Currency strength, asset correlations, market session, and overall portfolio exposure all influence any decision you make. Manzano Market Intelligence Matrix was built to deliver exactly that kind of context — all from a s
Manzano Institutional Structure Pro Request a free trial by direct message! Description Manzano Institutional Structure Pro brings together thirteen institutional analysis and Smart Money Concepts (SMC) modules in a single MetaTrader 5 indicator — market structure, liquidity, Order Blocks, Fair Value Gaps, multi-timeframe context and more — that would normally require installing and coordinating several separate indicators. The entire workspace is controlled from an interactive panel built direc
Smart Adaptive Trend Flow MT5 Professional adaptive trend, market structure, price levels and flow analysis indicator for MetaTrader 5. Would you like to test it before purchasing? You can request a fully functional trial version by sending us a private message through the MQL5 messaging system . This allows you to evaluate the indicator and all its features before making a purchase decision. A Complete Market View in a Single Chart Smart Adaptive Trend Flow MT5 has been developed to provide a
MANZANO ORDER FLOW PRO See what is happening inside the candle — not only where price has been. Manzano Order Flow Pro is a complete Order Flow workstation for MetaTrader 5, bringing Footprint, Bid x Ask, Delta, Cumulative Delta, Imbalances, Volume Profile, DOM, Time & Sales and Flow Intelligence together in one professional interface. Instead of combining multiple indicators, windows and panels, you can analyze execution, aggression, liquidity, volume distribution and market context from a sing
フィルタ:
レビューなし
レビューに返信