Gold Signal Pro with Auto TP SL

3.6

KURAMA GOLD SIGNAL PRO (MT5) — 7중 필터 · 자동 TP/SL · 품질 점수 · 시그널 기록 저장 | XAUUSD 완전 트레이딩 시스템


실시간 리페인트 없음. 시그널이 나타나는 순간 화살표, 진입, TP, SL이 그 자리에 고정되어 이후 절대 움직이지 않습니다. 여러분이 거래하는 것은 바로 이 실시간 시그널입니다. 그리고 v7.20에서는 실제로 발신된 모든 시그널이 자동 저장되어 재시작 후에도 정확히 복원됩니다.


━━━━━━━━━━━━━━━━

구매자 전용 보너스

━━━━━━━━━━━━━━━━

평생 라이선스를 구매하시면 AI Zone Radar($59 상당) + 완전 PDF 매뉴얼을 무료로 드립니다. 제품 가격에 더해 $59 상당의 보너스가 따라옵니다. 구매 후 MQL5로 메시지를 보내주세요.

AI Zone Radar: https://www.mql5.com/en/market/product/175834


골드 트레이더 커뮤니티에서 실제로 사용되며 정확성과 사용 편의성으로 높은 평가를 받고 있습니다.


━━━━━━━━━━━━━━━━━━━━

당신의 문제 — 그리고 그 해결책

━━━━━━━━━━━━━━━━━━━━

골드는 하루에 $30~$50 움직입니다. 기회가 있다는 것은 알고 있습니다. 하지만 이런 경험 있지 않나요?


- 너무 일찍 진입해서 $10 역행한 뒤에야 원하는 방향으로 움직인다

- 이동평균선에 닿을 때마다 진입해서 절반은 잃는다

- TP/SL 기준이 없어서 너무 오래 들고 있거나 너무 빨리 청산한다

- 움직이지 않는 시간대에 거래하며 왜 안 되는지 고민한다


KURAMA GOLD SIGNAL PRO는 이 모든 것을 해결하기 위해 만들어졌습니다. 하나의 필터가 아니라, 일곱 개의 필터로.


━━━━━━━━━━━━━━━━━━━━

사용법 — 3단계

━━━━━━━━━━━━━━━━━━━━

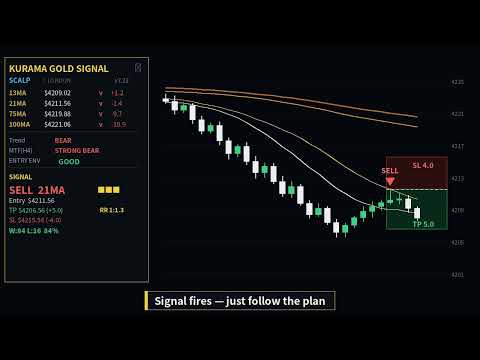
1. 차트에 화살표 시그널이 표시됩니다

2. 패널에서 TP 가격, SL 가격, 품질 점수, 손익비를 확인합니다

3. 주문을 넣고 기다립니다


추측 불필요. 복잡한 분석 불필요. 화살표를 따르고, 숫자로 관리하세요.


━━━━━━━━━━━━━━━━━━━━

진입만이 아니다 — 청산 계획까지 완전 표시

━━━━━━━━━━━━━━━━━━━━

대부분의 인디케이터는 진입만 알려주고 나머지는 방치합니다.


이 인디케이터는 시그널 발생 시 모든 것을 표시합니다:


- 화살표: 진입 방향과 가격

- 초록 구역: 익절 목표와 정확한 가격

- 빨강 구역: 손절 레벨과 정확한 가격

- 패널: TP, SL, 손익비, 품질 점수를 숫자로 표시


표시된 숫자를 그대로 주문에 입력하기만 하면 됩니다. 계산 불필요.


━━━━━━━━━━━━━━━━━━━━

7개의 독립 필터 — 진정한 엣지

━━━━━━━━━━━━━━━━━━━━

시그널이 표시되기 전에 시장은 7개의 필터를 동시에 통과해야 합니다:


필터 1 — 변동성 이상 감지: ATR 스파이크와 죽은 시장에서 시그널을 차단합니다.

필터 2 — 이동평균 구조 점검: SMA 13/21/75/100의 배열을 검증합니다.

필터 3 — 추세 방향 필터: 이동평균의 기울기와 가격 위치를 복합 판단합니다.

필터 4 — 이동평균 각도 필터: 실제 이동평균 각도를 측정합니다. 평평한 이동평균 = 시그널 없음. 횡보장의 손실을 제거합니다.

필터 5 — 상위 시간프레임 필터(H4): M5/M15 진입 전에 H4 추세를 확인합니다.

필터 6 — RSI 필터: 과매수/과매도 극단 위치에서의 진입을 차단합니다.

필터 7 — 관통 차단: 진짜 눌림목과 돌파를 구분합니다.


필터 미통과 = 시그널 없음 = 거래 안 함. 시장의 대부분 XAUUSD 인디케이터는 1~2개의 필터를 씁니다. 이것은 7개입니다.


━━━━━━━━━━━━━━━━━━━━

3단계 필터 레벨

━━━━━━━━━━━━━━━━━━━━

SAFE [S] — 최대 필터링. 첫 터치 필터 ON. 시그널 최소, 정확도 최고.

STANDARD(기본값) — 균형 모드. 품질과 빈도의 최적 균형. 권장.

ACTIVE [A] — 필터 완화. 시그널 증가. 저스프레드 계좌 전용. 품질 점수로 수동 필터링 권장.


파라미터에서 원클릭 전환. TP/SL 계산은 어느 레벨에서도 동일합니다.


━━━━━━━━━━━━━━━━━━━━

모든 시그널에 품질 점수

━━━━━━━━━━━━━━━━━━━━

★★★ — 모든 조건 완벽. 강한 셋업. TP 넓게.

★★ — 견고한 셋업. 표준 TP/SL. 메인 거래.

★ — 조건 불확실. TP/SL 좁게. 랏 축소 또는 보류 권장.


점수를 통해 리스크 관리가 자동으로 이루어집니다.


【v7.20 신규】패널에는 별 등급별 승패 집계도 표시됩니다. 어떤 품질 점수가 현재 시장에서 작동하는지 직접 확인할 수 있습니다.


━━━━━━━━━━━━━━━━━━━━

【v7.20 신규】근거 태그 — 왜 이 시그널이 나왔는가

━━━━━━━━━━━━━━━━━━━━

모든 시그널에 발생 근거가 태그로 표시됩니다. 블랙박스가 아닙니다.


FT — 첫 터치(해당 이동평균에 대한 첫 번째 터치)

RT — 재터치(두 번째 이후)

TREND — 추세 방향과 일치

H4 — 상위 시간프레임(H4) 방향과 일치

PO — 퍼펙트 오더 성립 중

VOL — 변동성이 건전한 범위


태그가 많을수록 여러 근거가 겹친 시그널입니다. 품질 점수와 함께라면 자신 있게 진입 판단을 할 수 있습니다. 태그는 스마트폰 푸시 알림에도 표시되므로 차트를 보지 않아도 근거를 알 수 있습니다.


━━━━━━━━━━━━━━━━━━━━

동적 TP/SL — 매번 시장에 적응

━━━━━━━━━━━━━━━━━━━━

고정 TP/SL은 시장이 매일 바뀌기 때문에 작동하지 않습니다. 이 인디케이터는 다음을 바탕으로 매번 새로 계산합니다:


- 어느 이동평균에 닿았는가

- 품질 점수

- 현재 변동성

- 연속 시그널 횟수


지금 시장에 맞는 TP/SL이 나옵니다.


━━━━━━━━━━━━━━━━━━━━

4개의 이동평균 — 4가지 거래

━━━━━━━━━━━━━━━━━━━━

13MA — 얕은 눌림목. 빠른 스캘프. 좁은 TP/SL. 퍼펙트 오더만.

21MA — 표준 눌림목. 가장 빈번한 시그널. 균형 잡힌 TP/SL.

75MA — 깊은 눌림목. 넓은 TP/SL.

100MA — 가장 깊은 눌림목. 주요 지지/저항. 넓은 TP/SL.


패널이 어느 이동평균이 트리거됐는지 알려줍니다.


━━━━━━━━━━━━━━━━━━━━

완전 패널 — 필요한 정보가 모두 한 화면에

━━━━━━━━━━━━━━━━━━━━

- 4개 이동평균의 값·기울기·가격으로부터의 거리

- 필터 레벨: [S], [A] 또는 공백

- 추세: Strong Bull / Bull / Range / Bear / Strong Bear

- H4 상위 시간프레임 컨텍스트

- ATR(Normal/Spike/Low 상태 포함)

- RSI 값

- ENTRY ENV: 현재 진입 환경 종합 판단(GOOD/CAUTION/NG)

- 현재 시그널: 방향, 이동평균 종류, 품질, 근거 태그, TP, SL, 손익비

- 21MA 기반 트레일링 SL 참고값

- 별 등급별 승패 카운터

- 스프레드 모니터: 초록/노랑/빨강

- 캔들 카운트다운 타이머


━━━━━━━━━━━━━━━━━━━━

【v7.20 신규】시그널 기록 자동 저장 및 복원

━━━━━━━━━━━━━━━━━━━━

시그널 인디케이터에 대한 흔한 불만은 늘 "재시작하면 시그널이 사라진다"는 것이었습니다. v7.20에서 해결했습니다.


- 발생한 모든 시그널을 자동으로 파일에 기록

- MT5 재시작, 차트 재로딩, 인디케이터 재적용 후에도 화살표, TP/SL, 구역을 자동 복원

- 복원되는 것은 "실제로 발신된 시그널" 그 자체

- VPS 이전이나 PC 교체 시에도 기록 파일을 복사하면 이어받기 가능


과거 시그널이 남아 있으므로 자신의 눈으로 실적을 검증할 수 있습니다. 숨겨진 결과는 없습니다.


또한 v7.20에서는 차트 재로딩 시 같은 시그널이 중복 알림되던 현상도 해결했습니다. 새 시그널만 알림됩니다.


━━━━━━━━━━━━━━━━━━━━

스크롤해서 검증

━━━━━━━━━━━━━━━━━━━━

모든 과거 시그널이 TP/SL 구역과 함께 차트에 남습니다. 초록 구역 도달 = TP 히트. 빨강 구역 도달 = SL 히트. 숨겨진 결과 없음. 직접 확인하세요.


━━━━━━━━━━━━━━━━━━━━

두 가지 모드

━━━━━━━━━━━━━━━━━━━━

SCALP M5 — 빠름. 좁은 TP/SL. 추세 세션 중 액티브 거래.

DAY M15 — 더 큰 목표. 더 엄격한 필터. 시그널은 적지만 품질이 높음.


가장 강력한 셋업: 둘을 나란히 표시. M15에서 방향 확인. M5에서 타이밍.


━━━━━━━━━━━━━━━━━━━━

알림

━━━━━━━━━━━━━━━━━━━━

PC에서 사운드 알림. MT5 모바일로 푸시 알림. 이메일도 설정 가능. 고품질 시그널에는 전용 사운드. 푸시 알림에는 근거 태그도 표시됩니다.


━━━━━━━━━━━━━━━━━━━━

골드 전용. 오직 골드.

━━━━━━━━━━━━━━━━━━━━

모든 필터, 임계값, TP/SL 계산이 XAUUSD 전용으로 처음부터 설계되었습니다. 세션 패턴, ATR 스파이크, 지표 발표 전 움직임 — 모두 고려되어 있습니다.


FX 인디케이터에 골드 설정을 끼워 넣은 것이 아닙니다. 골드 전용 인디케이터입니다.


━━━━━━━━━━━━━━━━━━━━

세션 자동 감지

━━━━━━━━━━━━━━━━━━━━

시드니, 도쿄, 런던, 뉴욕 — 브로커 서버 시간과 무관하게 자동 감지됩니다.


━━━━━━━━━━━━━━━━━━━━

스프레드 모니터

━━━━━━━━━━━━━━━━━━━━

초록 = GO. 노랑 = 주의. 빨강 = 대기. 항상 차트에 표시.


━━━━━━━━━━━━━━━━━━━━

실시간 리페인트 없음 — 그리고 재계산에 대해 솔직히 말씀드립니다

━━━━━━━━━━━━━━━━━━━━

【실시간 동작】

확정된 봉에 한 번 표시된 시그널은 그 봉 안에서 사라지거나 위치가 바뀌지 않습니다. 화살표, 진입, TP, SL은 표시되는 순간 고정되어 이후 움직이지 않습니다. 여러분이 실제로 거래하는 것은 이 실시간 시그널입니다. 여기에 지연도 리드로우도 없습니다.


【재계산에 대하여 — 숨기지 않고 말씀드립니다】

인디케이터를 재적용·재시작·시간프레임 전환하면 과거 봉은 내부 상태(쿨다운 등)를 0에서 다시 계산합니다. 이때 과거 "참고 화살표"의 표시 방식이 약간 달라질 수 있습니다. 이것은 리페인트가 아니라, 내부 상태를 가진 인디케이터에 공통된 재계산 동작이며, 플랫폼을 불문하고 표준적인 것입니다. 중요한 것은, 이것이 실시간 거래 결과에 전혀 영향을 주지 않는다는 점입니다. 여러분은 시그널이 나오는 순간에 거래하는 것이며, 과거 봉을 다시 그린다고 해서 진입·TP·SL·손익이 바뀌는 일은 없습니다.


그리고 v7.20에서는 실제로 발신된 모든 시그널을 자동으로 파일에 저장하고, 재시작 후 같은 위치에 복원합니다. 알림된 시그널 기록은 다시 쓰이지 않습니다.


【실제 사용자의 목소리】

바로 이 점에 대해 구매자 Violette 님은 리뷰에서 이렇게 적었습니다(MQL5 리뷰에서):

"새로고침 후 기록이 리페인트되더라도 전혀 문제가 되지 않습니다. 저는 2주 동안 계속 수익을 내고 있으니까요. 추천합니다."

실시간으로 거래하는 실제 사용자에게 재계산은 실전에서 문제가 되지 않는다 — 이것이 현장의 평가입니다.


━━━━━━━━━━━━━━━━━━━━

트레일링 SL

━━━━━━━━━━━━━━━━━━━━

패널이 21MA 기반 트레일링 값을 표시합니다. SL을 옮겨 수익을 확보하세요. 수동 실행.


━━━━━━━━━━━━━━━━━━━━

더 나은 결과를 위한 3가지 규칙

━━━━━━━━━━━━━━━━━━━━

1. M5와 M15의 방향이 일치할 때만 거래

2. ★★와 ★★★에 집중. ★는 건너뛰거나 최소 랏

3. 추세가 Range일 때는 건너뛰기. 추세 없음 = 엣지 없음


━━━━━━━━━━━━━━━━━━━━

이 인디케이터의 배경 — 12년

━━━━━━━━━━━━━━━━━━━━

팔기 위해 만든 것이 아닙니다. 제게 필요해서 만들었습니다. 12년간 오직 골드만 거래. 두 번의 계좌 파산. 모든 필터 임계값을 실제 자금으로 검증했습니다.


매일 제 거래에 사용하고 있습니다. 이제 여러분 차례입니다.


━━━━━━━━━━━━━━━━━━━━

사양

━━━━━━━━━━━━━━━━━━━━

플랫폼: MetaTrader 5

종목: XAUUSD 전용

시간프레임: M5 및 M15

권장 스프레드: $1.0 이하


━━━━━━━━━━━━━━━━━━━━

자주 묻는 질문

━━━━━━━━━━━━━━━━━━━━

Q: FX 통화쌍에 쓸 수 있나요? — 아니요. XAUUSD 전용입니다.

Q: M30이나 H1에 쓸 수 있나요? — 아니요. M5와 M15 전용입니다. 스윙을 원하시면 Gold Signal Swing Pro(M30/H1/H4)를 보세요.

Q: 파라미터를 조정해야 하나요? — 기본값이 최적화되어 있습니다. 필터 레벨만 변경 가능합니다.

Q: 시그널이 안 나옵니다? — 필터가 정상 작동 중입니다. 적절한 셋업을 기다리세요.

Q: 리페인트하나요? — 실시간으로는 하지 않습니다. 나온 시그널의 진입·TP·SL은 그 자리에 고정됩니다. 재적용이나 재시작을 하면 과거 참고 화살표가 재계산되지만, 이는 거래 결과에 영향을 주지 않습니다. 알림된 시그널은 v7.20에서 저장·복원됩니다.

Q: 재시작하면 시그널이 사라지나요? — 아니요. v7.20부터 자동 저장·복원됩니다.

Q: 매뉴얼이 있나요? — 있습니다. 구매 후 메시지를 주시면 PDF 매뉴얼과 AI Zone Radar 보너스를 드립니다.


━━━━━━━━━━━━━━━━━━━━

평생 라이선스 구매자 보너스

━━━━━━━━━━━━━━━━━━━━

평생 라이선스를 구매하시면 다음을 무료로 드립니다:


- AI Zone Radar($59 상당): 5단계 강도 스코어링을 탑재한 자동 지지·저항 감지 인디케이터

- 완전 PDF 매뉴얼: 설정 방법과 거래 규칙의 완전 가이드


렌탈은 대상이 아닙니다. 구매 후 MQL5로 직접 메시지를 주시면 둘 다 보내드립니다.

AI Zone Radar: https://www.mql5.com/en/market/product/175834


━━━━━━━━━━━━━━━━━━━━

제품 라인업

━━━━━━━━━━━━━━━━━━━━

MT4 버전도 준비되어 있습니다: https://www.mql5.com/en/market/product/170617


M30/H1/H4 스윙 버전도 있습니다 — M5/M15로는 잡을 수 없는 큰 파동을 노리는 분께. Gold Signal Swing Pro(M30/H1/H4). 1회 거래당 $20~$80+의 폭을 노립니다.

https://www.mql5.com/en/market/product/177643


━━━━━━━━━━━━━━━━━━━━

리뷰

━━━━━━━━━━━━━━━━━━━━

이 인디케이터가 유용하다고 느끼셨다면 꼭 리뷰를 남겨주세요. 여러분의 피드백이 다른 트레이더의 판단 자료가 됩니다.


━━━━━━━━━━━━━━━━━━━━

리스크 고지

━━━━━━━━━━━━━━━━━━━━

의사결정 지원 도구이며 투자 조언이 아닙니다. 과거 실적은 미래 결과를 보장하지 않습니다. XAUUSD는 변동성이 높아 큰 손실이 발생할 수 있습니다. 잃어도 괜찮은 자금으로만 거래하세요. 저스프레드 환경을 강력히 권장합니다.
리뷰 5
Yik Hung Lai
1381
Yik Hung Lai 2026.07.04 02:18 
 

i bought Gold Signal Pro with Auto TP SL and Gold Signal Swing Pro XAUUSD with Auto TP SL,very easy to use

Violette
665
Violette 2026.06.10 14:04 
 

I did buy a LOT of indicators of the market and they all went to the trash. This one is different because it's the first one which gives me good profit, i'm very satisfied of this indicator and the seller is very friendly. I for example had losses in my account because of an EA (which did go to the trash also) and within 1 week i did recover all thanks to this indicator, so thank you very much ! I must also say that even if the history repaints after refresh, it's absolutely not a problem as i'm continuesly doing profits since 2 weeks. I recommand.

jcasas311948 Casas
216
jcasas311948 Casas 2026.04.17 11:31 
 

El 18 de Abril del 2.026, alquile por un mes el indicador Gold Signal Pro with Auto TP SL y desde el primer momento, las señales fueron perfectas y el resultado de las primeras dos semanas fue espectacular: -Total de señales en el mercado de Londres y Nueva York = 110 -Total de señales en las que he entrado =57 - Operaciones positivas 55 (96,49%) - Resultados de los 9 días operados= 8.923$ RESULTADOS REALES 20/30- Abril 2.026 Total 9 dias Op. Total Señales Dia /Semana -177 100% Señales en M. Asiatico -67 38% S. en M. Londres + N.Y. -110 62% Señales de Venta -86 48,59% Señales de Compra -57 32,20% Solo mercado de London + NY Señales Buenas -77 70,00% Señales Malas -33 30,00% NO entrado -53 48,18% Entrado L/NY -57 51,82% Beneficio $ 9.313,85 Operaciones positivas -55 96,49% Perdida -$ 390,51 Operaciones Negativas -2 3,51% Resultado total SEMANA -$ 8.923,34 En la segunda semana pude constatar que el indicador tenia una serie de pequeñas incidencias en MT5 y se las manifesté al desarrollador, el cual en la actualización de hoy 7,13, parece que están todas superadas y mejorado el rendimiento en MT5. Por todo ello recomiendo este indicador Gold Signal Pro with Auto TP SL y yo confirmo que cuando venza el mes de alquiler , lo compraré definitivamente. Un saludo..... Atentamente: Jose Casas

Hoy domingo 17 de Mayo de 2026, confirmo que he adquirido la licencia de compra completa, espero recibir AI Zone Radar + manual PD.

Un saludo....... Atentamente: Jose Casas

Recibido.... Gracias.

추천 제품
표시기는 현재 시세를 작성하여 과거 시세와 비교할 수 있으며 이를 바탕으로 가격 변동을 예측합니다. 표시기에는 원하는 날짜로 빠르게 이동할 수 있는 텍스트 필드가 있습니다. 옵션: 기호 - 표시기가 표시할 기호 선택. SymbolPeriod - 지표가 데이터를 가져올 기간 선택. IndicatorColor - 표시기 색상. HorisontalShift - 지시자가 그린 따옴표를 지정된 막대 수만큼 이동합니다. Inverse - true는 인용 부호를 반대로, false - 원래 보기를 반전합니다. ChartVerticalShiftStep - 차트를 수직으로 이동합니다(키보드의 위/아래 화살표). 다음은 날짜를 입력할 수 있는 텍스트 필드의 설정으로, '엔터'를 누르면 즉시 이동할 수 있습니다.
Volume flow Profile
Israr Hussain Shah
Master Edition은 거래량과 자금 흐름의 관점을 통해 시장 구조를 시각화하도록 설계된 전문가급 분석 도구입니다. 표준 거래량 지표와 달리, 이 도구는 차트에 일일 거래량 프로필을 직접 표시하여 가격 발견이 발생한 위치와 "스마트 머니"가 위치한 곳을 정확하게 볼 수 있게 합니다. 이 Master Edition은 명확성과 속도를 위해 설계되었으며, 로드 시 차트 레이아웃을 즉시 아름답게 만드는 독특한 자동 테마 동기화 시스템을 특징으로 합니다. 주요 기능: 진정한 자금 흐름 계산: 표준 틱 거래량을 넘어섭니다. "Use Money Flow"를 활성화하면 거래량이 가격에 따라 가중치가 부여되어 특정 가격 수준에서의 실제 자본 투입을 드러냅니다. 가치 영역(VA) 시각화: 가치 영역(기본값: 거래량의 70%)을 자동으로 계산합니다. VA Fill: 통제 구역을 즉시 식별하기 위해 가치 영역 배경을 음영 처리합니다. 주요 수준: 통제점(POC), 가치 영역 고점(VAH), 가치 영
Blahtech Market Profile MT5
Blahtech Limited
5 (10)
Was: $249  Now: $99   Market Profile defines a number of day types that can help the trader to determine market behaviour. A key feature is the Value Area, representing the range of price action where 70% of trading took place. Understanding the Value Area can give traders valuable insight into market direction and establish the higher odds trade. It is an excellent addition to any system you may be using. Inspired by Jim Dalton’s book “Mind Over Markets”, this indicator is designed to suit the
Volume Profile Multiple — 알고리즘 트레이딩을 위한 버퍼 지원 다중 블록 볼륨 프로파일 타임프레임을 바꿀 때마다 볼륨 프로파일을 블록별로 다시 그리고 재계산하는 데 지치셨나요? Volume Profile Multiple 은 차트에 여러 개의 연속된 볼륨 프로파일을 자동으로 그려주어, 마지막으로 표시된 구간뿐만 아니라 시장의 각 구간에서 기관의 관심이 실제로 어디에 있었는지를 보여줍니다. 이 지표가 하는 일 이 지표는 가격 히스토리를 N개의 캔들 단위로 블록화합니다(블록 개수와 블록당 캔들 수는 자유롭게 설정 가능). 각 블록마다 완전한 볼륨 프로파일을 계산합니다: 컨트롤 포인트(POC), 밸류 에어리어 상단/하단(VAH/VAL), 그리고 고거래량 구간과 저거래량 구간(HVN/LVN)입니다. 그 결과 블록별 시장 구조를 시각화한 지도가 만들어지며, 이를 통해 실제 거래량 기반의 매집 구간, 지지/저항, 그리고 밸류 에어리어 간 가격 순환을 파악할 수 있습니다. 알고
VOLUME PROFILE SAF-XII MT5용 전문가급 마켓 프로파일 분석 도구 (그리드 스타일 트레이더를 위한 드림 인디케이터) 볼륨 프로파일(Volume Profile)이란? 볼륨 프로파일은 단순히 '시간'에 따른 거래량을 보여주는 일반 지표와 달리, 특정 '가격 수준'에서의 거래 활동을 표시하는 전문 기관용 도구입니다. 설정한 기간 내에 거래가 '어디서' 발생했는지를 시각화하여 다음을 식별할 수 있도록 돕습니다. 가치 영역 (VAH/VAL) – 전체 거래의 대부분이 발생한 가격대. 제어 지점 (POC) – 거래량이 가장 많이 집중된 단일 가격 수준. 유동성 불균형 – 각 가격대에서의 매수(Bull) vs 매도(Bear) 지배력. 지지/저항 – 실제 거래 활동에 기반한 자연적인 가격 지지 및 저항선. 3가지 작동 모드 – "설정 후 방치(Set and Forget)" 가능 VP_MANUAL (스윙 트레이딩 및 주요 레벨 분석) 사용자가 수직선을 드래그하여 분석 범위를 직접
MR Volume Profile 5
Sergey Khramchenkov
The "MR Volume Profile 5" indicator is a charting tool that displays trading volume at different price levels rather than time intervals. A key concept in volume profile is the point of control (POC)—the price level with the highest volume traded during the session or time range. While tools like VWAP or OBV provide volume trends, the "MR Volume Profile 5" indicator offers granular detail about where the most market activity occurs at specific price levels. This makes it a more precise tool for
Blahtech Supply Demand MT5
Blahtech Limited
4.57 (14)
Was: $299  Now: $99  Supply Demand uses previous price action to identify potential imbalances between buyers and sellers. The key is to identify the better odds zones, not just the untouched ones. Blahtech Supply Demand indicator delivers functionality previously unavailable on any trading platform. This 4-in-1 indicator not only highlights the higher probability zones using a multi-criteria strength engine, but also combines it with multi-timeframe trend analysis, previously confirmed swings a
Boom Crash SMC
Israr Hussain Shah
Here   our more valuable tools SMC Trend Trading   ,  Easy SMC Trading  ,  Institutional SMC Architect Volume Analysis Tools  ,  Volume flow Profile  ,  Market volume profile  , FVG with Volume  , Liquidity Heatmap Profile  ,  Volume Spread Analysis Deriv boom and crash index spike killer system you can use it only on m5 timeframe  follow the structure and get signal with alert on phone open trade set sl tp and enjoy easy analysis and trading made simple 
Here   our more valuable tools SMC Trend Trading   ,  Easy SMC Trading  ,  Institutional SMC Architect Volume Analysis Tools  ,  Volume flow Profile  ,  Market volume profile  , FVG with Volume  , Liquidity Heatmap Profile  ,  Volume Spread Analysis The    Liquidity Heatmap   is a sophisticated institutional trading tool designed to reveal where over-leveraged traders are trapped. By calculating estimated liquidation levels based on volume spikes and leverage, this indicator draws a dynamic "h
BoxChart MT5
Evgeny Shevtsov
5 (7)
The market is unfair if only because 10% of participants manage 90% of funds. An ordinary trader has slim changes to stand against these "vultures". This problem can be solved. You just need to be among these 10%, learn to predict their intentions and move with them. Volume is the only preemptive factor that faultlessly works on any timeframe and symbol. First, the volume appears and is accumulated, and only then the price moves. The price moves from one volume to another. Areas of volume accumu
This Volume Delta Profile is an advanced MetaTrader 5 indicator that visualizes   volume delta (order flow imbalance)   using a volume profile-style histogram. It shows the difference between buying and selling pressure at specific price levels, helping traders identify supply and demand zones. This indicator provides a unique perspective on market dynamics by visualizing the imbalance between buying and selling pressure, offering insights beyond traditional volume analysis. Core Concept Positiv
VR Grid Mt5
Vladimir Pastushak
3.25 (8)
VR 그리드 표시기는 사용자 정의 설정으로 그래픽 그리드를 생성하도록 설계 되었습니다. 표준 그리드 와 달리 VR 그리드는 원형 레벨 을 구축하는 데 사용됩니다. 사용자의 선택에 따라 라운드 수준 사이의 단계는 임의적일 수 있습니다. 또한 VR Grid는 다른 인디케이터나 유틸리티와는 달리 기간이 바뀌거나 단말기를 재부팅해도 그리드의 위치 를 유지합니다. 설정, 세트 파일, 데모 버전, 지침, 문제 해결 등은 다음에서 얻을 수 있습니다. [블로그] 다음에서 리뷰를 읽거나 작성할 수 있습니다. [링크] 버전 [MetaTrader 4] 수직 수준 은 실제 시간 간격을 기준으로 하며 누락 또는 존재하지 않는 기간은 무시 합니다. 따라서 레벨 사이의 단계는 사용자가 선택한 값과 엄격하게 일치합니다. VR 그리드 표시기를 사용할 때 트레이더는 모든 수준에서 스타일 , 수직선 및 수평선의 색상 및 두께를 변경할 수 있습니다. 이를 통해 금융 상품의 라운드 수준 을 제어할 수 있습니다. 라운
FREE
Wedge Pattern MT5
Sathit Sukhirun
Korean 이 보조지표는 차트 패턴 거래를 즐기는 트레이더를 위한 고급 차트 분석 비서 역할을 합니다. 시각적 분석의 부담을 줄이고 수익 창출의 정확성을 높이도록 설계되었습니다. 실제 사용 관점에서 본 이 보조지표의 주요 장점과 특징입니다: 1. 자동 패턴 감지 (Automated Pattern Detection) 시간 절약 및 편향(Bias) 감소: 수동으로 추세선을 그릴 필요가 없습니다. 인디케이터가 가격 스윙(Pivot High/Low)을 검색하고 가격 구조가 조건에 부합할 때 라이징 웨지(Rising Wedge, 상승 쐐기형) 및 폴링 웨지(Falling Wedge, 하락 쐐기형) 구조를 자동으로 그립니다. 모든 상황 포괄: 패턴이 형성되는 중, 브레이크아웃(돌파), 심지어 실패한 패턴까지 감지할 수 있어 시장의 전반적인 흐름을 명확하게 파악할 수 있습니다. 2. 내장된 목표가 및 피보나치 익절 (Built-in Targets & Fibonacci TP) 자동 목표가 계산:
GDS Renko Entry Helper - Free Renko Price Interaction Indicator for MetaTrader 5 GDS Renko Entry Helper is a free Renko price interaction indicator for MetaTrader 5. It helps traders highlight important areas where price reacts, slows down, returns to a zone or changes behavior around support and resistance. The tool is designed for manual Renko analysis. It does not generate buy or sell signals and does not tell the trader when to enter the market. Its purpose is to help focus attention on area
Skyblade Powerful Signals Pro Skyblade Powerful Signals Pro is a signal indicator for MetaTrader 5 that displays Buy and Sell signals directly on the trading chart. It is designed for both manual signal-based trading and integration with the compatible Skyblade Auto-Trader EA for automated execution. Main Features Buy and Sell signals displayed on the chart Non-repaint signal design Multi-chart operation Manual trading support Compatible with Skyblade Auto-Trader EA Different settings can be u
VibeFox Volume Profile — MetaTrader 5용 Volume Profile VibeFox Volume Profile는 MetaTrader 5를 위한 완전한 Volume Profile 도구 모음입니다. 거래된 거래량을 가격에 따라 수평으로 분포시켜 그려내므로, 시장이 가장 많은 활동을 보인 곳, 거래가 얇았던 곳, 그리고 어떤 가격 수준이 자석이나 장벽처럼 작용할 가능성이 높은지를 즉시 확인할 수 있습니다. 모든 프로파일은 차트 위에 직접 그려지며, 현대적이고 마우스로 조작하는 패널에서 제어됩니다 — 뒤져야 할 메뉴도, 첨부할 스크립트도 없습니다. 캔들만으로 지지와 저항을 추측하는 대신, 거래량의 실제 발자취로 작업합니다. 가격을 끌어당기는 고거래량 노드, 가격이 흔히 빠르게 통과하는 저거래량 간극, 그리고 대부분의 거래가 이루어진 공정 가치 구역입니다. 필요한 방식 그대로의 Volume Profile Volume Profile는 하나의 고정된 프로파일이 아닙니다
Here   our more valuable tools SMC Trend Trading   ,  Easy SMC Trading  ,  Institutional SMC Architect Volume Analysis Tools  ,  Volume flow Profile  ,  Market volume profile  , FVG with Volume  , Liquidity Heatmap Profile  ,  Volume Spread Analysis Transform Your Trading with Intelligent Market Insights! The 2025 Spike Killer Dashboard is a powerful MQL5 indicator that combines cutting-edge signal generation with an intuitive crystal dashboard for real-time market analysis. Designed for tra
Delta Profile Volume
Teresinha Moraes Correia
기술 설명 – MetaTrader 5용 Delta Profile Delta Profile 은 MetaTrader 5에서 정의된 캔들 범위 내의 거래량 흐름을 세부적으로 분석하기 위해 설계된 지표입니다. 이 도구는 각 가격 수준에서 양의 거래량(상승과 관련) 과 음의 거래량(하락과 관련) 간의 불균형을 구조화하고 시각화합니다. 이를 통해 사용자는 실제로 거래가 집중되는 가격 영역과 시장 불균형이 형성되는 구간을 명확하게 파악할 수 있습니다. 핵심 개념 지표는 가격 레벨 을 인식하고 이를 양의 거래량, 음의 거래량 및 순 델타(양-음 차이)로 분류합니다. 각 가격 레벨은 수평 막대 로 차트에 표시되며, 거래가 집중되는 구간을 직관적으로 보여줍니다. 사용자는 분석할 캔들의 개수 , 가격 반올림 정밀도 , 최대 표시 레벨 수 , 표시 옵션 등을 직접 설정할 수 있습니다. 주요 기능 가격 레벨 매핑 : 사용자가 지정한 자릿수에 맞게 가격을 반올림하여 거래량을 집계합니다. 순 델타 계산 : 양
ONNYX INDICATOR 버전 1.14 MetaTrader 5용 수요·공급 구역 분석 지표입니다. 확정된 스윙을 기준으로 구역을 생성하고 ATR로 폭을 조정하며 품질을 백분율로 표시합니다. 종가가 확정된 후 생성된 BUY/SELL 신호는 사라지지 않도록 설계되었습니다. 주요 기능 - 구역 내부에 품질 백분율을 표시하는 수요·공급 구역. - 확정 봉에서 나타나는 큰 BUY/SELL 화살표. - 선택 가능한 EMA 추세 필터와 캔들 거부 확인. - 추세, 가격 레벨 및 시장 상황 패널. - 관련 경제 뉴스 최대 5개 표시. 발표 전 Forecast/Previous, 발표 후 Actual 표시. - 60초 뉴스 갱신 및 전략 테스터용 캘린더 캐시. - 팝업, 푸시 및 이메일 알림. - iCustom 버퍼: 0=BUY 가격, 1=SELL 가격. 사용 방법 차트에 지표를 적용하고 히스토리 로딩을 기다린 뒤 추세와 활성 구역을 확인하십시오. 확정 봉 신호를 개인 리스크 관리와 함께 사용하십
TradeAQ
Guo Sheng Zhao
LuoMo Volume & Price Structure 8.98 A multi-function chart indicator for   MetaTrader 4 and MetaTrader 5 , designed to display key volume, volatility, sentiment, and price-structure information directly on the main chart. Main Features Volume and price-based Support & Resistance Volume spike and exhaustion signals ATR volatility expansion alerts Volume Profile with HVN and LVN Bullish and bearish sentiment distribution Developing or fixed POC VAH and VAL levels Supply and Demand zones Volume-wei
Deriv Boom and crash
Israr Hussain Shah
Here   our more valuable tools SMC Trend Trading   ,  Easy SMC Trading  ,  Institutional SMC Architect Volume Analysis Tools  ,  Volume flow Profile  ,  Market volume profile  , FVG with Volume  , Liquidity Heatmap Profile  ,  Volume Spread Analysis Boom: Take SELL signals only (price spikes up then crashes) Crash: Take BUY signals only (price drops then spikes up) SL goes beyond the line as labeled Interactive Market Watch Panel : A left-side sidebar showing real-time strength indicators (po
Haven Volume Profile
Maksim Tarutin
4.62 (13)
Haven Volume Profile은 거래량 분포를 기반으로 중요한 가격 수준을 식별하는 데 도움이 되는 다기능 볼륨 프로파일 분석 지표입니다. 시장을 더 잘 이해하고 중요한 진입 및 퇴장 지점을 식별하려는 전문 트레이더를 위해 설계되었습니다. 기타 제품 ->  여기 주요 기능: Point of Control (POC) 계산 - 최대 거래 활동 수준으로, 가장 유동성이 높은 수준을 식별하는 데 도움이 됩니다 Value Area 정의 (높은 활동 영역) 및 사용자 지정 가능한 거래량 비율로 거래 범위를 보다 정확하게 평가할 수 있습니다 틱 거래량과 실제 거래량 모두 지원, 다양한 시장 유형과 거래 전략에 적합 계산 기간(일 수)의 유연한 설정으로 모든 시간 프레임에 도구를 적용할 수 있습니다 터미널의 밝은 테마와 어두운 테마에 자동 적응하여 사용자 인터페이스의 시각적 경험을 향상시킵니다 레벨 시각화가 명확하고 스타일과 색상을 사용자 지정할 수 있어 빠른 의사 결정을 돕습니다 이 지표
FREE
Before installing the HeatMap indicator make sure you are using a broker that gives you access to the Depth of market (DOM) !! This indicator creates a heatmap on your chart allowing you to see the buy or sell limit orders easily and in real time. You have the possibility to change the setting and the colors of the HeatMap in order to adapt to all markets and all charts. Here is an example of a setting you can use with the NASDAQ100 on the AMPGlobal broker :  https://www.youtube.com/watch?v=x0Y
ICT Yoshi Pro
Le Quang Thanh
Market Structure, Liquidity and Price Action Analysis for MetaTrader 5 A chart can contain plenty of information and still leave a trader without a clear decision. A BOS label may appear, liquidity may be nearby, and an order block may remain active, yet the real challenge is understanding how those elements relate to one another. ICT Yoshi Pro organizes that process into a cleaner, more disciplined MetaTrader 5 workflow. What ICT Yoshi Pro Does ICT Yoshi Pro is a manual decision-support indicat
PivotWave
Jeffrey Quiatchon
Introducing PivotWave – your ultimate trading companion that redefines precision and market analysis. Designed with traders in mind, PivotWave is more than just an indicator; it’s a powerful tool that captures the pulse of the market, identifying key turning points and trends with pinpoint accuracy. PivotWave leverages advanced algorithms to provide clear visual signals for optimal entry and exit points, making it easier for traders to navigate volatile market conditions. Whether you are a begin
What if you could finally SEE where the market really wants to go? Most traders watch price. Pros watch VOLUME — where the money was actually traded. Volume Profile Fibo Confluence puts that reading right in front of you, in plain language, no jargon. WHAT YOU SEE ON YOUR CHART • The POC, the most-traded price: the market's natural magnet • The value area (VAH / VAL): the "house" where price spends its time • Automatic Fibonacci retracement + the golden pocket • Low-volume nodes
RSI Currency Strength Meter is a powerful and elegant multi-currency indicator that measures the real-time relative strength of the 8 major currencies using RSI logic. By calculating the smoothed performance of each currency across its major pairs and applying the RSI formula, it delivers clean and responsive strength lines that make it easy to spot which currencies are truly strong or weak at any moment. This indicator is particularly useful for visualizing currency correlations and divergence
Gioteen Volatility Index (GVI) - your ultimate solution to overcoming market unpredictability and maximizing trading opportunities. This revolutionary indicator helps you in lowering your losing trades due to choppy market movements. The GVI is designed to measure market volatility, providing you with valuable insights to identify the most favorable trading prospects. Its intuitive interface consists of a dynamic red line representing the volatility index, accompanied by blue line that indicate
Market Profile Heat indicator  — is a classic Market Profile implementation that can show the price density over time, outlining the most important price levels, value area, and control value of a given trading session. This indicator can be attached to timeframes between M1 and D1 and will show the Market Profile for daily, weekly, monthly, or even intraday sessions. Lower timeframes offer higher precision. Higher timeframes are recommended for better visibility. It is also possible to use a fr
Spike Blast Pro
Israr Hussain Shah
Here   our more valuable tools SMC Trend Trading   ,  Easy SMC Trading  ,  Institutional SMC Architect Volume Analysis Tools  ,  Volume flow Profile  ,  Market volume profile  , FVG with Volume  , Liquidity Heatmap Profile  ,  Volume Spread Analysis Spike Blaster Pro is a next-generation MT5 indicator designed specifically for synthetic markets. It works seamlessly on Boom Index and Weltrade Index , providing traders with sharp, reliable spike detection signals. What makes Spike Blaster Pro po
이 제품의 구매자들이 또한 구매함
ARIPoint
Temirlan Kdyrkhan
1 (4)
ARIPoint is a powerful trading companion designed to generate high-probability entry signals with dynamic TP/SL/DP levels based on volatility. Built-in performance tracking shows win/loss stats, PP1/PP2 hits, and success rates all updated live. Key Features: Buy/Sell signals with adaptive volatility bands Real-time TP/SL/DP levels based on ATR Built-in MA Filter with optional ATR/StdDev volatility Performance stats panel (Success, Profit/Loss, PP1/PP2) Alerts via popup, sound, push, or email Cu
Neuro Poseidon MT5
Daria Rezueva
4.75 (52)
Neuro Poseidon is a new indicator by Daria Rezueva. It combines precise trading signals with adaptive TP/SL levels - creating best possible trades as a result! Message me and get  Neuro Poseidon Assistant  as a gift to automize your trading process! What makes it stand out? 1. Proven profitability on all assets and timeframes 2. Only confirmed BUY and SELL signals present on the chart 3. Adaptive TP & SL levels generated by the software for each trade 4. Easy to understand - suitable for al
Volatility Master for MetaTrader is a real-time dashboard tool that scans up to  50 symbols  to identify high-volatility , trending markets instantly. With bullish/bearish signals, customizable alerts, and a user-friendly interface, it helps you avoid range-bound conditions and focus on high-probability trades. Clarity leads to confidence. Trade confidently and protect your capital effectively with this powerful dashboard. We don't offer free or bonus indicators in exchange of reviews from you.
IQ FX Gann Levels a precision trading indicator based on W.D. Gann’s square root methods . It plots real-time, non-repainting support and resistance levels to help traders confidently spot intraday and scalping opportunities with high accuracy. William Delbert Gann (W.D. Gann) was an exceptional market analyst, whose trading technique was based on a complex blend of mathematics, geometry, astrology, and ancient mathematics which proved to be extremely accurate. We don't offer free or bonus indic
UZFX {SSS} 스캘핑 스마트 시그널 v5.0 MT5는 급변하는 시장에서 정확한 실시간 시그널을 필요로 하는 스캘퍼, 데이 트레이더, 스윙 트레이더를 위해 설계된 리페인팅이 없는 고성능 트레이딩 지표입니다. (UZFX-LABS)에서 개발한 이 지표는 가격 움직임 분석, 추세 확인 및 스마트 필터링을 결합하여 모든 통화 쌍과 시간대에서 높은 확률의 매수 및 매도 신호, 경고 신호, 추세 지속 기회를 생성합니다. 거래에 대한 망설임을 멈추고, 명확성, 정밀성, 그리고 규율 있는 시장 실행을 원하는 트레이더를 위해 설계된 체계적인 신호 시스템을 따르기 시작하세요. 제 말을 믿으세요. 이 지표는 MQL5에서 구할 수 있는 최고의 지표 중 하나입니다. 그러니 절대 놓치지 마세요!! “현명한 트레이더를 위한 스마트 신호” 지금 최신 버전 5.0이 출시되었으며, 사전 공지 없이 가격이 최대 $499.99까지 인상될 수 있으니 기회를 놓치기 전에 서둘러 구매하세요!! 최종 구매 전! 무료 체
Mahra Pro Indicator MT5
Mahra Said Mohammed Al Kaabi
Mahra Pro Indicator MT5 Overview Mahra Pro is a MetaTrader 5 chart indicator designed to support structured analysis of XAUUSD (Gold). It combines trend, momentum, volatility and price-structure conditions to identify potential buy and sell setups and display them directly on the chart. The indicator does not open, modify or close trades. All trading decisions and order execution remain under the user's control. Main features • Buy and sell signal arrows on the chart. • Fast and slow EMA lines w
Gem SIGNAL
Shengzu Zhong
5 (1)
GEM Signal Pro GEM Signal Pro는 MetaTrader 5용 추세추종형 지표로, 차트에서 더 명확한 신호, 더 구조적인 트레이드 설정, 그리고 더 실용적인 리스크 관리를 원하는 트레이더를 위해 설계되었습니다. 단순한 화살표만 표시하는 것이 아니라, GEM Signal Pro는 전체 트레이드 아이디어를 더 깔끔하고 읽기 쉬운 방식으로 보여줍니다. 조건이 확인되면 진입가, 손절가, 목표가를 차트에 표시하여 트레이더가 설정을 더 효율적으로 검토할 수 있도록 도와줍니다. 작동 방식 이 지표는 먼저 내부 로직에 따라 유효한 초기 신호를 식별합니다. 확인 조건이 충족되면, GEM Signal Pro는 차트에 전체 설정을 표시합니다. 이를 통해 트레이더는 거래 구조를 더 명확하게 보고, 수동 분석 작업을 줄일 수 있습니다. 차트에 표시되는 거래 레벨 확인된 신호에 대해, GEM Signal Pro는 다음을 표시할 수 있습니다. 진입가 손절가 목표가 1 목표가 2 목표가 3 손
The Louis SMC & Liquidity Master is a complete, institutional-grade market structure and liquidity mapping system built for MetaTrader 5. Designed for serious Smart Money Concepts (SMC) traders, this tool dynamically tracks multi-timeframe trends, supply and demand zones, and critical liquidity sweeps without cluttering your chart. Whether you trade major Forex currency pairs or highly volatile synthetic indices like Boom and Crash, the indicator automatically adapts to price action, filtering
ARICoins
Temirlan Kdyrkhan
ARICoin is a powerful trading companion designed to generate high-probability entry signals with dynamic TP/SL/DP levels based on volatility. Built-in performance tracking shows win/loss stats, PP1/PP2 hits, and success rates all updated live. Key Features: Buy/Sell signals with adaptive volatility bands Real-time TP/SL/DP levels based on ATR Built-in MA Filter with optional ATR/StdDev volatility Performance stats panel (Success, Profit/Loss, PP1/PP2) Alerts via popup, sound, push, or email Cust
The Oracle Pro
Ottaviano De Cicco
5 (1)
The Oracle Pro: Synthetic Multi-Timeframe Bias Engine for MT5 ️ Summer Launch Offer — Get The Oracle Pro for USD 199 (early buyers). Price rises with traction; final price USD 399. The Oracle Pro is a premium multi-timeframe bias engine for MetaTrader 5, built for demanding and professional traders. It answers one question with discipline: what is the directional bias on each timeframe right now, how strong is it, and how much do the timeframes agree? Everything is computed on closed bars only
Ace Trend
Mikhail Sergeev
5 (3)
우리는 당신에게 트렌드 거래의 세계에서 게임의 규칙을 변경하는 혁신적인 지표를 제시한다. 이 표시기는 성능을 재고하고 거래 경험을 전례없는 높이로 높이도록 설계되었습니다. 우리의 표시기는 경쟁 업체와 차별화 된 고급 기능의 고유 한 조합을 자랑합니다. "실제 가격 요인"의 첨단 기술은 가장 어렵고 휘발성 시장 상황에서도 탁월한 안정성을 보장합니다. 불안정한 패턴,깨진 지표 및 의식적이고 통제 된 거래에 작별 인사를하십시오. 표시기는 단지 아름다운 그림이 아닙니다! 지표는 거래자의 편으로 확률을 이동시켜 이익을 얻어야 합니다. 표시 신호(완전 자동 모드)에 따라 거래 결과에 익숙해: https://www.mql5.com/ko/signals/2339244 표시기는 형성된 막대에 다시 그리지 않습니다. 막대가 형성된 경우 표시기 판독 값은 변경되지 않습니다. 이 표시기는 모든 시간대에 작동합니다. 표준은 시간대입니다. 귀하의 의견은 매우 중요합니다! 당신은 어떤 질문,제안이,또는 당신의


Azimuth Pro
Ottaviano De Cicco
5 (7)
Azimuth Pro V2: Synthetic Fractal Structure and Confirmed Entries for MT5 Overview Azimuth Pro is a multi-level swing structure indicator by Merkava Labs . Four nested swing layers, swing-anchored VWAP, ABC pattern detection, three-timeframe structural filtering, and closed-bar confirmed entries — one chart, one workflow from micro-swings to macro-cycles. This is not a blind signal product. It is a structure-first workflow for traders who care about location, context, and timing. ️ Summer Sale
RelicusRoad Pro MT5
Relicus LLC
4.96 (24)
RelicusRoad Pro: 퀀트 시장 운영 체제 70% 할인 평생 이용권 (한정 시간) - 2,000명 이상의 트레이더와 함께하세요 왜 대부분의 트레이더는 "완벽한" 지표를 가지고도 실패할까요? 진공 상태에서 단일 개념 만으로 거래하기 때문입니다. 문맥 없는 신호는 도박입니다. 지속적인 승리를 위해서는 컨플루언스(중첩) 가 필요합니다. RelicusRoad Pro는 단순한 화살표 지표가 아닙니다. 완전한 퀀트 시장 생태계 입니다. 독점적인 변동성 모델링을 사용하여 가격이 이동하는 "공정 가치 로드"를 매핑하고, 단순 노이즈와 실제 구조적 돌파를 구분합니다. 추측은 그만두세요. 기관급 로드 로직으로 거래를 시작하세요. 핵심 엔진: "Road" 알고리즘 시스템의 중심에는 시장 상황에 실시간으로 적응하는 동적 변동성 채널인 Road Algo 가 있습니다. 세이프 라인(평형) 과 가격이 수학적으로 반전될 가능성이 높은 확장 레벨 을 투영합니다. Simple Road: 일반적인 시장을 위
This indicator automatically detects internal & swing market structure, Fibonacci Retracement and Fibo Levels. Features Full internal & swing market structure labeling in real-time Fibonacci Retracement Fibonacci Levels After purchasing the indicator, the full source code is provided, and via indicator buffers it can be easily integrated into your Expert Advisors (EAs) for automated trading strategies.
JSL Orderflow Footprint turns every candle into a price ladder that shows how much volume traded on the bid and on the ask at each price level. It highlights diagonal imbalances, stacked imbalance zones, absorption at candle extremes, cumulative delta (CVD), delta divergence and the daily session volume profile, then combines five of these order-flow conditions into a 0–100 confluence score. A signal is only issued on bar close when the score is high, clearly one-sided and confirmed by the candl
First time on MetaTrader, introducing IQ Star Lines. An original Vedic Astrology based indicator. "Millionaires don't use astrology, billionaires do". - J.P. Morgan, Legendary American financier and banker. We don't offer free or bonus indicators in exchange of reviews from you. You won't need any free products with this indicator to make it work. ;) Enjoy! Welcome to the new and updated  IQ Star Lines , the ultimate fusion of ancient planetary cycles and modern quantitative trading, published f
Gold Xausd Hunter
Metin Erkamoglu
5 (2)
MATADOR GOLD XAUUSD M5 Scalp Signals for MT5 MATADOR GOLD is a decision-support indicator for MetaTrader 5, designed for traders who analyze short-term Gold movement on the M5 timeframe. The indicator does not open, close, or manage trades automatically. It provides buy and sell signal guidance so the user can make their own trading decisions according to their risk plan, broker conditions, and trade management rules. Main purpose MATADOR GOLD is built to help traders avoid noisy signal flow and
ORB Seeker MT5
Marcela Goncalves De Oliveira
한정 수량 판매 및 제품 희소성 유지를 위한 특별 가격입니다! 단돈 599달러! 구매 후 저에게 연락 주시면 보너스 ORB Seeker EA와 개인 최적화 설정 파일을 보내드립니다. 깔끔한 세션 브레이크아웃을 자신감 있게 활용하세요! ORB Seeker MT5는 정확성, 단순성, 유연성 및 명확한 차트 구조를 원하는 트레이더를 위해 개발된 전문적인 시가 범위 돌파(ORB) 지표입니다. 이 프로그램은 모든 금융 상품에 대해 장전 거래 또는 사용자 지정 세션 범위를 자동으로 표시하고, 진입, 손절매, 목표 수익 및 선택적으로 50% 부분 목표 수익 수준을 포함한 명확한 돌파 신호를 제공합니다. 모든 계산은 실시간으로 차트에 직접 표시됩니다. 런던 개장, 뉴욕 세션, 아시아 세션 또는 사용자 지정 시장 시간대를 선택하여 거래하세요. ORB Seeker MT5는 사용자가 선택한 세션 시간에 맞춰 작동하므로 시장 범위, 돌파 레벨 및 거래 레벨을 정확하게 확인할 수 있습니다. 모든 구매
Footprint is an indicator for order flow and volume analysis. It helps identify market structure at the cluster level, find key zones with increased activity, and work with filters directly on the chart without constantly opening the settings window. Footprint Indicator Features cluster-based Bid x Ask and Delta charts; on-chart control panel; sliders for filter adjustments; Absorption; Initiative; Stacked Imbalances; Big Trades; dPOC / Dynamic Point of Control; Delta; side market profile; cumul
Presenting one-of-a-kind Gann Indicator for XAUUSD IQ Gold Gann Levels is a non-repainting, precision tool designed exclusively for XAUUSD intraday trading. It uses W.D. Gann’s square root method to plot real-time support and resistance levels, helping traders spot high-probability entries with confidence and clarity. William Delbert Gann (W.D. Gann) was an exceptional market analyst whose trading technique was based on a complex blend of mathematics, geometry, astrology, and ancient calculation
한 문장으로 이해하면 이 인디케이터는 RSI와 MACD, 두 전문가를 하나로 묶은 것 입니다. 두 지표를 따로 보며 판단할 필요 없이, 둘 다 동의할 때만 "매수" 또는 "매도" 화살표를 보여줍니다. 화살표는 다시 그려지지 않습니다 . 한 번 나타나면 그 자리에 고정됩니다. "콤보"의 의미 보통 트레이더는 RSI(가격 움직임의 힘)와 MACD(추세 방향)를 따로 봅니다. 그런데 둘의 신호가 충돌할 때가 많죠. 이 인디케이터는 두 지표가 동시에 같은 방향을 가리킬 때만 신호를 냅니다 . 덕분에 가짜 신호가 훨씬 줄어듭니다. 화면에서 보이는 것 가격 차트와 분리된 인디케이터 창 파란색과 빨간색 화살표 – 바로 쓸 수 있는 매매 신호 확대된 MACD 히스토그램 (모멘텀을 쉽게 파악하도록 더 크고 선명하게 표시) RSI와 MACD 선도 함께 표시되지만, 주목할 것은 화살표 이런 분께 적합합니다 초보자 – 두 지표를 따로 해석하고 모순을 처리할 필요 없음 경험자 – 빠른 신호 필터링, 다시
Harmonic Pattern Scanner — Gartley, Bat, Butterfly, Crab (Auto XABCD Detection) Stop manually plotting Fibonacci retracements on every swing. This indicator scans your chart in real time, identifies X-A-B-C-D structures, and tells you exactly which harmonic pattern is forming — Gartley, Bat, Butterfly, or Crab — with entry, stop loss, and four take-profit targets calculated automatically. What it does Detects confirmed harmonic patterns the moment a D-point swing closes, and previews forming pat
Transaction Speed MT5
Ivan Stefanov
5 (4)
이 지표는 시장에서 관심이 나타나는 영역 을 강조 표시한 후, 주문이 누적되는 영역 을 보여줍니다. 이는 **대규모 오더북(호가창)**처럼 작동합니다. 이것은 거대한 자금 을 위한 인디케이터입니다. 성능은 탁월하며, 시장에서 어떤 관심이 있든 반드시 포착할 수 있습니다 . (이것은 완전히 새로 작성되고 자동화된 버전 입니다 – 이제 수동 분석은 필요하지 않습니다.) **거래 속도(Transaction Speed)**는 새로운 개념의 인디케이터로, 시장에 대규모 주문이 언제, 어디에 쌓이는지를 보여주며 , 그 이점을 분석합니다. 매우 초기 단계에서 트렌드 전환 을 감지할 수 있습니다. FX 시장에서 흔히 사용하는 "거래량(volume)"은 오해입니다. 실제로는 시간당 가격 변화량 이므로, 올바른 용어는 거래 속도 입니다. 우리가 어떻게 사고하고, 행동하며, 분석하느냐 가 가장 중요합니다. 분석 패러다임의 전환 은 필수적입니다. 이 인디케이터는 외환 시장에서의 볼륨 개념을 논리적으로
Meravith Scanner
Ivan Stefanov
5 (3)
MERAVITH SCANNER는 MetaTrader 5용 전문 금융 시장 지표로, 여러 분석 도구를 하나의 통합 시스템으로 결합합니다. 독점적인 거래량 가중 평균 가격(VWAP) 방법론을 사용하여 모든 계산을 자동으로 수행하며, 주관적인 해석을 완전히 배제합니다. 이 지표는 모든 자산 클래스(Forex, 주식, 지수, 상품, 암호화폐)와 M1부터 월간 차트까지 모든 시간 프레임에서 작동합니다. 기본 원리는 “가격은 거래량을 따른다”입니다. MERAVITH는 기관 거래량이 집중되는 위치를 식별하고, 그 집중에서 수학적으로 정확한 가격 수준을 도출합니다. 예측이나 투기를 하지 않으며, 계산만 수행합니다. MERAVITH SCANNER를 사용하면 28개의 주요 Forex 통화쌍을 모든 시간 프레임에서 단 2~3분 만에 스캔할 수 있습니다. 또한 원하는 시장을 스캔할 수도 있으며, 예를 들어 약 100개의 주식을 약 10분 안에 스캔할 수 있습니다. 지표는 소진 레벨, 균형선, 편차, 통계
TrendMaestro5
Stefano Frisetti
note: this indicator is for METATRADER4, if you want the version for METATRADER5 this is the link:  https://www.mql5.com/it/market/product/108106 TRENDMAESTRO ver 2.5 TRENDMAESTRO recognizes a new TREND from the start, he never makes mistakes. The certainty of identifying a new TREND is priceless. DESCRIPTION TRENDMAESTRO identifies a new TREND in the bud, this indicator examines the volatility, volumes and momentum to identify the moment in which there is an explosion of one or more of these da
Quant Direction MT5
Georgios Kalomoiropoulos
Quant Direction 은 3D 시장 분석 도구입니다. 다양한 매개변수에 걸쳐 정확한 백분율 편차를 계산하면서 완벽하게 객관적인 알고리즘 기반 시장 분석을 제공합니다. 첨단 AI 기반 모델링 도구와 엄격한 테스트를 거쳐 개발된 이 알고리즘은 타의 추종을 불허하는 정확도로 시장을 분석합니다. 플랫폼에서 모든 통화쌍 또는 금융 상품을 분석할 수 있습니다. 단기 거래, 데이 트레이딩, 스윙 트레이딩 등 어떤 유형의 거래를 하든 Quant Direction은 최적의 선택입니다. 운영자가 되는 것의 진정한 이점 퀀트 디렉션의 진정한 장점은 감정, 눈의 피로, 과도한 분석을 완전히 배제한다는 점입니다. 더 이상 수십 개의 차트를 일일이 살펴보며 방향을 찾거나 자신의 판단에 끊임없이 의문을 품을 필요가 없습니다. 이 시스템은 8개의 시간 간격(5개월에서 수개월까지)을 밀리초 단위로 처리합니다. 특정 시점의 주요 시장 참여자를 정확하게 식별하여 항상 성공 확률이 가장 높은 방향으로 거래할
시장이 진짜로 무엇을 하고 있는지 보십시오.   세 가지 시장 국면(수축, 확장, 추세)을 눈앞에서 실시간으로 지켜보고, 추세 국면의 초기 단계에서 더 나은 진입을 잡으십시오.   추측을 멈추십시오. 기관과 스마트 머니가 하는 것처럼 시장을 읽기 시작하십시오.   MT5용 Apex Market Structure Pro는 노이즈를 걷어내고 모든 캔들 아래에 있는 진짜 구조를 보여 주는 정밀 스마트 머니 분석 도구입니다.   유동성, 구조 전환, 매집 구간, 추세 편향을 하나의 깔끔하고 전문적인 오버레이에 담았습니다. 후행 지표에 지쳐 명확함으로 매매할   준비가 된 진지한 트레이더를 위해 만들어졌습니다.      중요: 이 지표는 Heikin Ashi(하이킨 아시) 캔들에서 작동하도록 설계되었습니다. 사용 전 차트를 Heikin Ashi로 설정하여 그 잠재력을   온전히 끌어내십시오. 모든 분석은 Heikin Ashi 가격 흐름을 중심으로 설계되었습니다. Apex Market S
Title:FX-AIEA Supply and Demand Zone Indicator (MT5) — Technical Overview Version: 2.51 | Platform: MetaTrader 5 Introduction Supply and demand zones are considered a core manifestation of institutional order flow, providing a more direct reflection of buying and selling pressure than traditional support/resistance levels. This indicator attempts to automate the identification of high-probability supply and demand zones using an adaptive ZigZag algorithm, reducing the subjectivity and time asso
KT Alpha Hunter Arrows MT5
KEENBASE SOFTWARE SOLUTIONS
대부분의 화살표 인디케이터는 신호만 보여주고, 나머지 판단은 모두 트레이더에게 맡깁니다. KT Alpha Hunter Arrows는 완성된 트레이딩 플랜을 제공합니다. 각 신호 화살표가 표시될 때마다 진입선, 손절선, 네 개의 익절 목표, 그리고 현재 심볼과 시간대가 지금 거래할 가치가 있는지 알려주는 실시간 엣지 판정이 함께 그려집니다. 포함된 Trade Manager EA는 사용자가 직접 진입한 뒤의 실행 관리를 맡아, 시장이 흔들리고 감정이 개입되기 쉬운 상황에서도 거래 원칙을 유지할 수 있도록 도와줍니다. 리페인트 없음. 종가 확정 후 신호만 표시. Forex, Gold, Indices 및 사용자가 거래하는 다양한 MT5 지원 상품에 맞게 설계되었습니다. 주요 기능 캔들이 마감된 후에만 표시되는 리페인트 없는 매수 및 매도 화살표. 각 신호마다 진입선, 구조적 손절선, 네 개의 익절 목표 표시. 현재 차트에서 매수와 매도 셋업을 별도로 평가하는 Edge Dashboard.
MasterTrend
Temirlan Kdyrkhan
MasterTrend Indicator for MT5 A powerful trend-following and signal-evaluation tool MasterTrend   is a custom MT5 indicator that combines Moving Averages and ATR-based risk/reward logic to generate clear buy/sell signals. It visualizes dynamic SL/TP levels, evaluates past trade outcomes, and displays win/loss statistics in a clean on-chart panel. Key features include: Buy/Sell signals based on MA crossovers ATR-based SL/TP1/TP2/TP3 levels with visual lines and labels Signal outcome tracking wit
제작자의 제품 더 보기
KURAMA GOLD SIGNAL PRO (MT4) — 7중 필터 · 자동 TP/SL · 품질 점수 · 시그널 기록 저장 | XAUUSD 완전 트레이딩 시스템 실시간 리페인트 없음. 시그널이 나타나는 순간 화살표, 진입, TP, SL이 그 자리에 고정되어 이후 절대 움직이지 않습니다. 여러분이 거래하는 것은 바로 이 실시간 시그널입니다. 그리고 v7.20에서는 실제로 발신된 모든 시그널이 자동 저장되어 재시작 후에도 정확히 복원됩니다. 구매자 전용 보너스 평생 라이선스를 구매하시면 AI Zone Radar($59 상당) + 완전 PDF 매뉴얼을 무료로 드립니다. 제품 가격에 더해 $59 상당의 보너스가 따라옵니다. 구매 후 MQL5로 메시지를 보내주세요. AI Zone Radar: https://www.mql5.com/en/market/product/175834 골드 트레이더 커뮤니티에서 실제로 사용되며 정확성과
Gold Signal Swing Pro XAUUSD with Auto TP SL (MT4) — XAUUSD 스윙 트레이딩을 위한 7층 필터 + RR 보증 시스템 리페인트 없음. 리드로 없음. 지연 없음. 모든 신호는 확정 후 고정됩니다. 구매자 보너스: 매수 라이선스 구매 시 AI Zone Radar ($59 상당) + PDF 매뉴얼 무료 제공. 구매 후 MQL5에서 메시지를 보내주세요. AI Zone Radar: https://www.mql5.com/en/market/product/175834 MT5 버전도 판매 중: https://www.mql5.com/en/market/product/170916?source=Site +Profile+Seller 활발한 트레이딩 커뮤니티의 골드 트레이더들이 사용하고 신뢰합니다. 정밀성과 사용 편의성을 위해 구축되었습니다. 이런 분에게 추천 업무나 일상으로 바빠 M5/M15 차트를 볼 수 없는 트레이더 엄선된 고품질 신호만으로 거래하고 싶은 분 야
Gold Signal Swing Pro XAUUSD with Auto TP SL — XAUUSD 스윙 트레이딩을 위한 7층 필터 + RR 보증 시스템 리페인트 없음. 리드로 없음. 지연 없음. 모든 신호는 확정 후 고정됩니다. 구매자 보너스: 매수 라이선스 구매 시 AI Zone Radar ($59 상당) + PDF 매뉴얼 무료 제공. 구매 후 MQL5에서 메시지를 보내주세요. AI Zone Radar: https://www.mql5.com/en/market/product/175834 MT4 버전도 판매 중: https://www.mql5.com/ja/market/product/177778?source=Site +Market+Product+Page 활발한 트레이딩 커뮤니티의 골드 트레이더들이 사용하고 신뢰합니다. 정밀성과 사용 편의성을 위해 구축되었습니다. 이런 분에게 추천 업무나 일상으로 바빠 M5/M15 차트를 볼 수 없는 트레이더 엄선된 고품질 신호만으로 거래하고 싶은 분 야간
AI Zone Radar — 5층 점수 시스템을 탑재한 지능형 지지·저항 감지 수동으로 선을 긋는 것을 멈추세요. AI Zone Radar는 실제로 중요한 지지·저항 존을 자동으로 감지하고, 독자적인 5층 알고리즘을 사용하여 각 존을 1에서 5까지 점수화합니다. "가격이 어디서 반전할까?" — AI Zone Radar는 추측이 아닌 숫자로 이 질문에 답합니다. 이것이 다른 이유 대부분의 지지·저항 인디케이터는 모든 스윙 고가와 저가에 선을 긋습니다. 수십 개의 선을 얻지만 어떤 것이 중요한지 알 방법이 없습니다. AI Zone Radar는 ATR 적응 감지와 5층 점수 시스템을 사용하여 현재 시장이 적극적으로 존중하는 존만 표시합니다. 5층 점수 시스템 1층 — 몸통/꼬리 분석: 캔들 몸통이 있는 가격 반응은 1.5배 점수. 꼬리만 터치는 0.5배 점수. 몸통 반응은 진정한 헌신을 나타냅니다. 2층 — 지수적 시간 감쇠: 최근 터치는 더 높은 점수. 30일이 넘
Nasdaq Signal Pro with Auto TP SL — MT4 진입, 익절 목표, 손절 기준을 하나의 나스닥 차트에서 확인하세요. Nasdaq Signal Pro는 MT4에서 나스닥100 현금지수 CFD의 재량 매매를 돕는 지표입니다. M5와 M15 차트에 BUY/SELL 후보 신호, 참고 진입가, 익절 목표(TP), 손절 기준(SL)을 표시합니다. 파란 패널에 신호, 시장 상태, 참고 가격을 모아 주문 전 확인할 정보를 정리합니다. 이 페이지는 MT4 버전입니다. MT5 버전은 별도 상품입니다. 지표가 자동으로 주문하거나 청산하거나 주문을 수정하지 않습니다. MT5 버전 보기 영구 라이선스 구매자 전용 증정 혜택 영구 라이선스 구매자에게 AI Zone Radar(MT5 버전)를 무료로 제공합니다. 별도의 지표로, 지지·저항 구간과 참고 강도 점수를 표시하여 주변 가격 구간을 살펴볼 수 있습니다. 구매 후 MQL5 메시지로 작성자에게 “AI Zone Radar bonus”
Nasdaq Signal Pro with Auto TP SL — MT5 진입, 익절 목표, 손절 기준을 하나의 나스닥 차트에서 확인하세요. Nasdaq Signal Pro는 MT5에서 나스닥100 현금지수 CFD의 재량 매매를 돕는 지표입니다. M5와 M15 차트에 BUY/SELL 후보 신호, 참고 진입가, 익절 목표(TP), 손절 기준(SL)을 표시합니다. 파란 패널에 신호, 시장 상태, 참고 가격을 모아 주문 전 확인할 정보를 정리합니다. 이 페이지는 MT5 버전입니다. MT4 버전은 별도 상품입니다. 지표가 자동으로 주문하거나 청산하거나 주문을 수정하지 않습니다. MT4 버전 보기 영구 라이선스 구매자 전용 증정 혜택 영구 라이선스 구매자에게 AI Zone Radar(MT5 버전)를 무료로 제공합니다. 별도의 지표로, 지지·저항 구간과 참고 강도 점수를 표시하여 주변 가격 구간을 살펴볼 수 있습니다. 구매 후 MQL5 메시지로 작성자에게 “AI Zone Radar bonus”
필터:
Yik Hung Lai
1381
Yik Hung Lai 2026.07.04 02:18 
 

i bought Gold Signal Pro with Auto TP SL and Gold Signal Swing Pro XAUUSD with Auto TP SL,very easy to use

Genki Andou
856
개발자의 답변 Genki Andou 2026.07.05 08:54
Thank you so much for the review, and for choosing both the scalping and swing versions! I'm really glad you find them easy to use — that's exactly what I aim for. If you ever have questions as you trade, feel free to reach out anytime. Happy trading!
Violette
665
Violette 2026.06.10 14:04 
 

I did buy a LOT of indicators of the market and they all went to the trash. This one is different because it's the first one which gives me good profit, i'm very satisfied of this indicator and the seller is very friendly. I for example had losses in my account because of an EA (which did go to the trash also) and within 1 week i did recover all thanks to this indicator, so thank you very much ! I must also say that even if the history repaints after refresh, it's absolutely not a problem as i'm continuesly doing profits since 2 weeks. I recommand.

Genki Andou
856
개발자의 답변 Genki Andou 2026.06.10 22:53
Thank you so much for this wonderful review, Violette! I'm truly happy to hear you recovered your losses within a week and have been consistently profitable for two weeks now. That's exactly the kind of result I built this tool for. And I really appreciate you pointing out that the recalculation on refresh is not a problem in real trading — as an active, profitable user, your perspective means a lot. Keep up the disciplined trading, and feel free to reach out anytime if you have questions. Wishing you continued success!
404 strategy not found
593
404 strategy not found 2026.06.02 13:57 
 

I want to open with the concerns, as these are the most material considerations for any prospective buyer.

The most significant issue is that the indicator panel does not display in backtests. This is a meaningful limitation, because it prevents buyers from assessing the true hit-rate prior to purchase. When the indicator is first applied to the chart, a number of past losing trades are removed and excluded from the count, which inflates the displayed performance. Only a forward test conducted after purchase reveals the actual results. In my case, the win-rate settled closer to 55–60%, materially below the 80%+ the panel initially suggests. This is a poor practice and, at minimum, creates a misleading impression of performance.

A second concern is that the variable settings in the input tab are non-functional. Adjusting them produces no change in the signals. The developer has explained that the logic is entirely internal, which raises the question of why the input tab presents these parameters as adjustable when they are, in fact, fixed. There is also an inconsistency whereby removing and reapplying the indicator causes some entries to disappear; if left running without reloading, the signals remain stable. Collectively, these issues call into question how mature and transparent the strategy actually is, and prospective users should be prepared to apply additional indicators to filter the signals.

To be clear, I do not consider this a scam, and I have no direct evidence of bad faith on the part of the author. That said, the combination of inflated backtest figures, non-functional inputs, and a performance panel that flatters early results does give the product the appearance of one, and buyers should evaluate it on that basis rather than on the initial numbers.

On the positive side, the strategy does have merit. The chart displays TP and SL levels, which makes execution straightforward. The developer was responsive and provided support promptly when required. As with any strategy, results depend on discipline, practice, and adherence to the manual. I will update this review if the situation changes.

Genki Andou
856
개발자의 답변 Genki Andou 2026.06.02 21:30
Thank you for the fair and thoughtful review, Gerard. You've understood the indicator perfectly: signals never disappear during live trading — only on a full reload (remove/re-add, timeframe switch, restart). I'd like to explain why this is a deliberate design choice rather than a bug. The indicator fires signals in real-time, the moment price touches an MA during bar formation — not waiting for the candle to close. This is what lets you enter early, before price runs toward TP. The tradeoff is that real-time signals cannot perfectly match a recalculation, which only sees completed bar data after the fact. To make historical signals 100% fixed, I would have to delay every signal until the candle closes — meaning entries come 5 minutes late on M5, often after price has already moved. I made this choice deliberately: I wanted to build an indicator that actually helps users win in live trading, not one that simply looks perfect in hindsight. Real-time entries are what make money. As you said — let it run, and no signals disappear. Thank you for trading with discipline and for the kind words about support. Wishing you continued success!
khkh14
273
khkh14 2026.06.02 03:06 
 

**Repaints despite being advertised as "No Repaint."** Purchased based on the explicit claim: "No repaint. No redraw. Every signal stays fixed once confirmed." After testing, I found that historical arrows changed after a simple chart reload (changing timeframe and changing back). The seller later confirmed that historical signals can change after recalculation. This directly contradicts the product description. A signal that changes after recalculation is not "fixed once confirmed." The actual behavior was not clearly disclosed and was a key factor in my purchase decision. Had the true behavior been disclosed before purchase, I would not have bought this indicator.

*** BELOW IS THE REPLY to AUTHOR'S COMMENT***

Your explanation confirms that historical signals are recalculated and can change after a reload.

That is precisely the problem.

In my testing, the recalculated chart appeared to contain fewer losing signals and a higher-quality signal history than what was originally displayed. This creates the impression of a much better-performing indicator than what traders actually experienced in real time.

If historical signals are modified after the fact, then any win rate, signal history, or performance statistics derived from those signals become unreliable because they are based on hindsight-adjusted results.

Calling this "recalculation" instead of "repainting" does not change the underlying fact that historical signals are not fixed and can change after the event.

A signal that can disappear or change after it has been plotted is not "fixed once confirmed."

Genki Andou
856
개발자의 답변 Genki Andou 2026.06.02 03:49
Thank you for your feedback. To be clear for anyone reading this: the indicator does NOT repaint during live trading. Once a signal appears on the current bar, it stays fixed. This is verified by all active users, including one who achieved a 96.49% win rate over 57 trades in 9 days of live trading. What the reviewer describes is recalculation behavior that occurs when the indicator is reloaded from scratch (chart refresh, timeframe switch, MT restart). This resets internal cooldown counters and can produce slightly different signals on historical bars. This is standard behavior for any indicator that uses internal state tracking, across any platform. This has zero impact on live trading. You trade the signal when it appears in real-time. No entry, TP, SL, or result is affected. I have updated the product description to make this distinction even clearer. The "no repaint" claim applies to real-time signals, which is the industry-standard definition used across MQL5 Market.
jcasas311948 Casas
216
jcasas311948 Casas 2026.04.17 11:31 
 

El 18 de Abril del 2.026, alquile por un mes el indicador Gold Signal Pro with Auto TP SL y desde el primer momento, las señales fueron perfectas y el resultado de las primeras dos semanas fue espectacular: -Total de señales en el mercado de Londres y Nueva York = 110 -Total de señales en las que he entrado =57 - Operaciones positivas 55 (96,49%) - Resultados de los 9 días operados= 8.923$ RESULTADOS REALES 20/30- Abril 2.026 Total 9 dias Op. Total Señales Dia /Semana -177 100% Señales en M. Asiatico -67 38% S. en M. Londres + N.Y. -110 62% Señales de Venta -86 48,59% Señales de Compra -57 32,20% Solo mercado de London + NY Señales Buenas -77 70,00% Señales Malas -33 30,00% NO entrado -53 48,18% Entrado L/NY -57 51,82% Beneficio $ 9.313,85 Operaciones positivas -55 96,49% Perdida -$ 390,51 Operaciones Negativas -2 3,51% Resultado total SEMANA -$ 8.923,34 En la segunda semana pude constatar que el indicador tenia una serie de pequeñas incidencias en MT5 y se las manifesté al desarrollador, el cual en la actualización de hoy 7,13, parece que están todas superadas y mejorado el rendimiento en MT5. Por todo ello recomiendo este indicador Gold Signal Pro with Auto TP SL y yo confirmo que cuando venza el mes de alquiler , lo compraré definitivamente. Un saludo..... Atentamente: Jose Casas

Hoy domingo 17 de Mayo de 2026, confirmo que he adquirido la licencia de compra completa, espero recibir AI Zone Radar + manual PD.

Un saludo....... Atentamente: Jose Casas

Recibido.... Gracias.

Genki Andou
856
개발자의 답변 Genki Andou 2026.06.14 06:56
¡Hola Jose! Muchísimas gracias por adquirir la licencia completa y por esta reseña tan detallada y generosa. Significa mucho para mí. Tus resultados son extraordinarios, y sobre todo admiro tu disciplina: operar solo en Londres y Nueva York, filtrar las señales débiles y entrar con criterio. Ese es exactamente el uso que hace que el indicador brille. También te agradezco mucho tu feedback sobre MT5 — gracias a tus observaciones pude lanzar la actualización 7.13 con el rendimiento mejorado. Me ayudaste a mejorar el producto para todos. Me alegra que ya hayas recibido AI Zone Radar y el manual. Si tienes cualquier duda sobre cómo combinarlo con el indicador, no dudes en escribirme. ¡Gracias por tu confianza, Jose! Un fuerte saludo.
리뷰 답변














