IndexViz Pro MT5

> Institutional Grade Multi-Index Adaptive Indicator

IndexViz Pro MT5 is a professional-grade, multi-index adaptive indicator designed for traders who demand institutional-level analysis across multiple markets simultaneously. Built for MetaTrader 5, IVP combines over 20 analytical modules into a single, unified visual dashboard that monitors stock indices, synthetic indices, commodities, forex pairs, and cryptocurrencies in real time.

Unlike conventional indicators that analyze a single instrument in isolation, IndexViz Pro scans your entire watchlist simultaneously, calculates a composite bias score for each symbol, and presents the results in a clean, color-coded dashboard directly on your chart. Every signal is filtered through multiple layers of confirmation before being displayed, ensuring that only high-quality setups reach your attention.

WHO IS THIS INDICATOR FOR

IndexViz Pro is designed for:

  • Traders who operate across multiple indices such as US30, US100, US500, DAX, FTSE, JP225, and others
  • Traders of synthetic indices including Volatility, Boom, Crash, Step, and Jump indices
  • Commodity traders monitoring Gold, Silver, Oil, and related instruments
  • Forex traders who want multi-symbol bias analysis at a glance
  • Crypto traders monitoring BTC, ETH, and major pairs
  • Any trader who values structured, data-driven decision making over intuition alone

CORE SIGNAL ENGINE

The signal engine calculates a composite bias score from 0 to 100 for each symbol, combining five weighted analytical components:

Trend Analysis (default weight 25%): Evaluates moving average alignment using a dynamic pool of EMA periods (10, 14, 20, 26, 34 for fast and 30, 40, 50, 65, 89 for slow), FrAMA confirmation, and price position relative to key moving averages. The active period is automatically selected based on current volatility conditions.

Momentum Analysis (default weight 25%): Uses RSI with an adaptive period pool (7, 9, 12, 14, 21), Stochastic crossovers, and overbought/oversold detection. RSI thresholds automatically widen during high-volatility periods to reduce false signals.

Volatility Analysis (default weight 20%): Analyzes Bollinger Band position, band width expansion, and ATR-based price movement to determine whether price is at extremes or in consolidation.

Volume Analysis (default weight 20%): Incorporates Money Flow Index (MFI), On-Balance Volume (OBV) divergence, and tick volume analysis to confirm directional bias with volume participation.

Divergence Analysis (default weight 10%): Detects RSI divergence, MACD histogram divergence, and OBV divergence simultaneously, identifying regular and hidden divergences across multiple lookback periods.

All five weights are fully customizable and can be auto-adapted based on historical performance of each component per symbol.

ADVANCED ANALYTICAL MODULES

Market Structure Shift (MSS): Detects Break of Structure (BOS) and Change of Character (CHoCH) events by identifying swing highs and lows over a configurable lookback period. Requires close confirmation to reduce false breaks. When a structure shift is detected, the trend score is boosted and the market regime is updated accordingly.

Fair Value Gaps (FVG): Identifies bullish and bearish fair value gaps in real time. Tracks mitigation percentage as price fills the gap. Vanish mode automatically removes filled gaps from the analysis. FVG alignment with impulse direction generates a conviction bonus.

Liquidity Sweeps: Detects bullish and bearish liquidity sweeps by identifying wicks that pierce prior session highs or lows and close back inside. Session-aware mode focuses sweeps on the relevant trading session for each instrument. Generates a conviction bonus when confirmed.

Impulse Tracking with Efficiency Ratio: Measures directional efficiency using the Kaufman Efficiency Ratio. When price moves with high efficiency (trending strongly in one direction), an impulse bonus is applied to the bias score. Adaptive ER mode adjusts the threshold dynamically based on current volatility.

Quad Stochastic System: Runs four independent Stochastic oscillators with different periods simultaneously. When all four align in oversold or overbought territory, a Super Signal is generated with maximum bonus. Partial alignment generates proportional bonuses. Includes candlestick pattern detection (engulfing, hammer, shooting star), flag pattern detection, and ABCD harmonic pattern detection.

SMT Divergence (Smart Money Technique): Compares correlated instrument pairs (US30/US500, EURUSD/GBPUSD, XAUUSD/XAGUSD, V75/V100) to detect divergences between correlated assets. When one instrument makes a new high or low while its correlated pair fails to confirm, an SMT divergence signal is generated with a conviction bonus.

Rejection Blocks: Identifies candles with significant upper or lower wicks relative to the total range, indicating institutional rejection. Bonus is amplified when the rejection occurs near the 200-period moving average.

Relative Volume (RVOL): Calculates current volume relative to the historical average for the same hour of day across the past 10 days. High RVOL confirms signal conviction and triggers additional bonuses. Extreme RVOL combined with liquidity sweeps or FVG generates EXTREME conviction level.

Volatility Regime Classification: Classifies current market conditions into four regimes: Low Trend, High Trend, Low Range, and High Range. Each regime applies a position size factor to suggested lot calculations and adjusts SL/TP multipliers accordingly.

Multi-Timeframe Alignment: Checks price alignment across M15, H1, H4, and D1 timeframes simultaneously. Visual blocks in the dashboard show alignment status for each timeframe. MTF misalignment reduces the bias score by 40%.

Index Correlation: Monitors correlated instruments within the same sector group (US Indices, EU Indices, Asia Indices, Metals, Forex Major). When the majority of instruments in a group align in the same direction, a correlation bonus is applied. Sector capitulation detection identifies when 75% or more of a group signals in the same direction.

RISK MANAGEMENT TOOLS

Suggested Stop Loss and Take Profit: Automatically calculates SL and TP levels based on ATR multipliers, timeframe scaling, and current volatility regime. Values are displayed in the dashboard and included in all alerts.

Suggested Lot Size: Calculates the recommended position size based on account balance, risk percentage, and SL distance. Adjusts automatically for the current volatility regime position size factor.

Daily Drawdown Monitor: Tracks daily equity drawdown in real time. When the configured maximum daily drawdown percentage is reached, all signals are blocked and the dashboard displays a prominent warning. Resets automatically at the start of each trading day.

Break-Even Suggestion: Monitors open positions and suggests moving the stop loss to break-even when price has moved at least one ATR in the signal direction.
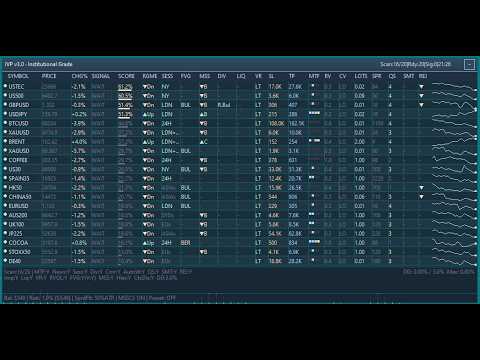
VISUAL DASHBOARD

The dashboard is a fully interactive, canvas-based panel rendered directly on the chart. It supports:

  • Drag and drop repositioning anywhere on the chart
  • Minimize and maximize with a single click
  • Automatic dark and light theme detection based on chart background color
  • DPI-aware scaling for high-resolution displays (supports up to 3x scaling)
  • Pagination for large symbol lists (configurable page size)
  • Sortable columns: by symbol name, score descending, score ascending, or instrument type
  • Score-based filtering to show only symbols above a minimum bias score
  • Sparkline price history for each symbol
  • Color-coded signal rows: green background for buy signals, red for sell signals
  • Impulse highlighting for active impulse conditions
  • News blocking indicator per symbol
  • Spread blocking indicator per symbol
  • Session status per symbol
  • Daily change percentage per symbol
  • Current price per symbol
  • Suggested SL and TP in points or pips
  • Conviction level (Low, Medium, High, Extreme) per symbol
  • Relative volume value per symbol
  • FVG, MSS, Divergence, Liquidity Sweep, Volatility Regime, SMT, and Rejection status per symbol
  • MTF alignment visual blocks (4 timeframes per symbol)
  • Sync progress bar for symbols still loading historical data
  • Sector capitulation flash alert in the dashboard header

SUPPORTED INSTRUMENTS

IndexViz Pro automatically detects and configures the following instrument types:

Stock Indices: US30, US100, US500, DAX/DE40, FTSE/UK100, JP225, FR40/CAC40, AU200, HK50, ES35/IBEX35, EU50/STOXX50, CN50, INDIA50, and all common broker variants.

Synthetic Indices: Volatility 10, 25, 50, 75, 100 (standard and 1-second), Boom 300/500/1000, Crash 300/500/1000, Step Index, Range Break 100/200, Jump 10/25/50/75/100.

Commodities: XAUUSD (Gold), XAGUSD (Silver), USOIL, UKOIL/Brent, XPTUSD, XPDUSD, Natural Gas, Copper.

Forex: EURUSD, GBPUSD, USDJPY, AUDUSD, USDCAD, NZDUSD, USDCHF, and major crosses.

Cryptocurrencies: BTCUSD, ETHUSD, LTCUSD, XRPUSD, BNBUSD, SOLUSD, ADAUSD, DOTUSD.

Each instrument type receives a dedicated parameter configuration optimized for its typical behavior. Boom and Crash indices use shorter periods and wider RSI thresholds. High-volatility synthetic indices use adjusted BB deviations. Commodity and forex instruments use their respective session hours for session filtering.

Panel Transparency Control

A new input parameter has been added to the Dashboard section: Panel Transparency Level. This allows users to control the opacity of the dashboard panel independently of the chart background. Four levels are available: 25%, 50%, 75%, and 100%. The transparency applies to all panel background elements including headers, rows, borders, tooltips, and buttons, while text colors remain fully opaque to preserve readability. The default value is set to 75%, providing a subtle transparency that allows chart price action to remain visible behind the panel.


Universal Broker Compatibility

The symbol detection system has been upgraded to automatically handle broker-specific symbol naming conventions. A new normalization function strips common suffixes such as .cash, .m, .i, .pro, .raw, .ecn, .stp, and similar variants, as well as prefixes like fx_, cfd_, and idx_. When a symbol is not found under its standard name, the indicator automatically tests multiple naming variations before reporting it as unavailable. This eliminates the need for manual symbol name adjustments when switching between broker accounts or platforms.


ADAPTIVE PARAMETER SYSTEM

IndexViz Pro does not use fixed indicator periods. Instead, it maintains pools of pre-calculated indicator handles and dynamically selects the most appropriate period based on current volatility conditions measured by the ATR EMA ratio. When volatility increases, shorter periods are selected for faster response. When volatility decreases, longer periods are selected for smoother signals. This adaptation happens automatically without any user intervention.

The auto-weighting system analyzes the historical performance of each analytical component per symbol over a configurable lookback period and adjusts the component weights accordingly. Components that have historically produced more accurate signals for a given instrument receive higher weights automatically.

SIGNAL FILTERING SYSTEM

Every signal passes through the following filters before being displayed:

Economic Calendar Filter: Blocks signals within a configurable window before and after high-impact news events for the relevant currency or country. Uses the MetaTrader 5 built-in economic calendar.

Spread Filter: Compares current spread to ATR and blocks signals when spread exceeds the configured ATR ratio threshold.

Session Filter: Each instrument is assigned to its primary trading session (New York, London, European, Asian, Sydney). Signals generated outside the primary session receive a configurable penalty multiplier.

Multi-Timeframe Filter: Signals that conflict with the higher timeframe trend receive a 40% score reduction.

Minimum Bars Between Signals: Prevents signal clustering by enforcing a minimum number of bars between consecutive signals on the same instrument.

Daily Drawdown Block: Blocks all signals when the daily drawdown limit is reached.

ALERTS AND NOTIFICATIONS

When a signal is generated, IndexViz Pro sends:

  • A MetaTrader 5 alert with full signal details including symbol, direction, bias score, signal strength, SL/TP in points, RVOL value, conviction level, suggested lots, and active pattern confirmations (FVG, BOS, CHoCH, SMT, Quad Stochastic Super Signal, Rejection Block)
  • Optional push notification to the MetaTrader mobile app
  • Console log entry for record keeping

INSTALLATION

  1. Copy the indicator file to the MQL5/Indicators folder of your MetaTrader 5 data directory.
  2. Restart MetaTrader 5 or refresh the Navigator panel.
  3. Drag the indicator onto any chart.
  4. The indicator will automatically detect all available instruments in your Market Watch and begin analysis.
  5. Optionally, enter a comma-separated list of specific symbols in the Symbol List input to restrict analysis to those instruments.

No additional files or libraries are required for basic operation.

CONFIGURATION GUIDE

General Configuration: Leave the Symbol List empty for automatic detection. Set the minimum bias score threshold (default 70) to control signal sensitivity. Lower values generate more signals with lower confidence. Higher values generate fewer signals with higher confidence.

Component Weights: Adjust the five component weights to match your trading style. Trend-following traders may increase the Trend weight. Mean-reversion traders may increase the Momentum and Volatility weights.

Filters: The ADX threshold controls the boundary between trending and ranging regime classification. The spread filter ratio prevents trading during abnormally wide spread conditions.

Risk Panel: Enter your account balance and risk percentage to enable automatic lot size calculation. The suggested lots displayed in the dashboard are calculated based on these values and the current ATR-based SL distance.

Dashboard: The dashboard can be repositioned by dragging the header. It can be minimized to show only the title bar. Font size and panel width are configurable. The auto-theme feature automatically switches between dark and light color palettes based on your chart background.

IMPORTANT NOTES

  • This indicator is designed for analysis and signal identification. It does not place trades automatically.
  • Past signal performance does not guarantee future results.
  • Always apply proper risk management regardless of signal conviction level.
  • The indicator requires historical data to be available for all monitored symbols. Symbols showing "Warming Up" status are still loading historical data and will become active automatically.
  • For optimal performance, ensure that all symbols you wish to monitor are visible in your Market Watch before attaching the indicator.

SUPPORT

For questions, configuration assistance, or feedback, please visit the author's profile page at: https://www.mql5.com/es/users/pablogx9

IndexViz Pro MT5 (IVP) v3.0 - Institutional Grade Copyright Gori German Pablo 2026. All rights reserved.

おすすめのプロダクト
Do you use volume in your reading of the market? Certainly many traders use it, and do not imagine operating without it. The Color Histogram Volume Set indicator allows the user to choose the value that he considers interesting to monitor. When you pass this you will have visual confirmation and if you want you will also have the audible alert that is given by the indicator. Of course, there are other ways to try to find a high volume, such as assessing whether the volume is above av
MTF VWAP Indicator - Quick Overview   This indicator shows you where institutional money is flowing across multiple timeframes using Volume Weighted Average Price (VWAP) to identify high-probability trading zones.     What It Actually Does:     1. Tracks Smart Money Levels: - Shows Daily, Weekly, and Monthly VWAP lines where big players (banks, funds) are trading - Tells you if price is above or below these key institutional levels - Shows distance from VWAP as a percentage (tells you how extend
The Tik Tok indicator was created on the basis of the original extreme search indicators, the indicator is well suited for determining a reversal or a big sharp jerk in one direction, thanks to it you will know when this happens it will notify you when a blue dot for buying red for sale appears. It basically uses the process of detecting the rate of change in price growth and allows you to find entry and exit points from the market. fundamental technical indicator that allows you to assess the
Weis Wave Scouterは、MetaTrader 5向けに開発された革新的なインジケーターであり、WyckoffメソッドとVSA(Volume Spread Analysis)の確立された原則を組み合わせています。精度と深みを求めるトレーダー向けに設計され、累積ボリューム波の分析を通じて市場を戦略的に読み取り、トレンドの反転ポイントや継続ポイントを特定する支援を行います。 Weis Wave Scouterは、クラシック、ナイトビジョン、オーシャンブリーズといったカスタマイズ可能なカラーテーマで、上昇波と下降波を色分けしたヒストグラムで明瞭に表示します。主な機能には、ボリュームピークの検出、低アクティビティゾーン(DeadZone)の識別、およびボリュームベースの波の反転に関するカスタマイズ可能なアラートが含まれます。また、エフォート対リザルト分析、因果関係、需給バランスといったWyckoffおよびVSA理論の基本概念をサポートしています。Brick Size、Volume Scale Factor、Pivot Lookbackといったパラメータで柔軟に調整でき、あらゆるスタ
Adjustable Consecutive Fractals  looks for 2 or more fractals in one direction and sends out a on screen alert, sound alert and push notification, for strong reversal points . Adjustable Consecutive Fractals, shows the fractals on chart along with a color changing text for buy and sell signals when one or more fractals appear on one side of price. Adjustable Consecutive Fractals is based Bill Williams Fractals . The standard Bill Williams fractals are set at a non adjustable 5 bars, BUT withe th
Gold Trend - これは優れた株価テクニカル指標です。指標のアルゴリズムは、資産の値動きを分析し、ボラティリティと潜在的なエントリーゾーンを反映しています。 最高の指標シグナル: - 売りの場合 = 赤のヒストグラム + 赤のショートポインター + 同じ方向に黄色のシグナル矢印 + 赤色のトレンド方向矢印 。 - 買いの場合 = 青のヒストグラム + 青のロングポインター + 同じ方向の水色のシグナル矢印 + 青色のトレンド方向矢印 。 インジケータの利点 1. このインディケータは、高い精度でシグナルを発信します。 2. 確定した矢印シグナルは、トレンドが変化したときにのみ再描画されます。 3. どのブローカーのMetaTrader 5取引プラットフォームでも取引できます。 4. あらゆる資産(通貨、金属、暗号通貨、株式、指数など)を取引できます。 5. M15-H1タイムフレーム(中期取引)で取引するのがよい。 6. 各トレーダーがインディケータを自分用に簡単にカスタマイズできるよう、インディケータ設定で個々のパラメータ(TF、色など)を変更できます。 7.
RBreaker Gold Indicatorsは、金先物の短期日内取引戦略であり、トレンドフォローと日内反転の2つの取引手法を組み合わせたものです。トレンド相場での利益を捉えるだけでなく、相場が反転した際には迅速に利確し、その流れに沿ってポジションを反転させることができます。 この戦略は、アメリカの雑誌『Futures Truth』において、15年連続で最も収益性の高い取引戦略トップ10に選ばれた実績を持ち、非常に長いライフサイクルを誇り、現在も国内外で広く使用・研究されています。 本インディケーターは、2026年の金先物の値動きに対応し、14日間のATR指標に基づいて、ブレイクアウト係数A、観察係数B、リバーサル係数Rをより合理的な値で定義しています。非常に優れたインディケーターであり、安定的な年間収益を実現しています。ぜひおすすめします〜
Your Pointer is no ordinary Forex channel. This corridor is built on the basis of the analysis of several candles, starting from the last one, as a result of which the extremes of the studied interval are determined. They are the ones who create the channel lines. Like all channels, it has a middle line as well as a high and low line. This channel is worth watching for its unusual behavior. The use of the Your Pointer indicator allows the trader to react in time to the price going beyond the bo
Price Magnet — Price Density and Attraction Levels Indicator Price Magnet is a professional analytical tool designed to identify key support and resistance levels based on statistical Price Density. The indicator analyzes a specified historical period and detects price levels where the market spent the most time. These zones act as “magnets,” attracting price action or forming a structural base for potential reversals. Unlike traditional Volume Profile tools, Price Magnet focuses on price-time d
Volume Profile for MetaTrader 5 Price movement alone does not explain where the market is actually traded . What matters is where volume is built and how these areas shift over time. This Volume Profile displays the volume distribution directly on the chart , making it clear which price levels were accepted by the market and where rejection occurred. This allows structurally relevant zones to be identified and integrated into individual decision-making processes. The tool is designed for high pe
SMC Venom Model BPR インジケーターは、スマート マネー (SMC) コンセプトで取引するトレーダー向けのプロフェッショナル ツールです。価格チャート上の 2 つの主要なパターンを自動的に識別します。 FVG   (フェアバリューギャップ) は、3 本のローソク足の組み合わせで、最初のローソク足と 3 番目のローソク足の間にギャップがあります。ボリュームサポートのないレベル間のゾーンを形成し、価格修正につながることがよくあります。 BPR   (バランス価格範囲) は、2 つの FVG パターンの組み合わせで、「ブリッジ」を形成します。これは、価格がボリュームアクティビティの少ない動きで動くときに、ブレイクアウトしてレベルに戻るゾーンで、ローソク足の間にギャップを作成します。 これらのパターンは、大規模な市場プレーヤーと一般参加者の相互作用が発生するチャート上のボリュームと価格動向の分析に基づいて、トレーダーが主要なサポート/レジスタンス レベル、ブレイクアウト ゾーン、エントリ ポイントを識別するのに役立ちます。 インジケーターは、長方形と矢印の形でパターンを視覚
Range Directional Force Indicator – Designed for You to Optimize! The Range Directional Force Indicator is a cutting-edge tool designed to empower traders by visualizing market dynamics and directional strength. Built to offer insights into market trends and reversals, this indicator is an invaluable asset for traders seeking precision in their strategies. However, it is important to note that this indicator is not optimized, leaving room for you to tailor it to your unique trading preferences.
Was: $249  Now: $99   Market Profile defines a number of day types that can help the trader to determine market behaviour. A key feature is the Value Area, representing the range of price action where 70% of trading took place. Understanding the Value Area can give traders valuable insight into market direction and establish the higher odds trade. It is an excellent addition to any system you may be using. Inspired by Jim Dalton’s book “Mind Over Markets”, this indicator is designed to suit the
A simple Zig Zag indicator with added visualization of Higher High, Lower High, Higher Low, Lower Low. This indicator will be very helpful when working with support/resistance levels. The ZigZag indicator is a fundamental tool that will significantly help you navigate complex situations in the financial markets. By providing a clear visual representation of price movements and trends, it simplifies the analysis process and improves decision-making capabilities. Its role in identifying trends and
回帰取引を意味する専門的かつ定量的なアプローチを実装する独自の指標。これは、価格が予測可能かつ測定可能な方法で迂回して平均に戻るという事実を利用しており、非定量的な取引戦略を大幅に上回る明確な出入りルールを可能にします。 [ Installation Guide | Update Guide | Troubleshooting | FAQ | All Products ] 明確な取引シグナル 驚くほど簡単に取引できます カスタマイズ可能な色とサイズ パフォーマンス統計を実装します ほとんどの取引戦略を上回ります 適切なSLおよびTPレベルを表示します 電子メール/音声/視覚アラートを実装します 使い方 インディケータは、より高い時間枠からの完全にカスタマイズ可能な移動平均の周りの標準偏差を測定し、トレンドフォローアプローチを使用して正確に取引を見つけます。取引は、現在のチャートの価格アクションに飛び込むことによって見つけられ、価格が選択したより高い時間枠から計算された平均価格帯に戻ったときに閉じられます。それがコード化される方法のために、指標は高ボラティリティと強いトレンドの市場か
Naked Forex Kangaroo Tail Indicator Kangaroo Tail Indicator is a pattern recognition indicator for Forex, Stocks, Indices, Futures, Commodities and Cryptos. The Kangaroo Tail is a multi-bar pattern. The Kangaroo Tail pattern is very effective and is very simple to trade. The strategy that comes with the Kangaroo Tail is based on price action. The indicator does what it was designed for: displaying Kangaroo Tail patterns.   Don't expect to follow the up and down arrows and make money . Tradin
This is Gekko's Cutomized Cutomized Average Directional Index (ADX), a customized version of the famous ADX indicator. Use the regular ADX and take advantage two entry signals calculations and different ways of being alerted whenever there is potential entry or exit point. Inputs Period: Period for the ADX calculation; PlotSignalType: How will the indicator calculate entry (swing) signals: 1- ShowSwingsOnTrendLevel : Show Signals for Trend Confirmation Swings; 2- ShowSwingsOnTrendLevelDirection
Phantom Edge SMC — The Ultimate Smart Money Indicator for MT5 Tired of manually drawing structures while trading SMC or ICT concepts? Let Phantom Edge SMC do the heavy lifting for you. Key Features Internal & Swing Structure: Automatically detects BOS and CHoCH across two structural levels. Order Blocks (OB): Identifies Internal and Swing OBs with automated mitigation tracking. Equal Highs / Lows: Highlights EQH / EQL to pinpoint Liquidity pools. Fair Value Gaps (FVG): Displays FVGs with
The Super Arrow Indicator provides non-repainting buy and sell signals with exceptional accuracy. Key Features No repainting – confirmed signals remain fixed Clear visual arrows: green for buy, red for sell Real-time alerts via pop-up, sound, and optional email Clean chart view with no unnecessary clutter Works on all markets: Forex, gold, oil, indices, crypto Adjustable Parameters TimeFrame Default:   "current time frame" Function:   Sets the time frame for indicator calculation Options:   Can
Volume Profile Canvas - Professional Volume Profile Indicator for MetaTrader 5 DESCRIPTION Volume Profile Canvas is a professional volume profile indicator for MetaTrader 5 that renders directly on the chart using a high-performance Canvas engine. It calculates and displays the volume distribution across price levels, identifying the Point of Control (POC), Value Area High (VAH) and Value Area Low (VAL) in real time. This is a pure analysis tool. It does not trade. It gives you an instant vi
Introduction to the Manual Backtesting Indicator on MQL5 The MetaTrader platform provides an excellent backtesting tool for evaluating Expert Advisors (EAs). However, when it comes to manually backtesting a strategy to assess its effectiveness, this tool has some limitations: You cannot manually draw zones or trend lines while in backtesting mode. You cannot switch timeframes to check time alignment. For example, if my strategy requires additional confirmation from a higher timeframe (HTF), this
Support & Resistance Auto Plot Lines Indicator for MT5 – Perfect for Scalping! Make your trading easier with our Support & Resistance Auto Plot Lines indicator for MT5. This powerful tool automatically detects key support and resistance levels on your chart, helping you make better trading decisions with minimal effort. Why Choose This Indicator? Perfect for Scalping – Quickly identify strong price zones for fast, precise entries and exits. Automatic Level Detection – No need to manually dra
Daily Volume Profile - See Where Smart Money Trades Stop guessing support and resistance. Start seeing where REAL volume is. The Daily Volume Profile indicator reveals the hidden structure of the market by showing exactly where trading activity concentrates at each price level. While most traders use lagging indicators, you'll see where institutional money positions itself - BEFORE the move happens. What You Get: → POC (Point of Control) - The most powerful S/R level of each day, shown as a cle
MT5用Crypto_Forexインジケーター「HTFモメンタム」 - HTFモメンタムは、価格変動率を測定する主要インジケーターの一つです。HTFとは、高時間足を意味します。 - このインジケーターはトレンドの方向を示し、現在の値と過去の値を比較することで価格変動のペースを測定します。 - HTFモメンタムインジケーターは、スキャルピングエントリーや他のインジケーターと組み合わせたマルチタイムフレーム取引システムに最適です。 - このインジケーターを使用すると、高時間足のモメンタムを現在のチャートに表示できます。 - インジケーターには、モバイルとPCの両方でアラートが利用できます。 高品質のトレーディングロボットとインジケーターをご覧になるにはここをクリックしてください! これは、このMQL5ウェブサイトでのみ提供されるオリジナル製品です。
Divergent Stochastic Filter II Catch Reversals Early, Filter Noise, Trade with Confidence The Edge: Why This Stochastic is Different  Every trader knows the Stochastic oscillator. But knowing when to trust its signals, that's the real challenge. The Divergent Stochastic Filter II transforms this classic indicator into a precision reversal detection system by adding critical elements: divergence intelligence, signal filtering and exhaustion detection.  While standard Stochastic oscillators fire s
フラットとトレンドを決定するための指標。 価格が2つのヒストグラムと2つの線(赤と青)のいずれかを下回っている場合、これは売りゾーンです。 このバージョンのインジケーターを購入するときは、1つの実際のアカウントと1つのデモアカウント用のMT4バージョン-ギフトとして(受け取るには、プライベートメッセージを書いてください)! 価格が2つのヒストグラムと2つの線(赤と青)のいずれかを上回っている場合、これは購入ゾーンです。 MT4バージョン: https//www.mql5.com/en/market/product/3793 価格が2つの線の間、またはいずれかのヒストグラムのゾーンにある場合、市場に明確な傾向はありません。簡単に言えば、市場は横ばいです。 インジケーターの動作は、スクリーンショットでより明確に示されています。
Cumulative Volume Delta MAX MTF Pro v4.4 — 出来高ベース・トレーディングの究極の優位性 一つのインジケーターですべてを支配する:市場の「真の意図」を見抜く 値動きに現れる前に、大口投資家(機関投資家)が何をしているかを知ることで、推測の域を脱しましょう。CVD MAX MTF Pro v4.4は出来高分析テクノロジーの到達点であり、複雑なデータを明確で実用的なシグナルへと変換します。このバージョンでは、外科的精度の「ダイバージェンス検出」と「グラデーション認識型モメンタム」を導入し、価格変動を駆動する隠れた力をかつてない精度で明らかにします。 v4.4の新機能:精度の進化 動的グラデーション認識型移動平均線 (MA) 従来の静的なトレンドラインを「4色グラデーションシステム」に置き換えました。単に「上昇トレンド」を見るだけでなく、そのトレンドの「健全性」をリアルタイムで把握できます: DeepSkyBlue: ゼロラインより上で上昇中(強気な急騰) Orange: ゼロラインより上で下落中(強気の衰退/押し目) Magenta: ゼロラインより
This z-score indicator shows the correct z-score of an asset, as it uses the normalized price data for calculation, which is the only correct way. Z-score is only applicable for normal distributed data, therefore not the actual price is considered, but the normalised returns, which were assumed to follow a normal distribution. Returns are mean reverting and assumed to follow a normal distribution, therefore z-score calculation of returns is more reliable than z-score on price, as price is NOT m
当社の革新的なベーシック・ローソク足パターン・ダッシュボードは、チャート上の有益なローソク足パターンを自動的に識別するために特別に設計されています。このダッシュボードは、リアルタイムで価格チャートをスキャンし、古典的なものから複雑なものまで、幅広いローソク足パターンを検出する高度なアルゴリズムを使用しています。さらに、検出されたパターンをさまざまな時間枠で視覚化できる使いやすいインターフェイスを備えており、十分な情報に基づいた意思決定を簡単に行うことができます /  MT4バージョン 無料インディケータ:   Basic Candlestick Patterns 含まれるハーモニック・パターン 強気パターン Hammer  Inverse hammer Bullish engulfing Morning star 3 White soldiers 弱気パターン Hanging man Shooting star Bearish engulfing Evening star 3 Black crows インジケーターの列 Symbol:   選択したシンボルが表示されます
このプロダクトを購入した人は以下も購入しています
SuperScalp Pro — 高度なマルチフィルター対応スキャルピングインジケーターシステム SuperScalp Pro は、クラシックな Supertrend と複数のインテリジェントな確認フィルターを組み合わせた高度なスキャルピング用インジケーターシステムです。M1〜H4 のすべての時間足で効率的に機能し、特に XAUUSD、BTCUSD、および主要なFX通貨ペアに適しています。単体のシステムとして、また既存の取引戦略へ柔軟に統合して使用できます。 本インジケーターは 11 以上のフィルターを統合しており、短期・長期の EMA、トレンド判定に用いる 3 本の EMA、EMA スロープ(EMA slope)、RSI、ADX、出来高、VWAP、ボリンジャーバンドのブレイクアウト、MACD ダイバージェンスフィルターなどを含みます。スマートキャンドルフィルターはローソク足の終値を確認して弱いシグナルを排除し、3 本の EMA と MACD ダイバージェンスを組み合わせたトレンド認識メカニズムにより勝率の高いシグナルの選別を支援します。 SuperScalp Pro は ATR に基
Azimuth Pro
Ottaviano De Cicco
5 (6)
発売プロモーション Azimuth Proは先着100名様限定で 299ドル でご提供します。最終価格は 499ドル となります。 リテールとインスティテューショナルのエントリーの違いはインジケーターではなく、ロケーションにあります。 多くのトレーダーは、モメンタムを追いかけたり、遅行シグナルに反応して、任意の価格レベルでエントリーします。機関投資家は、需給が実際にシフトする構造的なレベルに価格が到達するのを待ちます。 Azimuth Proはこれらのレベルを自動的にマッピングします:スイングアンカーVWAP、マルチタイムフレーム構造ライン、高確率ロケーションにのみ出現するABCパターン。 Azimuth Proは、構造分析とインテリジェントな自動化の両方を求めるプロフェッショナルトレーダー向けに構築されています。 Azimuthが外科的精度で市場構造をマッピングする一方、Azimuth Proはインテリジェンスレイヤーを追加します:トレーディングスタイルの自動検出、スマート設定された移動平均線、20年のデータでバックテストされた最適化パラメータ。その結果、お使いの銘柄と
Entry In The Zone and SMC Multi Timeframe is a real-time market analysis tool developed based on Smart Money Concepts (SMC). It is designed to analyze market structure, price direction, reversal points, and key zones across multiple timeframes in a systematic way. The system displays Points of Interest (POI) and real-time No Repaint signals, with instant alerts when price reaches key zones or when signals occur within those zones. It functions as both an Indicator and a Signal System (2-in-1), c
このインジケーターを購入された方には、以下の特典を 無料 で提供しています: 各トレードを自動で管理し、ストップロスとテイクプロフィットを設定し、戦略ルールに基づいてポジションを決済する補助ツール 「Bomber Utility」 様々な銘柄に合わせたインジケーターの設定ファイル(セットファイル) 「最小リスク」、「バランスリスク」、「待機戦略」 の3つのモードで使用できる Bomber Utility 用の設定ファイル このトレーディング戦略をすぐに導入・設定・開始できる ステップバイステップのビデオマニュアル ご注意: 上記の特典を受け取るには、MQL5のプライベートメッセージシステムを通じて販売者にご連絡ください。 オリジナルのカスタムインジケーター 「Divergence Bomber(ダイバージェンス・ボンバー)」 をご紹介します。これは、MACDのダイバージェンス(乖離)戦略に基づいた 「オールインワン」型のトレーディングシステム です。 このテクニカルインジケーターの主な目的は、価格とMACDインジケーターの間に発生するダイバージェンスを検出 し、将来の価格の動きを示す
ARICoin is a powerful trading companion designed to generate high-probability entry signals with dynamic TP/SL/DP levels based on volatility. Built-in performance tracking shows win/loss stats, PP1/PP2 hits, and success rates all updated live. Key Features: Buy/Sell signals with adaptive volatility bands Real-time TP/SL/DP levels based on ATR Built-in MA Filter with optional ATR/StdDev volatility Performance stats panel (Success, Profit/Loss, PP1/PP2) Alerts via popup, sound, push, or email Cust
CGE Trading Suite
Carl Gustav Johan Ekstrom
5 (1)
CGE Trading Suite delivers the analytical edge typically reserved for professional trading desks. The platform integrates a full suite of analytical tools into one seamless workflow: dynamic grid mapping, liquidity behavior analysis, ECM, trend lines, MIDAS, trade cycles, and directional channel projections. Together, these provide a unified view of market structure and momentum. Directional clarity is further enhanced by the capital flow index, which measures currency basket strength to identif
このインジケーターを購入すると、プロ仕様のトレードマネージャーを無料で差し上げます。 まず第一に、このトレーディングシステムがノンリペイント、ノンリドロー、ノンラグのインジケーターであることを強調する価値がある。これにより、手動取引とロボット取引の両方に理想的なものになっています。 オンラインコース、マニュアル、プリセットのダウンロード。 「スマートトレンドトレーディングシステム MT5」は、新規および経験豊富なトレーダー向けにカスタマイズされた包括的なトレーディングソリューションです。10以上のプレミアムインジケーターを組み合わせ、7つ以上の堅実なトレーディング戦略を備えており、多様な市場状況に対応する多目的な選択肢となっています。 トレンドフォロー戦略:トレンドを効果的に乗り越えるための正確なエントリーとストップロス管理を提供します。 リバーサル戦略:潜在的なトレンドの反転を特定し、トレーダーがレンジ相場を活用できるようにします。 スキャルピング戦略:高速で正確なデイトレードおよび短期取引のために設計されています。 安定性:すべてのインジケーターはノンリペイント、ノンリドロー、ノ
Meridian Pro
Ottaviano De Cicco
5 (1)
Meridian Pro:MT5用プロフェッショナル・マルチタイムフレーム・トレンドマトリックス 概要 Meridian Pro は Merkava Labs が開発したマルチタイムフレーム・トレンドマトリックスで、方向性の状態、強度、モメンタムの状況、マトリックスの合意をひとつのコンパクトなパネルに集約します。ひとつのアダプティブエンジンがM1からW1まで一貫して適用されます。シンボルごとの調整は不要。インジケーターの積み重ねも不要。すべてのアセットとすべてのタイムフレームをカバーするひとつの構造化された読み取りです。 発売キャンペーン — Meridian Proを USD 99 (導入価格)で入手。通常価格:USD 149 。 1. Meridian Proが他と異なる理由 ひとつのエンジン、バラバラなインジケーターのダッシュボードではない 多くのMTFダッシュボードは、タイムフレームごとに生のインジケーター値を繰り返すだけです。Meridian Proはマトリックス全体でひとつのアダプティブ・トレンドエンジンを使用するため、パネルの各行が同じ構造化フレームワークから導出されます
RelicusRoad Pro: 定量的市場オペレーティングシステム 【期間限定】無制限アクセス 70% OFF - 2,000人超のトレーダーと共に なぜ多くのトレーダーは「完璧な」インジケーターを使っても失敗するのでしょうか? それは、文脈を無視して 単一の概念 だけでトレードしているからです。文脈のないシグナルは単なるギャンブルです。勝ち続けるには、 根拠の重なり(コンフルエンス) が必要です。 RelicusRoad Proは単なる矢印インジケーターではありません。完全な 定量的市場エコシステム です。独自のボラティリティモデリングを用いて、価格が推移する「適正価値の道(Fair Value Road)」をマッピングし、ノイズと真の構造的ブレイクを判別します。 推測はやめましょう。機関投資家レベルの「ロード・ロジック」でトレードを。 コアエンジン:「Road」アルゴリズム システムの中心となる Road Algo は、市場環境にリアルタイムで適応するダイナミックなボラティリティチャネルです。 安全ライン(平衡点) と、価格が数学的に反転しやすい 拡張レベル を投影します。 Si
FX Trend NG:次世代マルチマーケット・トレンドインテリジェンス 概要 FX Trend NG は、複数の時間足に対応したプロフェッショナル向けトレンド分析およびマーケット監視ツールです。 市場全体の構造を数秒で把握することができます。 複数のチャートを切り替える必要はありません。どの銘柄がトレンド中なのか、どこでモメンタムが弱まっているのか、そしてどの時間足で強い整合性があるのかを瞬時に確認できます。 ローンチ特別オファー – FX Trend NG を $30(6ヶ月) または $80 永久ライセンス でご利用いただけます。 すでに Stein Investments のユーザーですか? -> メッセージを送信 して、プライベートグループへアクセスしてください。 セットアップや詳細情報が必要ですか? -> Stein Investments 公式ページ をご覧ください。 1. FX Trend NG が他と異なる理由 3ステート・トレンドロジック ― Buy と Sell だけではない • 多くのインジケーターは Buy または Sell の2状態のみを表示します。
AriX
Temirlan Kdyrkhan
1 (4)
AriX Indicator for MT5 A powerful trend-following and signal-evaluation tool AriX is a custom MT5 indicator that combines Moving Averages and ATR-based risk/reward logic to generate clear buy/sell signals. It visualizes dynamic SL/TP levels, evaluates past trade outcomes, and displays win/loss statistics in a clean on-chart panel. Key features include: Buy/Sell signals based on MA crossovers ATR-based SL/TP1/TP2/TP3 levels with visual lines and labels Signal outcome tracking with real-time stat
Power Candles – あらゆる市場に対応した強度ベースのエントリーシグナル Power Candles は、Stein Investments が長年培ってきた強度分析を価格チャート上に直接反映します。価格だけに反応するのではなく、各ローソク足は実際の市場の強さに基づいて色分けされ、モメンタムの蓄積、強度の加速、明確なトレンド転換を瞬時に把握できます。 すべての市場に共通する単一ロジック Power Candles は すべての取引シンボル で自動的に動作します。現在のシンボルが Forex か非 Forex 市場かを自動判別し、内部で適切な強度モデルを適用します。 Forex および Gold :FX Power のデルタ値を使用(絶対値レンジ最大 100) 指数、暗号資産、CFD :IX Power の強度値を使用(絶対値レンジ最大 50) 必要な強度計算は Power Candles に直接組み込まれています。ローソク足のカラーリングやシグナルロジックに、追加のインジケーターは不要です。 価格ノイズではなく「強度状態」 各ローソク足は、以下の 9 つの明確に定義された強
Quantum TrendPulse を ご紹介します。これは、   SuperTrend   、   RSI   、および Stochastic のパワーを 1 つの包括的なインジケーターに組み合わせて、取引の可能性を最大限に引き出す究極の取引ツールです。精度と効率を求めるトレーダー向けに設計されたこのインジケーターは、市場のトレンド、勢いの変化、最適なエントリー ポイントとエグジット ポイントを自信を持って特定するのに役立ちます。 主な特徴: SuperTrend 統合: 現在の市場動向に簡単に追従し、収益性の波に乗ることができます。 RSI精度: 買われすぎと売られすぎのレベルを検出し、市場の反転のタイミングに最適で、SuperTrendのフィルターとして使用されます。 確率的精度: 確率的振動を活用して、変動の激しい市場で隠れたチャンスを見つけます。SuperTrend のフィルターとして使用されます。 マルチタイムフレーム分析:   M5 から H1 または H4 まで、さまざまなタイムフレームで市場を常に把握します。 カスタマイズ可能なアラート: カスタム取引条件が満たされ
トレンド スクリーナー インジケーターでトレンド取引の力を解き放ちます。ファジー ロジックと複数通貨システムを活用した究極のトレンド取引ソリューションです。 ファジー ロジックを活用した革新的なトレンド インジケーターである Trend Screener を使用して、トレンド取引を向上させます。 これは、13 を超えるプレミアム ツールと機能、および 3 つの取引戦略を組み合わせた強力なトレンド追跡インジケーターであり、Metatrader をトレンド アナライザーにする多用途の選択肢となります。 期間限定オファー : トレンド スクリーナー インジケーターは、わずか 100 ドルで生涯ご利用いただけます。 (元の価格 50$ ) (オファー延長) Trend Screener の 100% 非再描画精度の揺るぎない精度を体験して、取引の決定が過去の価格変動の影響を受けないようにしてください。 マルチタイムフレームおよびマルチ通貨機能の多用途性を解放し、比類のない自信を持って外国為替、商品、暗号通貨、インデックスの世界を取引できるようにします。 Trend Screener の包括的な
[ My Products ] , [ My Channel ]   ,  [ LIVE SIGNAL ] HFT Spike Detector HFT Spike Detector は、高頻度取引(HFT)による急激な価格変動をリアルタイムで分析・測定するために開発されたプロフェッショナルなティック監視ツールです。 目的は、ブローカーによって引き起こされる異常なスリッページ、流動性のギャップ、ミリ秒単位の価格スパイクを数値データで検出できるようにすることです。 リアルタイムのティックフローと約定条件を分析するため、バックテストで正確に評価することはできません。 このEAは、自動化のために用意されたセットファイルと一緒に使用するために購入できます: VolumeHedger EA 動作原理 この Expert Advisor は、受信するすべてのティックをリアルタイムで分析し、以下を行います: 価格変動速度 1秒あたりのティック密度 スリッページの大きさ 同方向のマイクロフロー 測定し、チャート上のパネルに表示します。 これにより、スプレッドを除いた実際の執行品質を確認できま
まず第一に、この取引インジケーターは再描画されず、再描画されず、遅延しないことを強調する価値があります。これにより、手動取引とロボット取引の両方に理想的なものになります。 ユーザーマニュアル:設定、入力、戦略。 アトミックアナリストは、価格の強さとモメンタムを利用して市場でより良いエッジを見つけるためのPA価格アクションインジケーターです。ノイズや誤ったシグナルを除去し、取引ポテンシャルを高めるための高度なフィルターを備えています。複雑なインジケーターの複数のレイヤーを使用して、アトミックアナリストはチャートをスキャンし、複雑な数学的計算をシンプルなシグナルと色に変換します。これにより、どのような初心者トレーダーでも理解して使用し、一貫した取引の決定を行うことができます。 「アトミックアナリスト」は、新規および経験豊富なトレーダー向けにカスタマイズされた包括的な取引ソリューションです。プレミアムインジケーターとトップノッチの機能を1つの取引戦略に組み合わせ、すべてのタイプのトレーダーにとって汎用性のある選択肢にします。 デイリートレーディングとスキャルピング戦略:高速で正確なデイ
マーケットメーカーのためのツール。 Meravith は次の機能を提供します: すべての時間足を分析し、現在有効なトレンドを表示します。 強気と弱気の出来高が等しくなる流動性ゾーン(出来高均衡)を強調表示します。 異なる時間足のすべての流動性レベルをチャート上に直接表示します。 テキスト形式の市場分析を生成し、参考情報として表示します。 現在のトレンドに基づいて目標値、サポートレベル、ストップロスを計算します。 取引のリスクリワード比を算出します。 口座残高に基づいてポジションサイズを計算し、潜在的な利益を推定します。 また、市場に大きな変化があった場合には警告を表示します。 インジケーターの主要ライン: 強気/弱気の出来高エグゾーストライン ― 目標値として機能します。 市場のトレンドを示すライン。市場が強気か弱気かによって色が変わり、トレンドのサポートとして機能します。主にその色が市場センチメントを示します。 出来高均衡ライン(Eq)。Eq(Volume Equilibrium)ラインはシステムの中核です。これは買い手と売り手の出来高のバランスポイントを表します。市場の流動性を示し
OmniSync Projection
Antonio-alin Teculescu
5 (1)
Chronos Fractal Engine is an innovative price projection indicator for MetaTrader 5, designed to transform your technical analysis by intelligently identifying and projecting historical price patterns. Built upon an advanced correlation algorithm and the fractal principles of the market, this powerful tool visualizes potential future price movements, giving you a unique edge in your trading decisions. What is Chronos Fractal Engine? At its core, the Chronos Fractal Engine employs a sophisticat
優れたテクニカルインジケーター「Grabber」をご紹介します。これは、すぐに使える「オールインワン」トレーディング戦略として機能します。 ひとつのコードに、市場のテクニカル分析ツール、取引シグナル(矢印)、アラート機能、プッシュ通知が強力に統合されています。 このインジケーターを購入された方には、以下の特典を無料で提供します: Grabberユーティリティ:オープンポジションを自動で管理するツール ステップバイステップのビデオマニュアル:インジケーターのインストール、設定、取引方法を解説 カスタムセットファイル:インジケーターをすばやく自動設定し、最大限の成果を出すための設定ファイル 他の戦略はもう忘れてください!Grabberだけが、あなたを新たなトレードの高みへと導いてくれるのです。 Grabber戦略の主な特徴: 推奨タイムフレーム:M5〜H4 対応通貨ペア・資産:どれでも使用可能ですが、私が実際に検証した以下を推奨します(GBPUSD、GBPCAD、GBPCHF、AUDCAD、AUDUSD、AUDSGD、AUDCHF、NZDUSD、NZDCAD、EURCAD、EURUSD、E
Bill Williams Advanced is designed for automatic chart analysis using Bill Williams' "Profitunity" system. The indicator analyzes four timeframes at once. Manual (Be sure to read before purchasing) Advantages 1. Analyzes the chart using Bill Williams' "Profitunity" system. Signals are displayed in a table in the corner of the screen and on the price chart. 2. Finds all known AO and AC signals, as well as zone signals. Equipped with a trend filter based on the Alligator. 3. Finds "Divergence Bar
Currency Strength Dashboard Pro MetaTrader 5 用の リアルタイム通貨強度分析プロフェッショナルダッシュボード 。 このインジケーターは、 8つの主要通貨 (EUR、USD、GBP、JPY、CHF、AUD、CAD、NZD)の強さを計算し、 28の通貨ペア を同時に複数の時間足で分析・表示します。 ダッシュボードにより、トレーダーは 市場全体の状況を一目で把握 でき、余計な計算や複数のチャートを切り替える必要がありません。 計算方法 このインジケーターは、 高度な数学的通貨強度分析手法 に基づいています。 これは、類似インジケーターで一般的に使用されている RSIベースの手法 と比較して、より正確で客観的です。 この方法は 28の通貨ペアすべての相互関係を同時に分析 し、市場における実際の力関係をよりクリーンで偏りのない形で表示します。 リアルタイムダッシュボード メインテーブルには 8つの通貨 の完全なデータが表示されます。 Rank(順位) — 通貨の総合強度による順位。 1(最も強い)〜8(最も弱い) 。 Strength(強度) — 現在
FX Power: 通貨の強弱を分析して、より賢い取引を実現 概要 FX Power は主要通貨と金の実際の強弱をあらゆる市場状況で理解するための必須ツールです。強い通貨を買い、弱い通貨を売ることで、 FX Power は取引の意思決定を簡素化し、高い確率の取引機会を見出します。トレンドを追従する場合でも、極端なデルタ値を使用して反転を予測する場合でも、このツールはあなたの取引スタイルに完全に適応します。ただ取引するだけではなく、 FX Power で賢く取引をしましょう。 1. なぜ FX Power がトレーダーにとって非常に有益なのか 通貨と金のリアルタイム強弱分析 • FX Power は主要通貨と金の相対的な強弱を計算し、マーケットダイナミクスに関する明確な洞察を提供します。 • どの資産がリードしているか、または後れを取っているかを監視して、取引するペアを賢く選びましょう。 マルチタイムフレームの包括的なビュー • 短期、中期、長期のタイムフレームで通貨と金の強弱を追跡し、マーケットトレンドに基づいて取引戦略を調整できます。 • スキャルピングからスイングトレード
ご紹介     Quantum Breakout PRO は 、ブレイクアウト ゾーンの取引方法を変革する画期的な MQL5 インジケーターです。 13年以上の取引経験を持つ経験豊富なトレーダーのチームによって開発されました。     クォンタム ブレイクアウト プロ   は、革新的でダイナミックなブレイクアウト ゾーン戦略により、あなたのトレーディングの旅を新たな高みに押し上げるように設計されています。 クォンタム ブレイクアウト インジケーターは、5 つの利益ターゲット ゾーンを備えたブレイクアウト ゾーン上のシグナル矢印と、ブレイクアウト ボックスに基づいたストップロスの提案を提供します。 初心者トレーダーにもプロのトレーダーにも適しています。 量子EAチャネル:       ここをクリック 重要!購入後、インストールマニュアルを受け取るためにプライベートメッセージを送ってください。 推奨事項: 時間枠: M15 通貨ペア: GBPJPY、EURJPY、USDJPY、NZDUSD、XAUUSD アカウントの種類: ECN、Raw、またはスプレッドが非常に低い R
Market Structure Order Block Dashboard MT5 は、 MT5(MetaTrader 5)用インジケーター です。 市場構造 と ICT / Smart Money Concepts に基づき、 HH/HL/LH/LL 、 BOS 、 ChoCH に加えて、 Order Blocks 、 Fair Value Gaps (FVG) 、 流動性 (EQH/EQL、sweeps)、 セッション / Kill Zones 、 Volume Profile を表示し、コンパクトなコンフルエンス・ダッシュボードを提供します。 重要: これは 分析ツール です。自動売買は行いません(EAではありません)。 購入者特典(ボーナス) 購入後、私のストアから 2つのボーナスインジケーター を(選択して)受け取ることができます。 ボーナスの受け取り方法: 1) 本商品のページに正直なレビューを投稿してください。 2) MQL5のメッセージで、 BONUS MSOB + 選んだ 2つのインジケーター名 を送ってください。 主な機能 市場構造: HH/HL/LH/LL
このインジケーターは、反転ポイントと価格戻りゾーンを正確に表示します。     主要プレーヤー 。新たなトレンドが形成される場所を把握し、最大限の精度で意思決定を行い、すべての取引をコントロールします。 TREND LINES PRO インジケーターと組み合わせることで、その潜在能力を最大限に発揮します。 VERSION MT4 インジケーターが示す内容: 新しいトレンドの始まりに活性化する反転構造と反転レベル。 リスクと報酬の比率を最小限に抑えた利益 確定 と 損失停止の レベルの表示     RR 1:2   。 インテリジェントな削減ロジックによるストップロス。 指定されたインジケーターから 2 つのトレンド タイプの反転パターンを表示します。 指標: トレンドを追う   TREND LINES PRO   (世界的なトレンドの変化) TREND PRO   (クイックトレンド変更) シンプルで効果的   スキャナー   リアルタイムトレンド(新機能)。 マルチタイムフレームのインストゥルメント フィルタリング。 画面   利益     LOGIC AI信号の後。 当日プラス方
現在33%オフ 初心者にもエキスパートトレーダーにも最適なソリューション このインジケーターは独自の機能と新しい公式を多数内蔵しており、ユニークで高品質かつ手頃な取引ツールです。このアップデートでは、2つの時間枠ゾーンを表示できるようになります。より長いTFだけでなく、チャートTFとより長いTF(ネストゾーンを表示)の両方を表示できます。すべてのSupply Demandトレーダーの皆さんのお気に召すはずです。:) 重要情報の公開 Advanced Supply Demandの可能性を最大化するには、 https://www.mql5.com/ja/blogs/post/720245 にアクセスしてください。   エントリーまたはターゲットの正確なトリガーポイントを正確に特定できれば取引がどのように改善されるか想像してみてください。新しい基盤となるアルゴリズムに基づいて構築されているため、買い手と売り手の間の潜在的な不均衡をさらに簡単に特定できます。これは、最も強い需要と供給のゾーンと、過去のパフォーマンス(古いゾーンを表示)がグラフィカルに表現されるためです。これらの機能は、最適な
The Trend Forecaster indicator utilizes a unique proprietary algorithm to determine entry points for a breakout trading strategy. The indicator identifies price clusters, analyzes price movement near levels, and provides a signal when the price breaks through a level. The Trend Forecaster indicator is suitable for all financial assets, including currencies (Forex), metals, stocks, indices, and cryptocurrencies. You can also adjust the indicator to work on any time frames, although it is recommen
Crystal Heikin Ashi Signals - Professional Trend & Signal Detection Indicator Advanced Heikin Ashi Visualization with Intelligent Signal System for Manual & Automated Trading Final Price: $149 ---------> Price goes up $10 after every 10 sales . Limited slots available — act fast . Overview Crystal Heikin Ashi Signals is a professional-grade MetaTrader 5 indicator that combines pure Heikin Ashi candle visualization with an advanced momentum-shift detection system. Designed for both manual traders
Smart Stop Indicator – チャート上で実現するインテリジェントなストップロス精度 概要 Smart Stop Indicator は、ストップロスを勘や感情ではなく、明確で体系的に設定したいトレーダーのために設計されています。本ツールは、クラシックなプライスアクション(高値更新・安値切り下げ)と最新のブレイクアウト認識ロジックを組み合わせ、次に来るべき論理的なストップレベルを正確に特定します。トレンド相場、レンジ、急速なブレイクアウト局面のいずれであっても、最適な SL ゾーンとその状態(“new”、“broken”、“valid”)をチャート上に直接表示します。さらに今回、SL 距離の %ADR 表示も新たに追加されています。 主な特徴 マーケット構造に基づく自動ストップ配置 • 市場構造とリアルタイムの値動きに基づき、意味のあるストップロスレベルを自動検出します。 スマートなブレイクアウト感知 • 急激な方向転換やブレイクアウトにも柔軟に対応し、早すぎるストップ調整を避けます。 SL %ADR の表示 • ストップロスまでの距離を ADR(Averag
Gann Made Easy   は、ミスター・ギャンの理論を使用した取引の最良の原則に基づいた、プロフェッショナルで使いやすい外国為替取引システムです。 W・D・ガン。このインジケーターは、ストップロスとテイクプロフィットレベルを含む正確な買いと売りのシグナルを提供します。 PUSH通知を利用して外出先でも取引可能です。 ご購入後、取引方法の説明と優れた追加インジケーターを無料で入手するには、私にご連絡ください! おそらく、ギャンの取引手法についてはすでに何度も聞いたことがあるでしょう。通常、ギャンの理論は初心者のトレーダーだけでなく、すでにある程度の取引経験がある人にとっても非常に複雑なものです。なぜなら、ギャンの取引手法は理論的にはそれほど簡単に適用できるものではないからです。私はその知識を磨き、最良の原則を私の外国為替インジケーターに組み込むために数年を費やしました。 このインジケーターは非常に簡単に適用できます。必要なのは、それをチャートに添付し、簡単な取引推奨事項に従うだけです。このインジケーターは常に市場分析の仕事を行い、取引の機会を探します。適切なエントリーポイントを検
作者のその他のプロダクト
1. Overview The Stoch Quad Rotation Signal is an advanced technical analysis tool for MetaTrader 5. It integrates four independent stochastic oscillators with multi-timeframe (MTF) analysis to identify high-probability trading opportunities based on momentum alignment and exhaustion. 2. Core Strategy The system identifies reversals by monitoring stochastic convergence across four periods (9, 14, 40, and 60). It categorizes opportunities into two signal types: Regular Signals: Triggered when the
Accuracy M1 Scalper MT5 v3 Professional Scalping Indicator for MetaTrader 5 General Description Accuracy M1 Scalper MT5 is an advanced technical indicator specifically designed for scalping traders on the one-minute (M1) timeframe. This professional tool combines multiple technical analysis systems to identify high-probability trading opportunities in real-time. The system utilizes a multi-filter approach integrating optimized Exponential Moving Averages (EMA), confirmation oscillators, Multi
Professional Trading System Optimized for Brent Crude Oil Alpha Brent Strategy Tools is a comprehensive technical analysis indicator specifically designed and optimized for trading Brent Crude Oil. This advanced system combines multiple proven trading methodologies, including Smart Money Concepts (SMC), Volume Spread Analysis (VSA), Multi-Timeframe Analysis, and the powerful Kurisko 4-Stochastic System, to provide high-probability trading signals. Key Features 1. Brent-Specific Optimization Vol
# Simple Fibo MT5 - Professional Fibonacci Indicator A lightweight and efficient Fibonacci retracement indicator designed for professional traders who need clean, automatic technical analysis without chart clutter. This indicator automatically identifies swing highs and lows, draws Fibonacci levels, detects key Support/Resistance zones, and displays a real-time candle countdown timer. Perfect for day traders, swing traders, and scalpers who rely on Fibonacci retracements and key price levels f
FREE
SMC Liquidity MAX MT5 is an advanced Smart Money Concepts (SMC) indicator designed for intraday and swing traders seeking a clear and structured market reading. It integrates the key components of the institutional approach—structure, liquidity, and volume—into a single panel with real-time, optimized visualization. Core Features Market Structure: Automatic identification of BOS (Break of Structure) and CHoCH (Change of Character). Imbalance Zones: Fair Value Gaps (FVG) with automatic mitigatio
"While our free indicators provide a solid foundation, our paid products offer advanced neural filtering and automated risk management features that help you scale your trading consistency. Upgrade your edge today by visiting our specialized catalog for professional-grade EAs and indicators." What is this indicator? This Basic Support and Resistance Indicator -Free-   is designed to help traders automatically identify key market levels, such as supports and resistances, across multiple symbols
FREE
Volume Structure Nexus - SMC Volume and Structure Analysis Description: Understand what's going on "behind the chart." Volume Structure Nexus is an advanced tool for traders who trade based on Real Volume and Smart Money Concepts (SMC). What you'll get with this tool: Tick Volume Metrics: Identify where institutional liquidity is injected. Order Block Detection: Automatically visualizes the areas where institutions leave their pending orders. Break of Structure (BOS): Automatic identification
FREE
RangePulse ORB Expert Advisor RangePulse ORB is a high-performance institutional EA designed to trade Open Range Breakouts on indices with precision and discipline. Its architecture integrates quantitative filters, advanced risk management, and an AI‑ready decision module to maximize entry quality under real market conditions. 1. Core Strategy (ORB) The system core relies on a methodical execution of breakouts: Range Calculation: Defines the day's initial range and executes the breakout with co
Product Concept This indicator is designed to identify and confirm the strength of a prevailing trend by combining momentum analysis with statistical price deviation. It serves as a comprehensive filter to distinguish between high-probability trend continuations and market exhaustion phases. Key Technical Features Adaptive Smoothing: Uses an advanced mathematical algorithm to reduce lag without sacrificing signal accuracy. Multi-Filter Logic: Cross-references multiple time-based momentum calcul
FREE
Are you tired of guessing market direction? Upgrade your trading desk with Trinity Suite v3.0 , the all-in-one institutional dashboard that combines Market Structure, Trend Intelligence, and Momentum validation into a single, non-repainting tool. Trinity Suite is not just an indicator; it is a complete trading system designed for Scalpers, Day Traders, and Swing Traders who demand precision.  KEY FEATURES (The 3 Pillars): 1. Market Architect (Structure): Automatically identifies critical turning
APEX ARROWS v4.0 - Professional Trading Signals Indicator Overview APEX ARROWS is a professional-grade technical indicator developed for MetaTrader 5. This system integrates multiple analytical methodologies to identify high-probability market opportunities. Built on a non-repainting architecture, it utilizes a sophisticated multi-layered approach—combining Moving Averages, RSI momentum analysis, and ATR volatility filtering—to generate precise Buy and Sell signals. This tool optimizes decision
Swing Sentinel EA MT5 Swing Sentinel EA is an intelligent Expert Advisor designed to operate in trends with strategic pullbacks. This system uses advanced technical analysis to identify entry opportunities in major trends with professional risk management. Key Features Professional Strategy - Trend following with intelligent pullbacks - D1 timeframe specific optimization - Integrated multi-timeframe analysis Multi-Layer Validation System - Multiple confirmation filters - Institutional analy
Professional Gold Specialist Indicator (XAUUSD) with Modern Dashboard, Multi-Timeframe Analysis, and Signal Confidence System XAUUSD Gold Master Indicator v3.10 is an advanced technical tool specifically engineered for Gold trading. It is designed for professional and semi-professional traders seeking filtered signals, clear market context, and consistent risk management based on real-time volatility. The indicator combines: Trend Structure: via Moving Averages. Momentum: RSI, MACD, and Stocha
GoldMiner EA Pro MT5 - Advanced Neural Trend Trading for XAUUSD SUMMARY Unlock the power of automated gold trading with GoldMiner EA Pro, a high-precision Expert Advisor specifically designed for the unique volatility of XAUUSD. Unlike generic bots, GoldMiner uses a proprietary confluence engine that combines institutional trend following with real-time volume validation to capture high-probability moves. WHY GOLDMINER EA PRO? Precision Entry Engine: Uses multi-level analysis (EMA, RSI, MACD)
SQUEEZE MOMENTUM FORCE MT5 v2.0 Professional Trading Indicator Overview Squeeze Momentum Force is an advanced technical analysis indicator designed for MetaTrader 5. It combines volatility squeeze detection with momentum analysis to identify high-probability trading opportunities. Based on John Carter's original concept, this enhanced version incorporates: Multi-Timeframe (MTF) analysis. Divergence detection. Volume weighting. Modern user interface for quick market interpretation. The indicato
EUR/USD PRO — Institutional Composite Indicator A professional-grade indicator optimized specifically for EUR/USD, integrating institutional analysis concepts into a single tool. This system combines DXY MTF analysis, session-based VWAP, ADR/ATR metrics, market structure (BOS/CHOCH), SMC (FVG/OB), cross-asset correlations, and a confluence panel with a floating signal. It features a Neumorphic UI with movable panels, pip-calculated spread display, and structured logging. Designed for universal
QuantFusion BTC Pro v4.0: Professional Bitcoin Trading Indicator Overview QuantFusion BTC Pro v4.0 is a professional-grade, multi-dimensional trading indicator optimized for Bitcoin/USD markets. By integrating advanced technical analysis, smart money concepts, and intelligent signal filtering, the indicator is designed to deliver high-probability trading signals. Its Multi-Category Alignment System requires confirmation from independent technical categories to validate entries and minimize fal
PRECISIONFLOW EURUSD SCALPER  is an EXPERT ADVISOR (EA) designed for the METATRADER 5 platform. It operates fully automatically and integrates an advanced risk management system with adaptive filters. The system allows for high customization, enabling users to adjust operations according to their risk tolerance, execution style, and specific broker conditions. TRADING LOGIC AND STRATEGY This Expert Advisor identifies buy and sell opportunities by combining the following technical elements: STRU
**Risk Guard Dashboard MT5 (EA) – Scanner + Risk Manager + Execution Panel** Risk Guard Dashboard MT5 is a professional assistant for MetaTrader 5 that integrates into a single panel: a multi-timeframe scanner, Prop Firm-style risk control, performance statistics, and an execution panel. Designed with institutional aesthetics, high readability, and optimized performance for monitoring multiple symbols in real-time. **Main Features** • **Multi-symbol and Multi-timeframe Scanner:** simultaneou
ChartTrade Commander PRO is the ultimate solution for traders seeking total control over their trades with an intuitive visual interface, real-time visual P&L feedback, and institutional-grade features. Main Features New in v1.02: Real-Time Visual P&L Feedback Dynamic panel border: The panel border instantly changes color based on your P&L. Pastel Green: When in profit (any positive amount). Red/Pink: When in loss (any negative amount). Light Gray: When no positions are open or P&L = 0. Immediat
フィルタ:
レビューなし
レビューに返信