Simple Delta

Simple Delta – クライアント向け説明

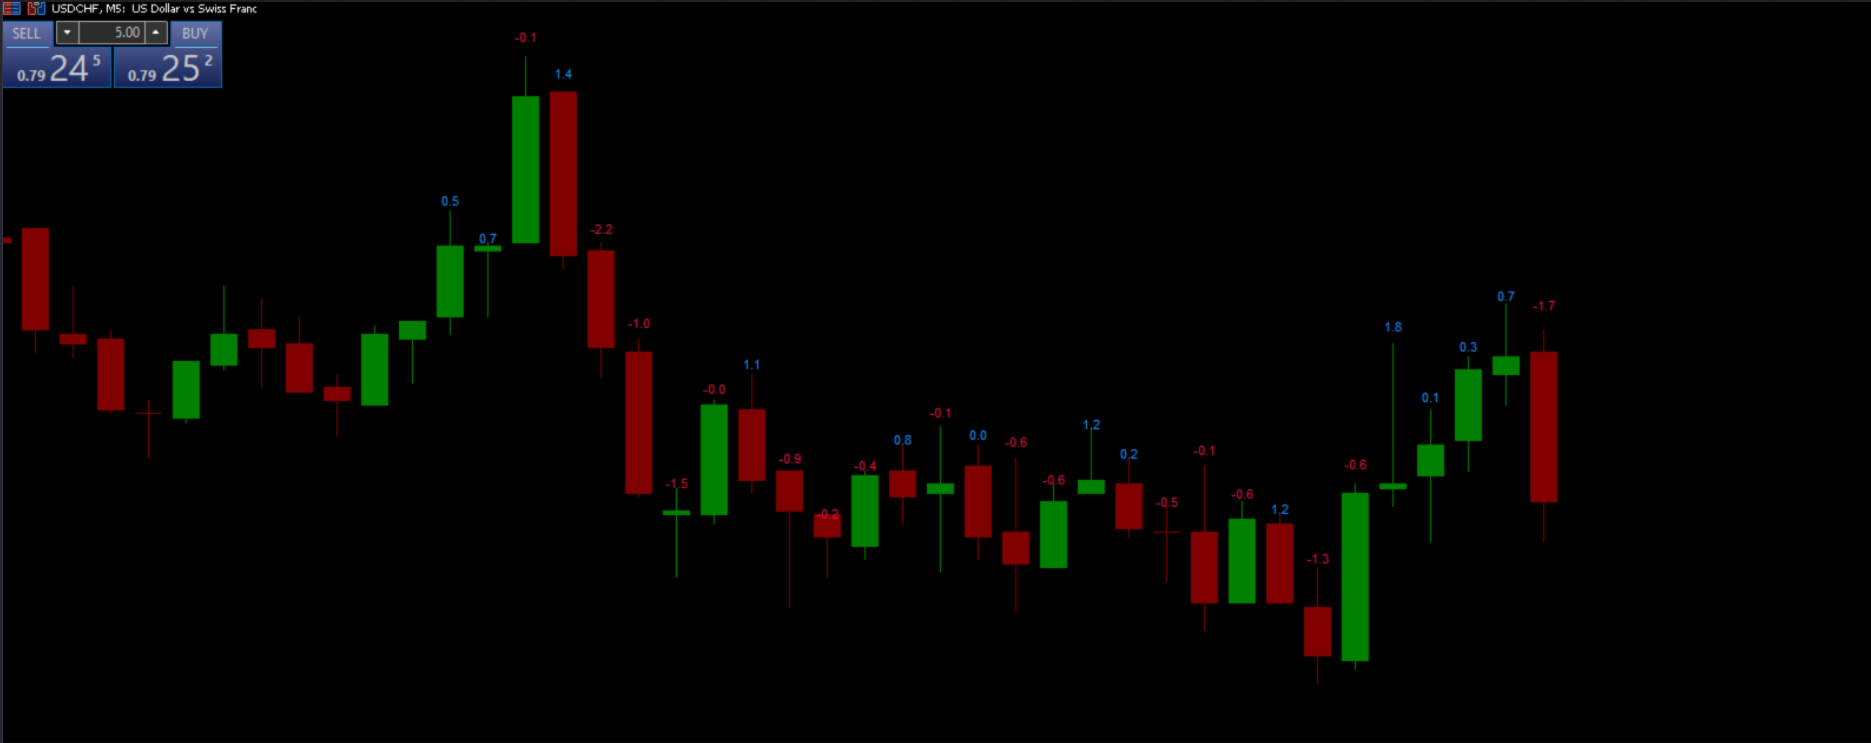
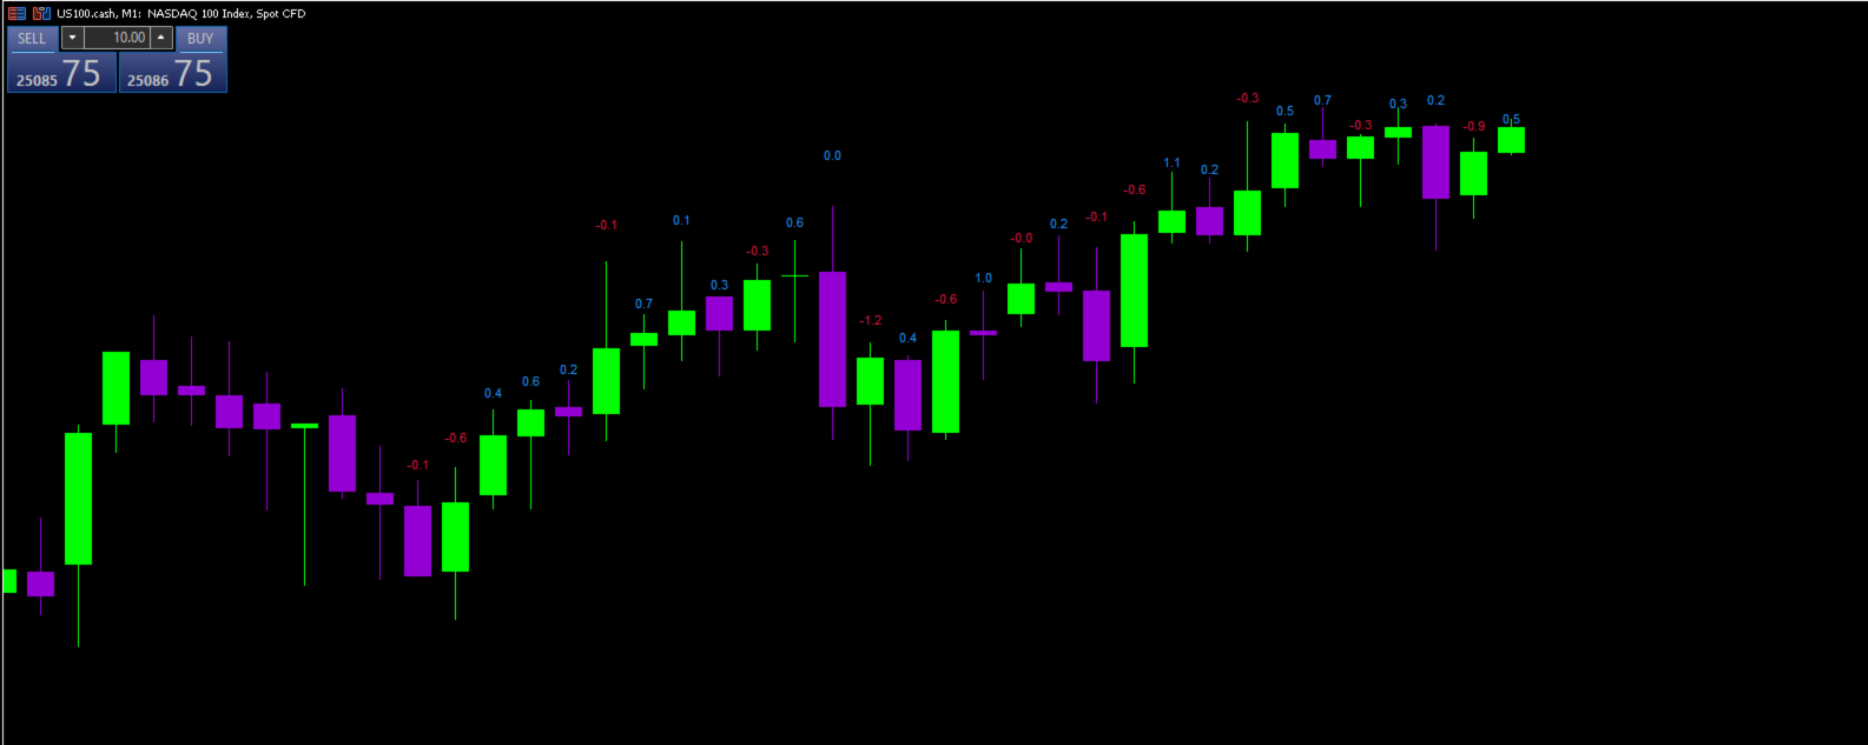
Simple Delta は、MetaTrader 5 用のクリーンで効率的なボリュームデルタ指標で、各ローソク足の上に正規化された買いと売りの圧力を表示します。

提供内容

このインジケーターはリアルタイムのティックデータを分析してデルタ(買いの出来高 − 売りの出来高)を計算し、各ローソク足の上に単一の正規化値(-10 から +10)を表示します。正の値は買いの優勢を示し(選択した買い色で表示)、負の値は売り圧力を示します(選択した売り色で表示)。

主な特徴

  • 即座に視覚的に分かる:ローソク足ごとに1つの数値 — 無駄な情報なし、必要なデータのみ

  • 6種類のプロフェッショナルカラーテーマ + 完全にカスタマイズ可能な色

  • 現在のローソク足は2秒ごとにリアルタイム更新

  • グラフレイアウトに合わせてテキスト位置を調整可能

  • M5 と M15 の時間足に最適化

複雑なインジケーターでチャートを混雑させずに、クリーンで集中できるオーダーフロー分析を求めるトレーダーに最適です。


おすすめのプロダクト
高度市場マイクロストラクチャー分析インジケーター 本インジケーターは、価格アクションを極めて細かいレベルで分析し、大きな値動きが起こる前に隠れた不均衡を検出します。従来の「価格だけ」を見るインジケーターとは異なり、 StructureFlow は以下の3つの重要な次元を分析します。 コア分析 ローソク足マイクロストラクチャー ヒゲ/実体の比率分析 実体のレンジ内での位置 拡張/収縮の検出 内部ボラティリティ異常 包み足パターン認識 マーケットテンポ 価格速度の測定 マイクロムーブの加速度 テンポ対比の検出(先行シグナル) 反転確率 パターンクラスタリングアルゴリズム 過去データとの類似度マッチング 加速/拒否の確率 カラーコードシステム ゾーン 色 意味 +50 ~ +100 ライム 強い強気の不均衡 +20 ~ +50 ミディアムシーグリーン 中程度の強気 +5 ~ +20 ダークシーグリーン 弱い強気 -5 ~ +5 グレー 中立 -20 ~ -5 インディアンレッド 弱い弱気 -50 ~ -20 オレンジレッド 中程度の弱気 -100 ~ -50 レッド 強い弱気の不均衡 背景ゾ
Trend Shift is a very interesting trend indicator. The Trend Shift indicator helps you identify either a new or existing trend. One of the advantages of the indicator is that it quickly adjusts and reacts to various chart changes. Of course, this depends on the settings. The larger it is, the smoother the wave the trend line will be. The shorter the period, the more market noise will be taken into account when creating the indicator. The goal that was pursued during its creation is to obtain si
This indicator is used to compare the relative strength of the trade on the chart against the other two selected symbols. By comparing the price movement of each traded variety based on the same base day, three trend lines of different directions can be seen, reflecting the strong and weak relationship between the three different traded varieties, so that we can have a clearer understanding of the market trend. For example, you can apply this indicator on a EurUSD chart and compare it with curre
In the dynamic world of financial markets, staying ahead of the curve is paramount. Traders and investors require sophisticated tools to analyze market trends, make informed decisions, and optimize their strategies. Introducing the Moving Average of Accumulation/Distribution (MAAD) Indicator – a powerful tool designed to provide insightful signals for navigating the complexities of the financial landscape. Key Features: Precision in Trend Analysis: The MAAD Indicator employs a moving average met
TrendFollower (The Swiss Army Knife for Trends) Forget standard indicators. Discover TrendFollower – 5 strategies in one! Tired of indicators that show a buy signal when the market is long past its peak? Your moving averages are so laggy that they show last Tuesday's trend? Let's get this straightened out. I present to you TrendFollower – a powerful, modular framework (Institution-Grade) that analyzes market structure from five different perspectives. Whether you're a patient sw
The Bull and Bear Power indicators identify whether the buyers or sellers in the market have the power, and as such lead to price breakout in the respective directions. Bulls Power   vs.   Bears Power   is a unique tool that displays on each candle the balance between the   bears   (sellers) and the   bulls   (buyers).   This particular indicator will be especially very effective when the narrow histogram and the wide histogram reside on the same side (above or under the Zero line)
GDS Renko Shadow — Hidden Momentum Engine GDS Renko Shadow is a next-generation Renko visualization tool designed to reveal what standard price charts cannot show: the hidden momentum, pressure, traps, exhaustion and force beneath every Renko brick. Most indicators show price movement after it has already happened. Shadow focuses on the invisible pressure behind the movement. It transforms a Renko chart into a cinematic market intelligence view, where every brick receives a dynamic shadow struc
FREE
Description: The Spike Sniper Crash Market Indicator is a sophisticated tool designed to identify and navigate volatile market conditions, often associated with sudden price spikes and market crashes. Leveraging advanced algorithms and technical analysis, this indicator serves as a vigilant guardian, alerting traders to potential market disruptions and providing actionable insights to mitigate risks and capitalize on opportunities. Key Features: Precision Spike Detection: The indicator employs c
Universal Soul Reaper is an atmospheric market-flow oscillator designed to interpret price behavior as a cycle of spiritual energy. Instead of reacting to raw price alone, it visualizes the state of the market’s soul —revealing when momentum is awakening, stabilizing, or fading. The indicator operates in a separate window and presents three interwoven entities: the Ectoplasmic Veil , the Spirit Boundary , and the Soul Core . Together, they form a living framework that helps traders sense pressu
This indicator is based on a classic Moving Average indicator. Moving averages help us to first define the trend and second, to recognize changes in the trend. Multi TimeFrame indicator MTF-MA shows MA data from the 4 timeframes by your choice. By default this indicator has external parameters: TF1 = 1; TimeFrame2b = true; TF2 = 5; TimeFrame3b = true; TF3 = 15; TimeFrame4b = true; TF4 = 60; InpPSARStep = 0.02; InpPSARMaximum = 0.2; You can change TF1-TF4 in the next limits: TF1 from M1 (1) to H4
Silver Zebra Trading System
AL MOOSAWI ABDULLAH JAFFER BAQER
Silver Zebra Trading System - Uncover Market Momentum Unlock a powerful new way to visualize market trends and momentum with the Silver Zebra Trading System. This unique MetaTrader 5 indicator is designed to give you a clear and immediate understanding of market dynamics, helping you make more informed trading decisions. For just $30, you can add this indispensable tool to your trading arsenal. What is the Silver Zebra Trading System? The Silver Zebra Trading System is a sophisticated indicator
Every indicator has its advantages and disadvantages. Trending ones show good signals during a trend, but lag during a flat. Flat ones thrive in the flat, but die off as soon as a trend comes. All this would not be a problem, if it was easy to predict when a flat changes to a trend and when a trend changes to a flat, but in practice it is an extremely serious task. What if you develop such an algorithm, which could eliminate an indicator's flaws and enhance its strengths? What if such an algorit
This is a highly accurate spike detector especially on higher time frame. There are a lot of Settings to adjust to your strategy. It uses a highly secret algorith that aloows this spike detectot to pick up signals on most time frame. This indicator will pay itself off in one week. If you playing on onM1 make sure you stay beow the 20MA and 60MA, once you cross the 200 MA you should close your trade. More info coming soon
Basic information. To perform its work, the indicator takes data on volumes from a lower timeframe, builds Market Profiles for a higher timeframe and a histogram for the current timeframe. The indicator starts in several stages. In this case, messages like: "Build Source & Target TF. Step: …" are output to the log. The process can be accelerated by changing the input parameter Milliseconds between steps - the initialization speed. The final value of this parameter is always individual and is set
• Please test the product in the Strategy Tester before purchasing to understand how it works. • If you face any issues, contact me via private message—I’m always available to help. • After purchase, send me a screenshot of your order to receive a   FREE EA   as a gift. Dual Confirmation PMAX-Supertrend Indicator: The Ultimate Trading Edge The Dual Confirmation PMAX-Supertrend Indicator represents a significant advancement in technical analysis tools for serious traders. This premium indicator
MT4 Version Elliot Wave Oscillator MT5 Elliot Wave Oscillator MT5 is an indicator designed to support Elliot Wave counts. The default settings help filtering out the noise in the market allowing a clear perception for the waves counts in differnt timeframes. Elliot Wave Oscillator high customization level allows the you to optimize this indicator to your personal preferences. Shorter Periods and faster reactive MAs will provide more infomation but will require a higher level of experience for a
RSI Indicator with Bollinger Bands: Maximize Your Win Rate with Precision and Advanced Trading Strategies Take your trading to the next level with the RSI Indicator combined with Bollinger Bands. Customize the RSI period, band moving average, and deviation to tailor the indicator to your unique strategies. Upon request, we also offer the possibility to customize or create bespoke indicators to best meet your trading needs.
The indicator - "ATR Line" determines the current trend and gives signals to buy (green arrow to the top) or sell (red arrow to the bottom). The indicator calculation is based on the deviation of the average price of the instrument from its average true range - ATR. The moving average of prices is used to reduce "market noise". If the main line of the indicator - "ATR Line" is lower the instrument price chart, then the market is in a "bullish" trend. If the main line of the indicator is higher t
KDJ Index 4   交易实用必备工具指标 波浪自动计算指标,通道趋势交易 完美的趋势-波浪自动计算通道计算 , MT4版本 完美的趋势-波浪自动计算通道计算 , MT5版本 本地跟单复制交易 Easy And Fast Copy , MT4版本 Easy And Fast Copy , MT5版本 本地跟单复制交易 模拟试用 Easy And Fast Copy , MT4 模拟账号运行 Easy And Fast Copy , MT5 模拟账号运行 "Cooperative QQ:556024  "  "Cooperation wechat:556024"  "Cooperative email:556024@qq.com" 强烈推荐趋势指标, 波浪的标准自动计算   和   波浪的标准自动计算MT5版本     KDJ指标又叫 随机指标 ,是一种相当新颖、实用的技术分析指标,它起先用于期货市场的分析,后被广泛用于股市的中短期趋势分析,是期货和股票市场上最常用的技术分析工具。 随机指标KDJ一般是用于股票分析的统计体系,根据统计学原理,通过一个特定的周期(常为9日、9周等)
Brandon Angelo Flag Pattern — how it works This indicator automatically detects classic bull and bear flag chart patterns in real time. The detection happens in three stages for each bar. First it looks for a flagpole — a sharp, strong directional move over a configurable number of bars ( FlagpoleBars , default 5) that must exceed a minimum percentage size ( FlagpoleMinPct ). For a bullish flag the pole must close net higher than it opened; for a bearish flag, net lower. Second it identifies th
CurvedSmoothChannel_Enhanced - 強化された価格チャネルインジケーター **CurvedSmoothChannel_Enhanced** は、MetaTrader 5 向けに設計された、強力で視覚的に魅力的な価格チャネルインジケーターです。トレンド、潜在的な反転、主要な価格レベルを正確に特定するのに役立ちます。この強化版は、ハル移動平均(HMA)とジョン・エーラーズ氏のスーパースムーズフィルターの機能を組み合わせ、複数の時間枠にわたる市場状況に合わせて調整する、動的で適応性の高いチャネルを構築します。 #### 主な機能: - **スムーズで適応性の高いミドルライン:** このインジケーターの中核となるのは、HMA に基づくスーパースムーズラインです。歪みを最小限に抑え、価格トレンドに忠実に追従します。 - **多層チャネル構造:** 3種類のチャネルラインを表示します。 - **外側のライン(タイト、黄色):** メインチ​​ャネルの境界を表し、トレンドの方向とブレイクアウトの可能性を判断するのに役立ちます。 - **内側の線(ややタイト、赤と緑):*
Anchored VWAP Channel Bands
Agustinus Biotamalo Lumbantoruan
Point and Plot:  The Anchored VWAP with Channel Bands tool is designed for traders of all levels, from beginners to seasoned professionals. Point to the price level you want to anchor to, plot the horizontal line, and watch as this versatile tool transforms your trading approach. User-Friendly Interface : Navigate the tool effortlessly with a user-friendly interface that ensures you never miss a crucial detail. Real-Time Analysis : Make informed decisions in real time with dynamic data that upda
Based on the Extreme Trend Indicator on Trading View converted for MT5. Usage of the Indicator is free, but if you want the source code, you can purchase the source code by messaging me. Extreme Trend is an indicator that identifies when a new trend is forming and creates a trading signal. This indicator can be used for many markets, forex, gold etc. If you have any inquiries or want to create an EA using this indicator, you can message me.
FREE
• Please test the product in the Strategy Tester before purchasing to understand how it works. • If you face any issues, contact me via private message—I’m always available to help. • After purchase, send me a screenshot of your order to receive a   FREE EA   as a gift. Welcome to the Visual Envelope Trend Flow Indicator! This tool is not optimized and has been crafted specifically for you to explore, test, and fine-tune according to your unique trading strategy. It offers flexibility and a pow
Fractal Advanced - displays Fractal and Alligator indicators on the price chart. Has wide options for settings and customization. It is also equipped with alerts and a hotkey system. Manual (Be sure to read before purchasing) | Version for MT4 Advantages 1. The indicator does not fill the entire chart with fractals, but allows you to display only relevant signals. 2. The number of fractals is adjusted by scrolling the mouse while holding down the Shift key. 3. Instantly show/hide the Alligator
チャート上の 始値、高値、安値、終値 レベルの 可視化 現在の ものだけでなく、 任意の 時間枠を 選択 できます。 計算 される バーの オフセット は 調整 可能 です: 現在 (フローティング) バー、 または 設定 された 数の 過去 バー。 多機能ユーティリティ : 66以上の機能を含む  |   質問がある場合は連絡してください   |    MT4バージョン インジケーターの設定で以下を設定できます: 計算バーの オフセット :0 = 現在のバー、1 = 前のバー、2 = 2バー前... " 複数のバーを含める "オプション: もし > 0: いくつかの バーが 組み合わされ、 最高値 と 最安値 が 決定されます。 計算される 時間枠 。 各レベル(OHLC)は 個別に有効/無効  にできます。 ラインの 可視化 :色、スタイル、サイズ、背景オプション。 追加 情報: 無効に可能; ライン価格のみ; ライン情報のみ; 両方:情報 + 価格; フォント サイズとスタイル('追加情報'が有効な場合)。 プログラムファイルは" Indicators "ディレクトリに配置する
SMC Guardian
Mohammed Mamdouh Abdel Fattah Mohammed El Sayed
5 (2)
GUARDIAN: The Ultimate Trend & Security Indicator GUARDIAN is a sophisticated technical analysis tool designed for traders who prioritize precision and capital preservation. This indicator acts as a vigilant protector of your trades, filtering market noise and identifying high-probability trend reversals with institutional-grade accuracy. Core Features: Adaptive Trend Detection: Utilizes advanced algorithms to detect market shifts before they become obvious. Smart Risk Management: Built-in signa
FREE
**SPECIAL LAUNCH PRICING:** **REGULAR PRICE:** ~~$200~~ **PROMO LAUNCH PRICE:** **$100** **YOU SAVE:** $100 (50% OFF) **PRICE INCREASE WILL INCREASE EVERY 10 SALE :** *$100 increases with every sale!* --- Smart Boxes Indicator: Multi‑Session Breakout, Wick Rejection & Smart Signal System Smart Boxes  is a professional‑grade market structure indicator engineered for traders who rely on precision, session timing, and clean intraday levels. It automatically maps the Opening Range, Yeste
Elite Harmony Signals Pro Panoramica Elite Harmony Signals è un indicatore sofisticato di analisi tecnica che visualizza rettangoli dinamici che forniscono zone di trading chiare e segnali di conferma per decisioni migliorate. Caratteristiche Principali Zone Rettangolo Dinamiche Estensione in Tempo Reale : I rettangoli si estendono automaticamente all'azione corrente del prezzo Chiusura Intelligente : I rettangoli si chiudono solo quando appaiono segnali opposti Conferma Visiva : Zone di trading
Volume Delta MT5
Mariusz Franciszek Szczepanczyk
ボリュームデルタMT5このインジケーターは、MetaTrader 5 用のプロフェッショナルなオーダーフローインジケーターで、ボリュームの不均衡ロジックを使用して、メインチャートウィンドウに買い圧力と売り圧力を直接視覚化するように設計されています。このインジケーターは、ローソク足の構造と利用可能なティックボリュームまたは実ボリュームに基づいて、積極的な買い圧力と売り圧力の差としてデルタを計算し、市場の支配力を明確に表示します。 このインジケーターは、FX、指数、商品、暗号通貨、株式など、あらゆる通貨ペアと時間足に対応しています。ネッティング口座やヘッジ口座にも完全対応しており、ライブ口座とデモ口座の両方で動作し、CPUリソースに過負荷をかけることなく安定したパフォーマンスを発揮するように最適化されています。すべての計算は効率的で、必要な期間のみで実行されるため、低スペックのVPS環境でもスムーズな動作を保証します。 Volume Deltaは、市場の圧力に応じてチャート上のローソク足に色を付けます。DeltaThresholdパラメータを超える強い買い圧力は、BuyVolumeCol
このプロダクトを購入した人は以下も購入しています
SuperScalp Pro
Van Minh Nguyen
4.63 (24)
SuperScalp Pro – 高度なマルチフィルタースキャルピングインジケーターシステム SuperScalp Pro は、クラシックな Supertrend と複数のインテリジェント確認フィルターを組み合わせた高度なスキャルピングインジケーターです。M1 から H4 まで複数の時間足で効率的に動作し、XAUUSD、BTCUSD、主要 Forex 通貨ペア向けに最適化されています。 このインジケーターは明確な Buy / Sell シグナルを提供し、ATR に基づいてエントリー価格、Stop Loss、Take Profit を自動計算します。Fibonacci Take Profit 機能により、重要な価格帯で早期決済し、到達時に通知を送信します。 初期設定では Fibonacci Take Profit が有効化されており、より安定した取引体験を重視しています。チャートに適用するだけですぐ利用可能です。上級者向けに、すべてのパラメータは自由にカスタマイズできます。 追加の設定ガイド、推奨セットファイル、および最適化された設定はこちらでご覧いただけます: https://www.
このインジケーターを購入された方には、以下の特典を 無料 で提供しています: 各トレードを自動で管理し、ストップロスとテイクプロフィットを設定し、戦略ルールに基づいてポジションを決済する補助ツール 「Bomber Utility」 様々な銘柄に合わせたインジケーターの設定ファイル(セットファイル) 「最小リスク」、「バランスリスク」、「待機戦略」 の3つのモードで使用できる Bomber Utility 用の設定ファイル このトレーディング戦略をすぐに導入・設定・開始できる ステップバイステップのビデオマニュアル ご注意: 上記の特典を受け取るには、MQL5のプライベートメッセージシステムを通じて販売者にご連絡ください。 オリジナルのカスタムインジケーター 「Divergence Bomber(ダイバージェンス・ボンバー)」 をご紹介します。これは、MACDのダイバージェンス(乖離)戦略に基づいた 「オールインワン」型のトレーディングシステム です。 このテクニカルインジケーターの主な目的は、価格とMACDインジケーターの間に発生するダイバージェンスを検出 し、将来の価格の動きを示す
SignalTech MT5 is an unique fully rule based trading system for EURUSD, USDCHF, USDJPY, AUDUSD, NZDUSD, EURJPY, AUDJPY, NZDJPY, CADJPY.  All the winning trades with chart setups are published on the comments page. 2026-05 3493 Pips (Until 05-21 NY Closed) 2026-04 2243 Pips 2026-03 2165 Pips 2026-02 2937 Pips 2026-01 2624 Pips 2025-12 1174 Pips It can generate signals with Buy/Sell Arrows and Pop-Up/Sound Alerts. Each signal has clear Entry and Stop Loss levels, which should be automatically flag
Entry In The Zone and SMC Multi Timeframe is a real-time 2-in-1 market analysis tool that combines market structure analysis and a No Repaint BUY / SELL signal system into a single indicator, built on Smart Money Concepts (SMC) — a widely adopted framework used by professional traders to understand market structure. This indicator helps you see the market more clearly, make decisions based on structure rather than guesswork, and focus on high-probability zones where price is more likely to react
Azimuth Pro
Ottaviano De Cicco
5 (7)
Azimuth Pro V2:MT5向けシンセティック・フラクタル構造分析と確認済みエントリー 概要 Azimuth Pro は Merkava Labs によるマルチレベルスイング構造インジケーターです。4つのネストされたスイングレイヤー、スイングアンカーVWAP、ABCパターン検出、3タイムフレーム構造フィルタリング、そして確定バーでの確認済みエントリー — 1つのチャートで、ミクロスイングからマクロサイクルまでを網羅するワークフロー。 これはブラインドシグナル製品ではありません。ロケーション、コンテキスト、タイミングを重視するトレーダーのための構造ファーストワークフローです。 V2発売記念オファー — Azimuth Pro V2をUSD 399で(次の100本)。最終価格:USD 499。 1. V2での変更点 シンセティック・マルチタイムフレームエンジン 上位タイムフレーム分析をMeridian Proと同じ独自のシンセティックアーキテクチャで一から再構築。よりクリーンなHTFコンテキスト、安定したライブ動作、従来のMTF同期問題なし。シンセティックエンジンは 固定比率タ
まず正直に言いましょう。 どんなインジケーターも、それ単体であなたを利益化させることはできません。もしそう言う人がいるなら、それは夢を売っているだけです。完璧な売買シグナル(矢印)を表示するインジケーターは、いくらでも“完璧に見せる”ことができます。正しい過去の区間を拡大して、勝ちトレードだけを切り取ればいいだけです。私たちはそれをしません。 SMC Intraday Formula はツールです。 市場構造を読み取り、最も高い確率の価格ゾーンを特定し、今この瞬間のスマートマネーの痕跡をシンプルな言葉で正確に示します。最終判断はあなたが行います。トレードを実行するのもあなたです。しかし今は「希望」ではなく「精度」でエントリーできます。 私たちはこのインジケーターを、ゴールド(XAUUSD)および主要FX通貨ペアで約3年間、日々のスキャルピングに使用してきました。M1、M5、M15、M30の主要ツールです。これは未来を予測しようとするのではなく、今まさに形成されている高確率セットアップを示し、その理由を説明します。 他のすべてのインジケーターと何が違うのか? ほとんどのトレーディングイ
Power Candles V3 - 自己最適化型強弱インジケーター Power Candles V3は 、通貨や銘柄の強さを、適用されたすべてのチャート上で実行可能なトレードプランに変換します。単にローソク足を色分けするだけでなく、バックグラウンドでリアルタイムの自動最適化を実行し、目の前の銘柄に対して最適なストップロス、テイクプロフィット、およびシグナルの閾値を提示します。ワンクリックで実取引に適用でき、エントリーポイント、ストップロス、テイクプロフィットのラインが正確な価格位置にチャート上に表示され、方向性を示すアラートがリアルタイムで発動します。 このツールは、Stein Investmentsのエコシステムの一部です。  18種類以上のツールをすべて閲覧し、AIを活用したセットアップの推奨事項を入手し、  https://stein.investments でコミュニティに参加しましょう クローズしたバーごとに3,000回以上のトレードシミュレーション。9つの強さの状態。2つの戦略を並行してテスト。勝率の高い設定をワンクリックで適用。 なぜこれが必要なのか ほとんどの強
トレンドキャッチャーインジケーター トレンドキャッチャーインジケーターは、開発者独自の適応型トレンド分析指標を組み合わせることで、市場価格の動きを分析します。短期的なノイズを除去し、根底にあるモメンタムの強さ、ボラティリティの拡大、価格構造の挙動に焦点を当てることで、真の市場方向性を特定します。また、移動平均線、RSI、ボラティリティフィルターなどの平滑化およびトレンドフィルタリング機能を備えたカスタマイズ指標も使用します。 実際の運用状況のモニタリングやその他の製品については、こちらをご覧ください: https://www.mql5.com/en/users/mechanic/seller ご注意ください。私はTelegramでEAや設定を販売していません。詐欺です。すべての設定はブログで無料で公開しています。 重要!ご購入後すぐにご連絡ください。手順とボーナスをお送りします!
このインジケーターを購入すると、プロ仕様のトレードマネージャーを無料で差し上げます。 まず第一に、このトレーディングシステムがノンリペイント、ノンリドロー、ノンラグのインジケーターであることを強調する価値がある。これにより、手動取引とロボット取引の両方に理想的なものになっています。 オンラインコース、マニュアル、プリセットのダウンロード。 「スマートトレンドトレーディングシステム MT5」は、新規および経験豊富なトレーダー向けにカスタマイズされた包括的なトレーディングソリューションです。10以上のプレミアムインジケーターを組み合わせ、7つ以上の堅実なトレーディング戦略を備えており、多様な市場状況に対応する多目的な選択肢となっています。 トレンドフォロー戦略:トレンドを効果的に乗り越えるための正確なエントリーとストップロス管理を提供します。 リバーサル戦略:潜在的なトレンドの反転を特定し、トレーダーがレンジ相場を活用できるようにします。 スキャルピング戦略:高速で正確なデイトレードおよび短期取引のために設計されています。 安定性:すべてのインジケーターはノンリペイント、ノンリドロー、ノ
Gann Made Easy   は、ミスター・ギャンの理論を使用した取引の最良の原則に基づいた、プロフェッショナルで使いやすい外国為替取引システムです。 W・D・ガン。このインジケーターは、ストップロスとテイクプロフィットレベルを含む正確な買いと売りのシグナルを提供します。 PUSH通知を利用して外出先でも取引可能です。 ご購入後、取引方法の説明と優れた追加インジケーターを無料で入手するには、私にご連絡ください! おそらく、ギャンの取引手法についてはすでに何度も聞いたことがあるでしょう。通常、ギャンの理論は初心者のトレーダーだけでなく、すでにある程度の取引経験がある人にとっても非常に複雑なものです。なぜなら、ギャンの取引手法は理論的にはそれほど簡単に適用できるものではないからです。私はその知識を磨き、最良の原則を私の外国為替インジケーターに組み込むために数年を費やしました。 このインジケーターは非常に簡単に適用できます。必要なのは、それをチャートに添付し、簡単な取引推奨事項に従うだけです。このインジケーターは常に市場分析の仕事を行い、取引の機会を探します。適切なエントリーポイントを検
FX Trend NG:次世代マルチマーケット・トレンドインテリジェンス 概要 FX Trend NG は、複数の時間足に対応したプロフェッショナル向けトレンド分析およびマーケット監視ツールです。 市場全体の構造を数秒で把握することができます。 複数のチャートを切り替える必要はありません。どの銘柄がトレンド中なのか、どこでモメンタムが弱まっているのか、そしてどの時間足で強い整合性があるのかを瞬時に確認できます。 ローンチ特別オファー – FX Trend NG を $30(6ヶ月) または $80 永久ライセンス でご利用いただけます。 すでに Stein Investments のユーザーですか? -> メッセージを送信 して、プライベートグループへアクセスしてください。 セットアップや詳細情報が必要ですか? -> Stein Investments 公式ページ をご覧ください。 1. FX Trend NG が他と異なる理由 3ステート・トレンドロジック ― Buy と Sell だけではない • 多くのインジケーターは Buy または Sell の2状態のみを表示します。
ARIPoint
Temirlan Kdyrkhan
1 (1)
ARIPoint is a powerful trading companion designed to generate high-probability entry signals with dynamic TP/SL/DP levels based on volatility. Built-in performance tracking shows win/loss stats, PP1/PP2 hits, and success rates all updated live. Key Features: Buy/Sell signals with adaptive volatility bands Real-time TP/SL/DP levels based on ATR Built-in MA Filter with optional ATR/StdDev volatility Performance stats panel (Success, Profit/Loss, PP1/PP2) Alerts via popup, sound, push, or email Cu
まず第一に、この取引ツールはノンリペイント、ノンリドロー、ノンラグの指標であり、プロの取引に理想的ですことを強調する価値があります。 オンラインコース、ユーザーマニュアル、デモ。 スマートプライスアクションコンセプトインジケーターは、新米から経験豊富なトレーダーまで、非常 に強力なツールです。Inner Circle Trader AnalysisやSmart Money Concepts Trading Strategiesなど、20以上の有用な指標を1つに組み合わせています。このインジケーターはスマートマネーコンセプトに焦点を当て、大手機関の取引方法を提供し、彼らの動きを予測するのに役立ちます。 特に、流動性分析に優れており、機関がどのように取引しているかを理解しやすくしています。市場のトレンドを予測し、価格の動きを慎重に分析するのに優れています。機関の戦略とトレードを合わせることで、市場の動向についてより正確な予測ができます。このインジケーターは多目的であり、市場構造を分析し、重要な注文ブロックを特定し、さまざまなパターンを認識するのに優れています。 このインジケーター
トレンド スクリーナー インジケーターでトレンド取引の力を解き放ちます。ファジー ロジックと複数通貨システムを活用した究極のトレンド取引ソリューションです。 ファジー ロジックを活用した革新的なトレンド インジケーターである Trend Screener を使用して、トレンド取引を向上させます。 これは、13 を超えるプレミアム ツールと機能、および 3 つの取引戦略を組み合わせた強力なトレンド追跡インジケーターであり、Metatrader をトレンド アナライザーにする多用途の選択肢となります。 期間限定オファー : トレンド スクリーナー インジケーターは、わずか 65 ドルで生涯ご利用いただけます。 (元の価格 50$ ) (オファー延長) Trend Screener の 100% 非再描画精度の揺るぎない精度を体験して、取引の決定が過去の価格変動の影響を受けないようにしてください。 マルチタイムフレームおよびマルチ通貨機能の多用途性を解放し、比類のない自信を持って外国為替、商品、暗号通貨、インデックスの世界を取引できるようにします。 Trend Screener の包括的な戦
多くの矢印インジケーターは、シグナルだけを表示して、その後の判断をすべてトレーダーに任せてしまいます。KT Alpha Hunter Arrows は、完整なトレードプランをチャート上に提示します。 各シグナル矢印が表示されるたびに、エントリーライン、ストップロス、4つのテイクプロフィット水準、そして現在の銘柄と時間足が今トレードに値するかどうかを示すリアルタイムのエッジ判定が、すでに描画された状態で表示されます。付属の Trade Manager EA は、あなたが手動でエントリーした後の実行管理を担当し、相場が荒れて判断がぶれやすい場面でも規律あるトレードを保ちやすくします。リペイントなし。確定足シグナルのみ。Forex、ゴールド、指数、その他あなたが取引するあらゆる銘柄に対応します。 主な機能 リペイントしない買い矢印と売り矢印を、足の確定後にのみ表示。 各シグナルに、エントリーライン、構造的ストップロス、4つのテイクプロフィット水準を表示。 Edge Dashboard が、現在のチャートで買いセットアップと売りセットアップを別々に評価。 判定システム:No Edge、Mar
Market Structure Order Block Dashboard MT5 は、市場構造と主要な価格反応ゾーンをチャート上で直接読み取りたいトレーダー向けに設計された MT5 インジケーターです。BOS、ChoCH、オーダーブロック、Fair Value Gap (FVG)、流動性、Kill Zones、Volume Profile、そして素早い分析のためのコンパクトなダッシュボードを組み合わせています。 本インジケーターは、市場構造、ICT、Smart Money の概念を意思決定の枠組みとして使用するトレーダーを対象としています。トレンド継続、反転の可能性、価格の不均衡、流動性ターゲット、注目ゾーンをより構造的に特定する助けとなります。 購入者向けの付属リソース 購入後、MQL5 のプライベートメッセージにてご依頼いただくと、完全な PDF ユーザーガイドとパラメータ設定のヒントを提供いたします。MQL5 のプライベートメッセージによる直接的な技術サポート。 バージョン 1.20 では 2 つの重要な追加機能があります: Pending BOS / Pending Cho
ご紹介     Quantum Breakout PRO は 、ブレイクアウト ゾーンの取引方法を変革する画期的な MQL5 インジケーターです。 13年以上の取引経験を持つ経験豊富なトレーダーのチームによって開発されました。     クォンタム ブレイクアウト プロ   は、革新的でダイナミックなブレイクアウト ゾーン戦略により、あなたのトレーディングの旅を新たな高みに押し上げるように設計されています。 クォンタム ブレイクアウト インジケーターは、5 つの利益ターゲット ゾーンを備えたブレイクアウト ゾーン上のシグナル矢印と、ブレイクアウト ボックスに基づいたストップロスの提案を提供します。 初心者トレーダーにもプロのトレーダーにも適しています。 量子EAチャネル:       ここをクリック 重要!購入後、インストールマニュアルを受け取るためにプライベートメッセージを送ってください。 推奨事項: 時間枠: M15 通貨ペア: GBPJPY、EURJPY、USDJPY、NZDUSD、XAUUSD アカウントの種類: ECN、Raw、またはスプレッドが非常に低い R
GEM Signal Pro GEM Signal Pro は、MetaTrader 5 向けのトレンドフォロー型インジケーターです。より明確なシグナル、より整理されたトレードセットアップ、そして実用的なリスク管理をチャート上で確認したいトレーダーのために設計されています。 単純な矢印だけを表示するのではなく、GEM Signal Pro はトレード全体の考え方を、より見やすく分かりやすい形で表示します。条件が確認されると、インジケーターはエントリー価格、ストップロス、利確目標をチャート上に表示し、トレードセットアップをより効率的に確認できるようにします。 動作の仕組み このインジケーターは、まず内部ロジックに基づいて有効なシードシグナルを検出します。 確認条件が満たされると、GEM Signal Pro はチャート上に完全なセットアップを表示します。これにより、トレーダーはトレード構造をより明確に把握し、手作業による分析を減らすことができます。 チャート上のトレードレベル 確認済みシグナルに対して、GEM Signal Pro は以下を表示できます。 エントリー価格 ストップロス テ
FX Power: 通貨の強弱を分析して、より賢い取引を実現 概要 FX Power は主要通貨と金の実際の強弱をあらゆる市場状況で理解するための必須ツールです。強い通貨を買い、弱い通貨を売ることで、 FX Power は取引の意思決定を簡素化し、高い確率の取引機会を見出します。トレンドを追従する場合でも、極端なデルタ値を使用して反転を予測する場合でも、このツールはあなたの取引スタイルに完全に適応します。ただ取引するだけではなく、 FX Power で賢く取引をしましょう。 1. なぜ FX Power がトレーダーにとって非常に有益なのか 通貨と金のリアルタイム強弱分析 • FX Power は主要通貨と金の相対的な強弱を計算し、マーケットダイナミクスに関する明確な洞察を提供します。 • どの資産がリードしているか、または後れを取っているかを監視して、取引するペアを賢く選びましょう。 マルチタイムフレームの包括的なビュー • 短期、中期、長期のタイムフレームで通貨と金の強弱を追跡し、マーケットトレンドに基づいて取引戦略を調整できます。 • スキャルピングからスイングトレード
BTMM State Engine Pro is a MetaTrader 5 indicator for traders who use the Beat The Market Maker approach: Asian session context, kill zone timing, level progression, peak formation detection, and a multi-pair scanner from a single chart. It combines cycle state logic with a built-in scanner dashboard so you do not need the same tool on many charts at once. What it does Draws the Asian session range; session times can follow broker server offset or be set in inputs. Tracks level progression (L
OrderFlux | MetaTrader 5 用フットプリント・オーダーフロー バージョン 2.0 – アクティブトレーダー向けのリアルタイム Bid/Ask 可視化 OrderFlux は MT5 用のフットプリントおよびオーダーフローインジケーターです。価格がどこに動いたかだけでなく、その動きの中で何が起きているか(各価格レベルの Bid/Ask ボリューム、デルタ、インバランス、ボリューム分布)を表示します。 多くのチャートはローソク足の最終結果しか表示しません。OrderFlux はそこに至るまでの過程を表示します。ローソク足の形状だけでなく、市場参加者の動向を読み取りたい場合にまさに役立ちます。 Manual   -->   Klick ライブチャートにおいて、OrderFlux は主に次の3つの質問に答えます: 現在、どこで積極的な買いまたは売りの圧力が市場に参入しているか? どの価格レベルでボリュームが吸収、または拒否されているか? 現在の動きはセッションのコンテキスト(背景)にどう適合しているか? インターフェースで得られるもの メインチャートは、Canvas ベー
FX Levels: あらゆる市場における非常に高精度なサポート&レジスタンス 概要 通貨ペア、株式指数、個別銘柄やコモディティなど、どのような市場でも信頼できるサポートとレジスタンスを特定したいですか? FX Levels は伝統的な “Lighthouse” メソッドと先進的な動的アプローチを融合し、ほぼ汎用的な精度を実現します。ブローカーの実務経験を活かし、自動化されたデイリー更新とリアルタイム更新を組み合わせることで、 FX Levels は反転ポイントを見つけ、利益目標を設定し、自信をもってトレードを管理するための手助けをします。今すぐ試してみて、サポート/レジスタンス分析の正確性がどれほどトレードを向上させるかを実感してください! 1. FX Levels がトレーダーにとって非常に有用な理由 非常に正確なサポート&レジスタンスゾーン • FX Levels は異なるブローカー環境でもほぼ同一のゾーンを生成するよう設計されており、データフィードの差異や時刻設定のずれによる不一致を解消します。 • つまり、どのブローカーを利用していても一貫したレベルが得られるため、戦
Quantum TrendPulse を ご紹介します。これは、   SuperTrend   、   RSI   、および Stochastic のパワーを 1 つの包括的なインジケーターに組み合わせて、取引の可能性を最大限に引き出す究極の取引ツールです。精度と効率を求めるトレーダー向けに設計されたこのインジケーターは、市場のトレンド、勢いの変化、最適なエントリー ポイントとエグジット ポイントを自信を持って特定するのに役立ちます。 主な特徴: SuperTrend 統合: 現在の市場動向に簡単に追従し、収益性の波に乗ることができます。 RSI精度: 買われすぎと売られすぎのレベルを検出し、市場の反転のタイミングに最適で、SuperTrendのフィルターとして使用されます。 確率的精度: 確率的振動を活用して、変動の激しい市場で隠れたチャンスを見つけます。SuperTrend のフィルターとして使用されます。 マルチタイムフレーム分析:   M5 から H1 または H4 まで、さまざまなタイムフレームで市場を常に把握します。 カスタマイズ可能なアラート: カスタム取引条件が満たされ
まず第一に、この取引インジケーターは再描画されず、再描画されず、遅延しないことを強調する価値があります。これにより、手動取引とロボット取引の両方に理想的なものになります。 ユーザーマニュアル:設定、入力、戦略。 アトミックアナリストは、価格の強さとモメンタムを利用して市場でより良いエッジを見つけるためのPA価格アクションインジケーターです。ノイズや誤ったシグナルを除去し、取引ポテンシャルを高めるための高度なフィルターを備えています。複雑なインジケーターの複数のレイヤーを使用して、アトミックアナリストはチャートをスキャンし、複雑な数学的計算をシンプルなシグナルと色に変換します。これにより、どのような初心者トレーダーでも理解して使用し、一貫した取引の決定を行うことができます。 「アトミックアナリスト」は、新規および経験豊富なトレーダー向けにカスタマイズされた包括的な取引ソリューションです。プレミアムインジケーターとトップノッチの機能を1つの取引戦略に組み合わせ、すべてのタイプのトレーダーにとって汎用性のある選択肢にします。 デイリートレーディングとスキャルピング戦略:高速で正確なデイ
RelicusRoad Pro: 定量的市場オペレーティングシステム 【期間限定】無制限アクセス 70% OFF - 2,000人超のトレーダーと共に なぜ多くのトレーダーは「完璧な」インジケーターを使っても失敗するのでしょうか? それは、文脈を無視して 単一の概念 だけでトレードしているからです。文脈のないシグナルは単なるギャンブルです。勝ち続けるには、 根拠の重なり(コンフルエンス) が必要です。 RelicusRoad Proは単なる矢印インジケーターではありません。完全な 定量的市場エコシステム です。独自のボラティリティモデリングを用いて、価格が推移する「適正価値の道(Fair Value Road)」をマッピングし、ノイズと真の構造的ブレイクを判別します。 推測はやめましょう。機関投資家レベルの「ロード・ロジック」でトレードを。 コアエンジン:「Road」アルゴリズム システムの中心となる Road Algo は、市場環境にリアルタイムで適応するダイナミックなボラティリティチャネルです。 安全ライン(平衡点) と、価格が数学的に反転しやすい 拡張レベル を投影します。 Si
Trend Forecaster – Since 2023. The Trend Forecaster indicator utilizes a unique proprietary algorithm to determine entry points for a breakout trading strategy. The indicator identifies price clusters, analyzes price movement near levels, and provides a signal when the price breaks through a level. The Trend Forecaster indicator is suitable for all financial assets, including currencies (Forex), metals, stocks, indices, and cryptocurrencies. You can also adjust the indicator to work on any time
Meridian Pro
Ottaviano De Cicco
5 (2)
Meridian Pro 2.00:MT5向けプロ仕様マルチタイムフレーム・トレンドマトリクス Meridian Pro 2.00 は、MetaTrader 5 向けのプロ仕様の適応型トレンドマトリクスです。オリジナルの Meridian トレンドエンジン、クリーンなチャート ribbon、確定足ベースのシグナル矢印、8時間足 dashboard、Fuel momentum、weighted consensus、synthetic HTF processing、そしてチャート上に直接表示される上位足コンテキストラインを統合します。 目的はシンプルです。現在のトレンド、マルチタイムフレーム構造、強度、momentum、EA-ready 状態を、複数チャートに無関係なインジケータを重ねるのではなく、1つの整理された workflow で読むことです。 Meridian Pro の違い 1つの適応型エンジン - 同じ volatility-aware Meridian ロジックを M1 から W1 まで適用します。 Synthetic HTF architecture - 上位足行は下位足デ
Reversal Master for MT5 Reversal Master for MT5 は、MetaTrader 5 向けのノンリペイント型リバーサルインジケーターです。潜在的な市場の転換ポイントを検出し、各ヒストリカルシグナルの後に発生した最大の有利な値動きを表示することで、過去の類似した局面で価格がどのように動いたかをより深く理解するのに役立ちます。 MT5 版では、元の MT4 版 Reversal Master のおなじみの反転シグナルロジックを維持しつつ、ビジュアル面の強化、ヒストリカル統計、ポイントベースのサマリーパネルを追加しています。MetaTrader 5 がサポートするあらゆる銘柄・時間足で動作し、単体のリバーサルツールとしてはもちろん、既存ストラテジー内の追加フィルターや、Expert Advisor 用のシグナルソースとしても利用できます。 Key Features 潜在的なトレンド転換ポイントを自動検出。 ノンリペイントの矢印シグナル:バーが確定した後は位置が変わらず、消えません。 2 つの動作モード:Mode 1 Classic(従来型 MT4 ロジ
このダッシュボードは、選択されたシンボルの最新の利用可能なハーモニックパターンを表示するので、時間を節約し、より効率的に /   MT4バージョン 。 無料インジケーター:   Basic Harmonic Pattern インジケーター列 Symbol : 選択したシンボルが表示されます。 Trend :   強気または弱気 Pattern : パターンの種類(ガートレー、バタフライ、バット、カニ、サメ、サイファー、ABCD) Entry : エントリー価格 SL: ストップロス価格 TP1: 1回目の利食い価格 TP2: 2回目の利食い価格 TP3:   3回目の利食い価格 Current price :   現在値 Age (in bars):    最後に描画されたパターンの年齢 主な入力項目 Symbols:   "28 Major Currency Pairs "または "Selected Symbols "から選択。 Selected Symbols:   カンマで区切られた監視したいシンボル("EURUSD,GBPUSD,XAUUSD")。ブローカーがペアに接
Smart Structure Concepts MT5
Cristhian Alexander Gaibor Cuasquer
Smart Structure Concepts MT5 は MetaTrader 5 で最も完全な機関投資家向け SMC ツールキットです — 4言語の教育的ツールチップと、価格がゾーンに入った瞬間のライブプッシュアラートを備えています。 ほとんどの SMC インジケーターはボックスを描くだけで、あなたに推測を強いります。このインジケーターはチャート上で各シグナルを直接説明します。任意の BOS、CHoCH、Order Block、FVG、流動性レベルにマウスを合わせれば、その意味と次に何をすべきかが即座にわかります — 英語、スペイン語、ポルトガル語、フランス語で。 含まれる機能 — Internal & Swing BOS / CHoCH をリアルタイムで検出(リペイントなし) — Internal & Swing Order Blocks と自動ミティゲーション — 上昇・下降 Fair Value Gaps — Equal Highs & Lows(EQH / EQL)流動性マッピング — Premium / Discount / Equilibrium ゾーン —
作者のその他のプロダクト
Volume Profile Density V2.40 価格ごとの出来高分布を表示し、機関投資家が注目する価格帯を明らかにします。 時間軸ベースの出来高とは異なり、どこで取引量が集中したかを示します。 基本概念: 水平バー = 各価格の取引量 バーが長いほど出来高が多い 赤いゾーン = 主要なサポート/レジスタンス 主な用途: 実際のサポート・レジスタンスの特定 POC(コントロールポイント) の確認 バリューエリア(総出来高の70%) の定義 低出来高ゾーンをストップやターゲットに利用 カラーガイド: 青 = 低出来高(価格が素早く通過) 黄 = 中程度の出来高(バランスゾーン) 赤 = 高出来高(機関ゾーン) トレード戦略: 赤ゾーンでの反発買い VAHまたは赤ゾーンでの拒否売り 出来高を伴うPOCブレイクで参入 POCへの戻りでエントリー 青ゾーンを目標に設定 設定: 初心者: 1.0 / 100% / 1.0 スキャルピング: 0.5 / 200% / 0.5 スイング: 2.0 / 50% / 1.5 技術情報: バージョン: 2.40 プラットフォーム: MT5 対応資産
FREE
Iceblock Volume
Vincent Jose Proenca
5 (1)
短い説明: Iceblock — 高出来高だが価格変動が小さいクラスターを検出するMT4インジケーター(アイスバーグ様の挙動)。 TF: すべての時間足で動作(M1〜D1)。 通貨ペア: Forex、指数、ゴールド、CFDに対応。 設定項目: VolumeLookback – 平均出来高計算のためのバー数 VolumeThreshold – 異常な出来高を判定する倍率 ClusterSize – クラスター確認の近接バー数 RangeComparisonPeriod – 高値–安値の平均範囲算出期間 簡潔な結論: Iceblockは出来高は高いが価格変動が小さい箇所を強調表示します。アイスバーグ注文と似た効果を示唆しますが、MT4の出来高と価格データのみを使用します。矢印は異常活動のマーキングで、取引シグナルではありません。
FREE
VWAP_PC_MQL5 — a simple home-built VWAP indicator showing real-time volume-weighted price levels directly on your MT5 chart. TF: Works on all timeframes. Pair: Compatible with all symbols — Forex, indices, commodities, and stocks. Settings: Applied Price – price type used for VWAP calculation (Close, Typical, Weighted, etc.) Line Color / Width / Style – customize VWAP line appearance Session Reset – optional reset per day or continuous mode How it works (VWAP principle): VWAP (Volume Weighted
FREE
PDHL – simply displays the highs and lows of previous days directly on your chart, providing a quick and visual reference of past key levels. The indicator is lightweight and easily customizable , allowing you to adjust the number of days displayed, the colors, as well as the style and thickness of the lines to suit your preferences. It is designed to be simple and practical, but may not work on all instruments or platforms . Only teste Tested only with CFDs
FREE
Range Breakout EA – Simple Description Concept An automated trading robot for MetaTrader 5 that exploits range breakouts with two key periods: Features Automatic market hours management Customizable Stop Loss and Take Profit Smart Trailing Stop Built-in testing mode for simulation Detailed logs for monitoring How It Works Records extreme prices at the start of the day Waits for a breakout of the secondary range Opens a position in the breakout direction Automatically manages the trade (SL/TP/Tr
FREE
his indicator automatically identifies key support and resistance levels by analyzing volume patterns. Unlike traditional S/R tools that rely only on price, Volume S/R finds levels where the market truly reacted.   DETECTION LOGIC: - High Volume Zones: Price levels where strong buying/selling occurred - Low Volume Zones: Areas of weak interest - potential breakout or reversal zones   SMART FILTERING: - Nearby levels are automatically merged to avoid chart clutter - Maximum levels limit keeps yo
FREE
Dynamic Pivot Zones – Your Level Assistant on the Chart This indicator is a bit like a GPS for your trading . It shows you where the price likes to hang out, where it gets nervous, and where it flies through. No more calculating pivots by hand or guessing support and resistance levels. What it does: Automatically plots H1, H4, and D1 pivots . Shows support and resistance zones : R1, R2, S1, S2. Lines are colored and easy to read , so you can instantly see what’s hot or cold. Why you’ll love it:
FREE
Volume-to-Price Movement Oscillator (VP Oscillator) for MT5 The VP Oscillator highlights the balance (or imbalance) between trading volume and price movement, helping traders spot hidden accumulation, distribution, or weakening trends. How It Works: Calculates each bar’s price range (High–Low) and tick volume. Normalizes both values over a set period (default: 14). Plots the absolute difference between them ×100 — showing how closely price action aligns with trading activity. Interpretation: Hig
FREE
Volume & Move Strength (VMS) Indicator for MT5 The VMS Indicator displays the relationship between trading volume and price movement strength, helping traders assess how well market activity supports price action. How It Works: Measures tick volume as trading activity. Calculates move strength using a normalized True Range (%). Both values can be smoothed (default: 5) and optionally normalized (0–100) for consistency across markets. Plots two lines in a separate window: Blue (Volume) – trading a
FREE
Range Box Indicator for Trading Sessions This indicator allows traders to visualize and analyze specific time ranges directly on their chart by drawing rectangular boxes for each trading session. Key Features: Customizable session interval: set your own session start and end times. Number of days displayed: choose how many past sessions are visible. Default color and special color for Monday: easily highlight weekly patterns. Adjustable border width: customize the appearance of the rectangles to
FREE
STRUCTURAL TREND LINES - MT4 Indicator Simple indicator that automatically draws trend lines based on market structure. Features: - 3 degrees of structure detection (short, medium, long term) - Configurable swing strength for each degree - Single color per degree for clean visualization - Adjustable number of lines per degree - Customizable colors and line widths How it works: The indicator identifies swing highs and lows based on the strength parameter, then connects these points to create t
FREE
STRUCTURAL TREND LINES - MT4/MT5 Indicator Simple indicator that automatically draws trend lines based on market structure. Features: - 3 degrees of structure detection (short, medium, long term) - Configurable swing strength for each degree - Single color per degree for clean visualization - Adjustable number of lines per degree - Customizable colors and line widths How it works: The indicator identifies swing highs and lows based on the strength parameter, then connects these points to crea
FREE
This indicator allows you to number bars within a trading session for CFDs. It works on GER40, UK100, US30, US100, and US500 and is fully customizable to fit your trading style and chart preferences. Key Features & Parameters: Customizable session interval: define your own session start and end times Option to hide even numbers for a cleaner chart Adjust number distance to position the bar numbers as you prefer Font size and color: choose the size and color that suit your chart Number of days di
FREE
Adaptive Flow MAs is a moving average indicator designed to naturally adjust to market movements. Unlike traditional averages, it dynamically adapts its periods based on recent volatility and the current trend. The EMA closely follows rapid price swings to capture every impulse, while the SMA remains smoother, providing a stable and reliable reference. With a clean display showing the current adaptive periods, this tool helps traders feel the “flow” of the market without visual clutter. It’s cr
FREE
indicator that numbers the bars (candles) in a custom trading session. The indicator allows: Defining the session start time (StartHour and StartMinute) Displaying numbers only on odd bars (if AfficherUniquementImpairs is true) Displaying numbers on the last N days (NbJours) Customizing the color and font size of the text The indicator will loop through the bars of the last N days and, for each day, start counting from the session start time. It will display the bar number (starting at 1) belo
FREE
The Candle Activity Visualizer turns your chart into a dynamic heatmap, giving you a clear view of buying and selling pressure. In-Depth Market Insight: Active Zone Detection: The algorithm highlights areas where high volume builds up within a narrow price range, revealing key pressure zones. Real-Time Intensity: Colors adjust in real time, shifting smoothly from cool tones to warmer shades as activity increases. Visual Customization: 5 Color Palettes: Choose from five professionally designed th
Rainbow Price Visualizer v1.21 See where the market really breathes. Turns your MT4 chart into an ultra-precise heatmap that highlights price zones favored by big players. Why it matters 300 price levels at 0.2‑pip resolution — microscopic detail. 8 visual themes (Rainbow, Fire, Ocean…) for instant readibility. Smart opacity: low noise fades, real zones pop. Lightweight rendering with automatic cleanup. Fully customizable: saturation, opacity, resolution, history depth. Bands project into the f
バブルインジケーター ― 価格減速 + 出来高スパイク検出 価格が突然減速し、同時に出来高が急増したときに、チャート上に色付きの四角を表示するシンプルなビジュアルツールです。 (塗りつぶし機能と同心円状のバブル効果を含む) 市場が動き出す前の重要なタイミングを見極めるのに役立ちます。 インジケーターの役割: 市場が動く前に「ためらう」瞬間を検出 出来高が増えても価格があまり動かないポイントを表示 ブレイクアウトや転換の可能性を事前に察知 動作の仕組み: 現在のチャートよりも小さいタイムフレームを分析 異常に小さいローソク足を検出(価格の減速) 異常に高い出来高を検出(出来高スパイク) 緑(強気)または赤(弱気)の四角を表示 主な設定項目: 価格感度: 値が低いほど反応が敏感 出来高倍率: 値が高いほど検出が厳密 バブルサイズ: 表示の見やすさを調整 なぜ便利なのか: シンプルで視覚的にわかりやすい 複雑な計算は不要 興味深い市場パターンを見つけやすい 完全にカスタマイズ可能 レンジ相場、ブレイクアウト、または市場のダイナミクスを理解するのに最適です。
Institutional Flow Indicator A smart volume-based tool that detects institutional activity zones through direct order flow patterns. It reveals where large institutions operate. An advanced volume indicator that filters out noise to identify probable institutional patterns. Key Features Smart cluster detection Automatic identification Signal classification: Violet / Yellow – Institutional Zone – Strong, sustained institutional activity Red / Green – Strong Signal – Significant buying/selling pre
AutoPivot - 自動ピボットポイントインジケーター MT4用の高機能インジケーターで、日次・週次・月次の主要ピボットポイント(PP、R1、R2、R3、S1、S2、S3)を自動的に計算・表示し、前日の高値(PDH)および安値(PDL)も同時に描画します。トレーダーがサポート・レジスタンスゾーンを素早く把握できるよう設計されています。 主な機能: インテリジェントな時間枠認識 :チャートのタイムフレーム(H4、D1、W1)を自動検出し、各時間軸に最適化されたピボット計算を実行。 前日高値・安値表示 :PDH/PDLを自動で描画し、現在価格との位置関係を直感的に確認可能。 サポート/レジスタンスゾーン表示 :PDH/PDLと隣接するピボットラインの間に半透明ゾーンを生成し、反転やブレイクアウトの可能性を視覚化。 8種類のカラーテーマ :クラシック、ダーク、ライト、ブルー、プロフェッショナルなど8つのプリセットテーマを搭載。色、ラインスタイル、透明度も自由にカスタマイズ可能。 価格ラベルの表示オプション :各ピボットラインに対応する価格とコンパクトなラベル
AMD Adaptive MA MT4
Vincent Jose Proenca
5 (1)
AMD適応型移動平均線 (AAMA) AAMAはMetaTrader 4用の適応型移動平均インジケーターで、市場の状況に応じて自動的に反応速度を調整します。 主な特徴: カウフマン効率比に基づく適応型移動平均 – トレンド相場では素早く反応し、レンジ相場ではノイズを除去 AMDの4つの市場フェーズを自動検出:蓄積期(Accumulation)、上昇期(Markup)、分配期(Distribution)、下降期(Markdown) ATRによるボラティリティ適応 – 現在の市場状況に応じて感度を調整 リアルタイム情報パネルで検出されたフェーズ、自信レベル、適応速度を表示 複数インジケーターを統合:ADX、RSI、MACDを使用して市場フェーズを正確に識別 Fast/Slow参照ゾーンで適応動作を視覚化 使用方法: このインジケーターは市場状況に応じて自動的に適応速度を調整します。強いトレンドでは反応が速く、レンジでは遅くなります。ビジュアルパネルは現在の市場フェーズの解釈をサポートします。すべてのパラメータ(期間、色、感度)はトレーディングスタイルに合わせて自由にカスタマイズ可能です
STRUCTURAL TREND LINES - MT4 Indicator Simple indicator that automatically draws trend lines based on market structure. Features: - 3 degrees of structure detection (short, medium, long term) - Configurable swing strength for each degree - Single color per degree for clean visualization - Adjustable number of lines per degree - Customizable colors and line widths How it works: The indicator identifies swing highs and lows based on the strength parameter, then connects these points to create t
Volume Profile Rectangle 概要 インタラクティブな 出来高プロファイル指標 で、選択したエリア内の各価格レベルにおける取引量の水平方向分布を表示します。自動的に移動可能な長方形を作成し、買い優勢と売り優勢の出来高分布を色付きバーで視覚化します。 機能概要: 水平出来高の表示 :各価格レベルの出来高分布を水平バーとして表示 強気/弱気分析 :強気(買い)優勢を緑、弱気(売り)優勢を赤で表示 インタラクティブな長方形 :選択範囲の長方形を動かすと自動で再計算・更新 自動生成 :起動時にデフォルトの長方形を自動作成し、すぐに使用可能 動作原理: エリア選択 :長方形(自動または手動で作成)で分析範囲(時間+価格)を指定 出来高分布 :価格範囲を複数のレベルに分割(解像度設定可能)し、選択されたローソク足の出来高を分配 スマートカラーリング :各価格レベルで買いと売りのどちらが優勢かを判定 動的表示 :チャートの移動、ズーム、スクロール時にバーが自動的に再描画 オプションフィルター :ローソク足の実体またはヒゲを基準にフィルタリング可能(垂直フィルター) 主な設定: 長
Proxy OrderFlow MT4
Vincent Jose Proenca
5 (1)
ティックスプレッドの不均衡に基づくインジケーター。 TF: すべての時間足(M1〜D1)に対応。 ペア: Forex、指数、ゴールド、CFD に対応(JPYペア、ゴールド、CFD向けに自動調整)。 設定: TickWindow (200) – ティック観察ウィンドウ SpreadWeight (1.5) – スプレッドの重み付け NormalizationPeriod (20) – 正規化期間(z-score) Overbought / Oversold (±3.0) – アラート閾値 AlertCooldown (300s) – アラートのクールダウン時間 結論: Proxy Order Flow – Imbalance Tick-Spread v2.4 は、OHLC の変動とスプレッドを分析して買い/売り圧力を検出し、市場の方向性と不均衡ゾーンを明確に示します。
Nexus Signal System は MT4 用のインジケーターで、12 のテクニカル条件を組み合わせてトレードシグナルを生成します。本システムは、シグナルを確定する前に複数の要素(トレンド、モメンタム、出来高、サポート/レジスタンスゾーン)の共鳴を分析し、単一の指標だけを使用する場合に比べて、誤シグナルの発生を減らします。 分析基準(スコア 0–15 点): パターン検出(ピンバー、包み足) マルチタイムフレーム分析(上位時間足でのトレンド確認) ADX マーケットレジーム(トレンドのない市場を回避) サポート/レジスタンスゾーン(自動スイングポイント) 移動平均線 20/50/200(トレンド整列) RSI 14 期間(モメンタム) 相対出来高(機関投資家の確認) ATR(ボラティリティ) 機能: 透明な品質スコア付きシグナル(0–15) 自動検出された S/R ゾーンをチャートに表示 仮シグナル(現在のバー)と確定シグナル(確定バー) ATR に基づくストップロスおよびテイクプロフィット リアルタイム市場情報ダッシュボード 8 種類のカラーテーマで視覚的カスタマイズ 56
VR Signal
Vincent Jose Proenca
VolumeRejectionSignals v5.0 高度なボリューム分析インジケーター 概要 VolumeRejectionSignals v5.0 は、ボリュームリジェクションの詳細な分析を通じて、重要な価格変動を正確に特定するために設計された高度なテクニカル指標です。 オーダーフローの動態と市場構造を組み合わせることで、買い圧力や売り圧力が弱まるゾーンを検出し、反転やトレンド加速を予測できます。 インテリジェントスコアリングシステム 本インジケーターは、各シグナルの品質を 0 〜 100% のスケールで評価する加重スコアリングシステムに基づいています。 シグナルは次の3つのカテゴリーに分類されます: スタンダード: 50–65% ストロング: 65–80% プレミアム: 80%以上 この分類により、シグナルの信頼性を優先順位付けし、検出された信頼度に応じてトレード戦略を調整できます。 フィルターとカスタマイズ VolumeRejectionSignals v5.0 は、市場状況に応じてシグナル検出を最適化できる複数の設定可能なフィルターを提供します: トレンドフィルター(
機関投資家向け流動性圧縮インジケーター このインジケーターは、ボリンジャーバンドの幅、出来高、平均スプレッドを正規化してリアルタイムで流動性の引き締まりを測定し、価格ブレイクアウト前の圧縮フェーズを検出します。 表示: プロフェッショナル仕様の独立ウィンドウに「Compression Score」ヒストグラムと「Threshold」基準線を表示。 主な特徴 早期検出: 価格の急変前に圧縮ゾーンを特定。 多要素分析: 正規化されたボリンジャーバンド幅、出来高、平均スプレッドを組み合わせ。 リアルタイム更新: 現在のバーでティックごとに更新。 明確な可視化: 「Compression」ヒストグラムと点線の「Threshold」ライン。 互換性: MT4 および MT5 に対応。 使用方法 対象銘柄のチャートにインジケーターを追加します。 ボラティリティやセッションに合わせて閾値と重みを調整します。 解釈: スコアが高い場合は流動性圧縮フェーズを示します。価格のブレイクアウトを注視してください。 パラメーター BB_Period / BB_Dev: ボリンジャーバンド幅の計算。 Norm_
Mean Reversion Probability – 統計的リバーサルインジケーター 概要 本インジケーターは、過去の過剰拡張データをもとに、価格が200期間移動平均線(MA200)へ回帰する統計的確率を算出する機関投資家向けツールです。市場の疲労ゾーンを定量的に特定します。 主な特徴 高度な統計分析 – 500件以上の過去拡張データをもとに実際の確率を計算 確率スコア (0〜99%) – 平均への回帰確率を正確に定量化 疲労検出 – 拡張の期間と強度を測定 マルチアセット対応 – Forex、株価指数、金、仮想通貨、CFDに自動対応 スマートアラート – 稀だが信頼性の高いシグナル(確率 >80%、期間 >15バー) プロ仕様の表示 – シンプルで見やすいインスティテューショナルデザイン 分析方法 リアルタイムで以下を分析: 価格とMA200の正規化距離(ATR換算) 最後の平均回帰からの拡張期間 最大拡張に至るまでの時間 過去平均との比較 確率計算: 距離スコア(最大60%):現在値 vs 過去比 期間スコア(最大40%):拡張時間 vs 平均 疲労ボーナス(+15%):
日本語 – WBPチャートシグナル – マルチタイムフレーム買い/売り圧力インジケーター 概要: WBP Chart Signals は、出来高・スプレッド・価格アクションを総合的に分析し、市場の買い/売り圧力を測定する高度なインジケーターです。マルチタイムフレーム確認を備えた精度の高いシグナルを求めるトレーダーに最適です。 主な特徴: Weighted Buy Pressure (WBP): VWAP、MA200、出来高強度、流動性、モメンタムを組み合わせた独自アルゴリズム マルチタイムフレーム分析: 上位足での自動確認 リアルタイム・マルチシンボルスキャナー: 最大6つの主要通貨ペアを同時監視 高精度フィルタリング: 7つの確認フィルター(ダイバージェンス、出来高、トレンド、HTF) プロフェッショナルダッシュボード: リアルタイムでWBP値と上位足分析を表示 機関投資家レベルの計算: 対数スケール出来高、VWAP加重、確信度ファクター シグナルシステム: BUY: 強い買い > 75、適度な買い > 65 SELL: 強い売り < 25、適度な売り < 35 インジケーターウィ
フィルタ:
レビューなし
レビューに返信