Market Profiles Linear United
- インディケータ
-
Andrei Novichkov
 Development: MT 4 & 5, NinjaTrader 7 & 8.
Translations from Pine.
Telegram: https://t.me/fxstill (Literature on cryptocurrencies, development and code) - バージョン: 1.10
- アクティベーション: 5
Basic information.
To perform its work, the indicator takes data on volumes from a lower timeframe, builds Market Profiles for a higher timeframe and a histogram for the current timeframe.
The indicator starts in several stages. In this case, messages like: "Build Source & Target TF. Step: …" are output to the log. The process can be accelerated by changing the input parameter Milliseconds between steps - the initialization speed. The final value of this parameter is always individual and is set by the trader.
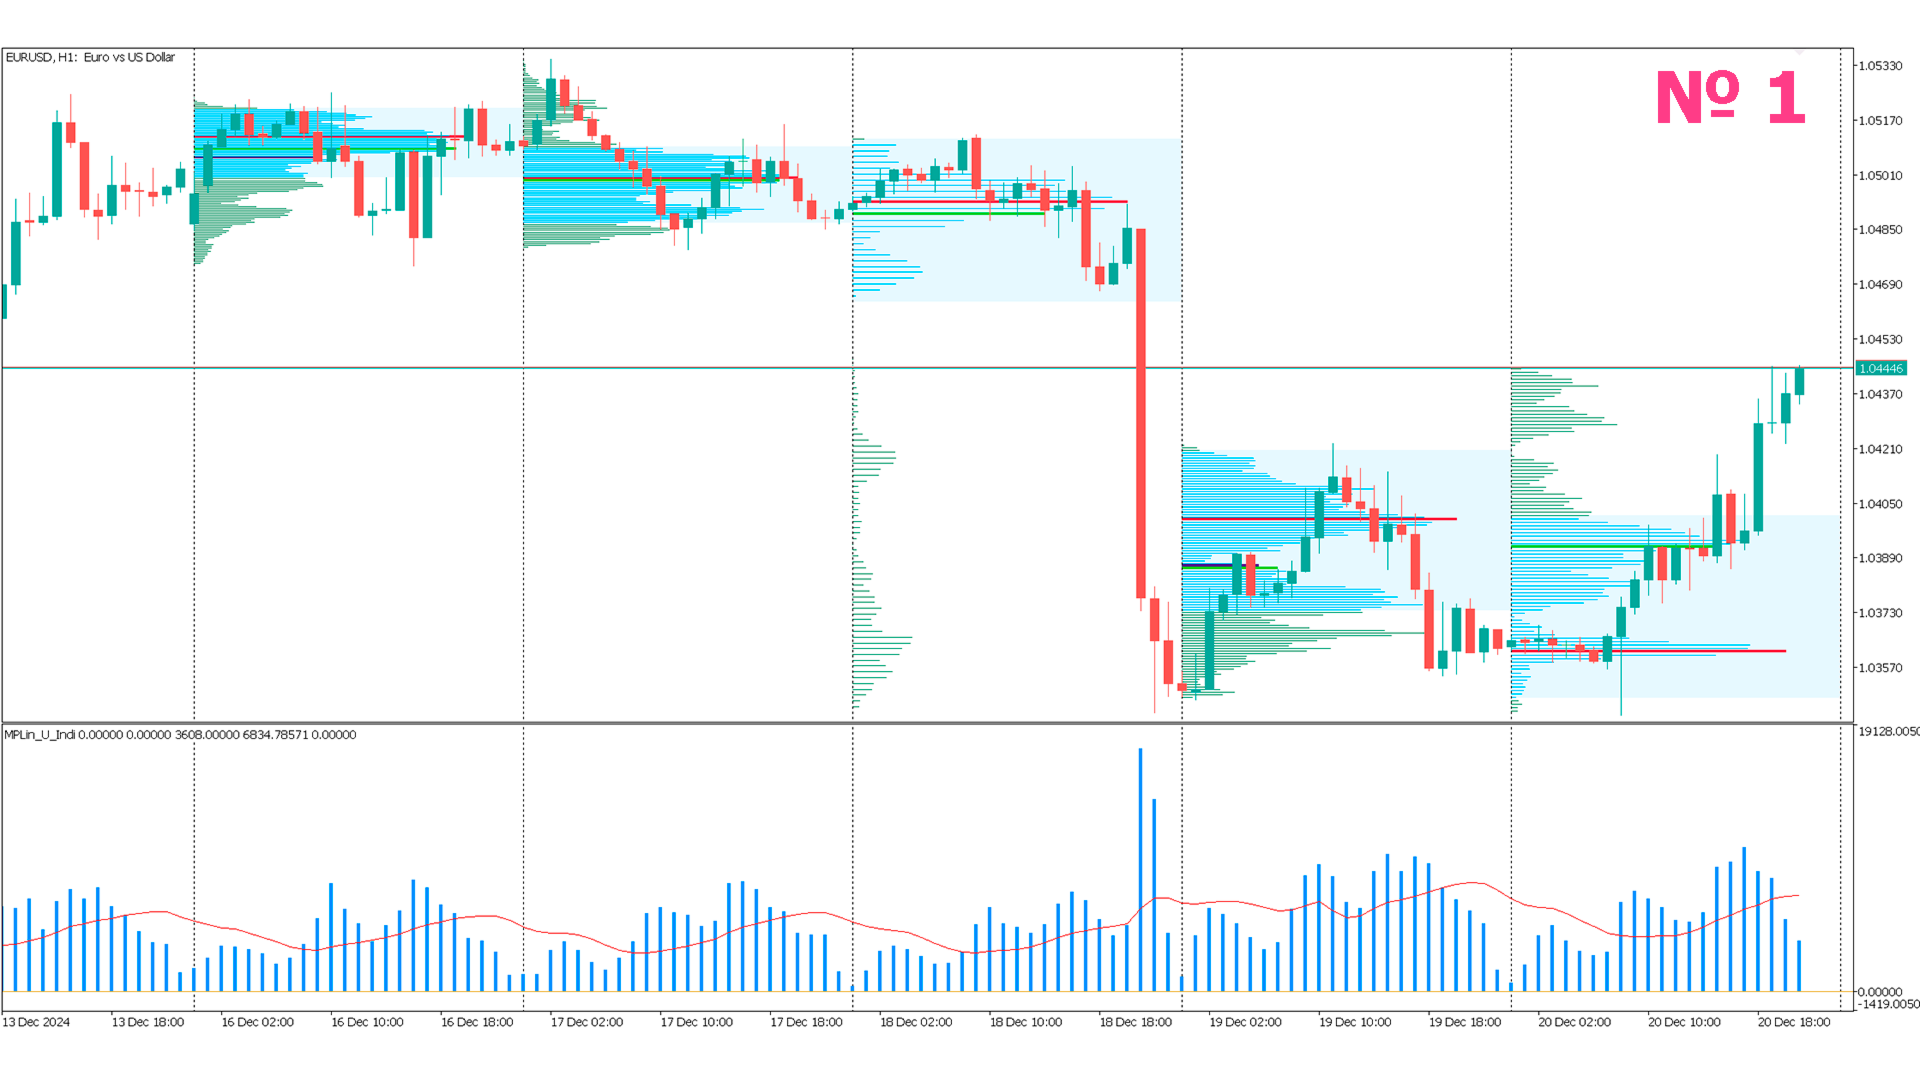
The "Market Profiles Linear United" indicator combines two ways of displaying information:
- The lower subwindow contains a volume histogram with a moving average.
- The main window contains Market Profile diagrams.
The trader can choose one of three types of information display, independently for each of the windows:
- Simple Linear. This method is shown in screenshot 1. Profiles and a histogram of volumes represent a regular volume related to a specific candle or profile level.
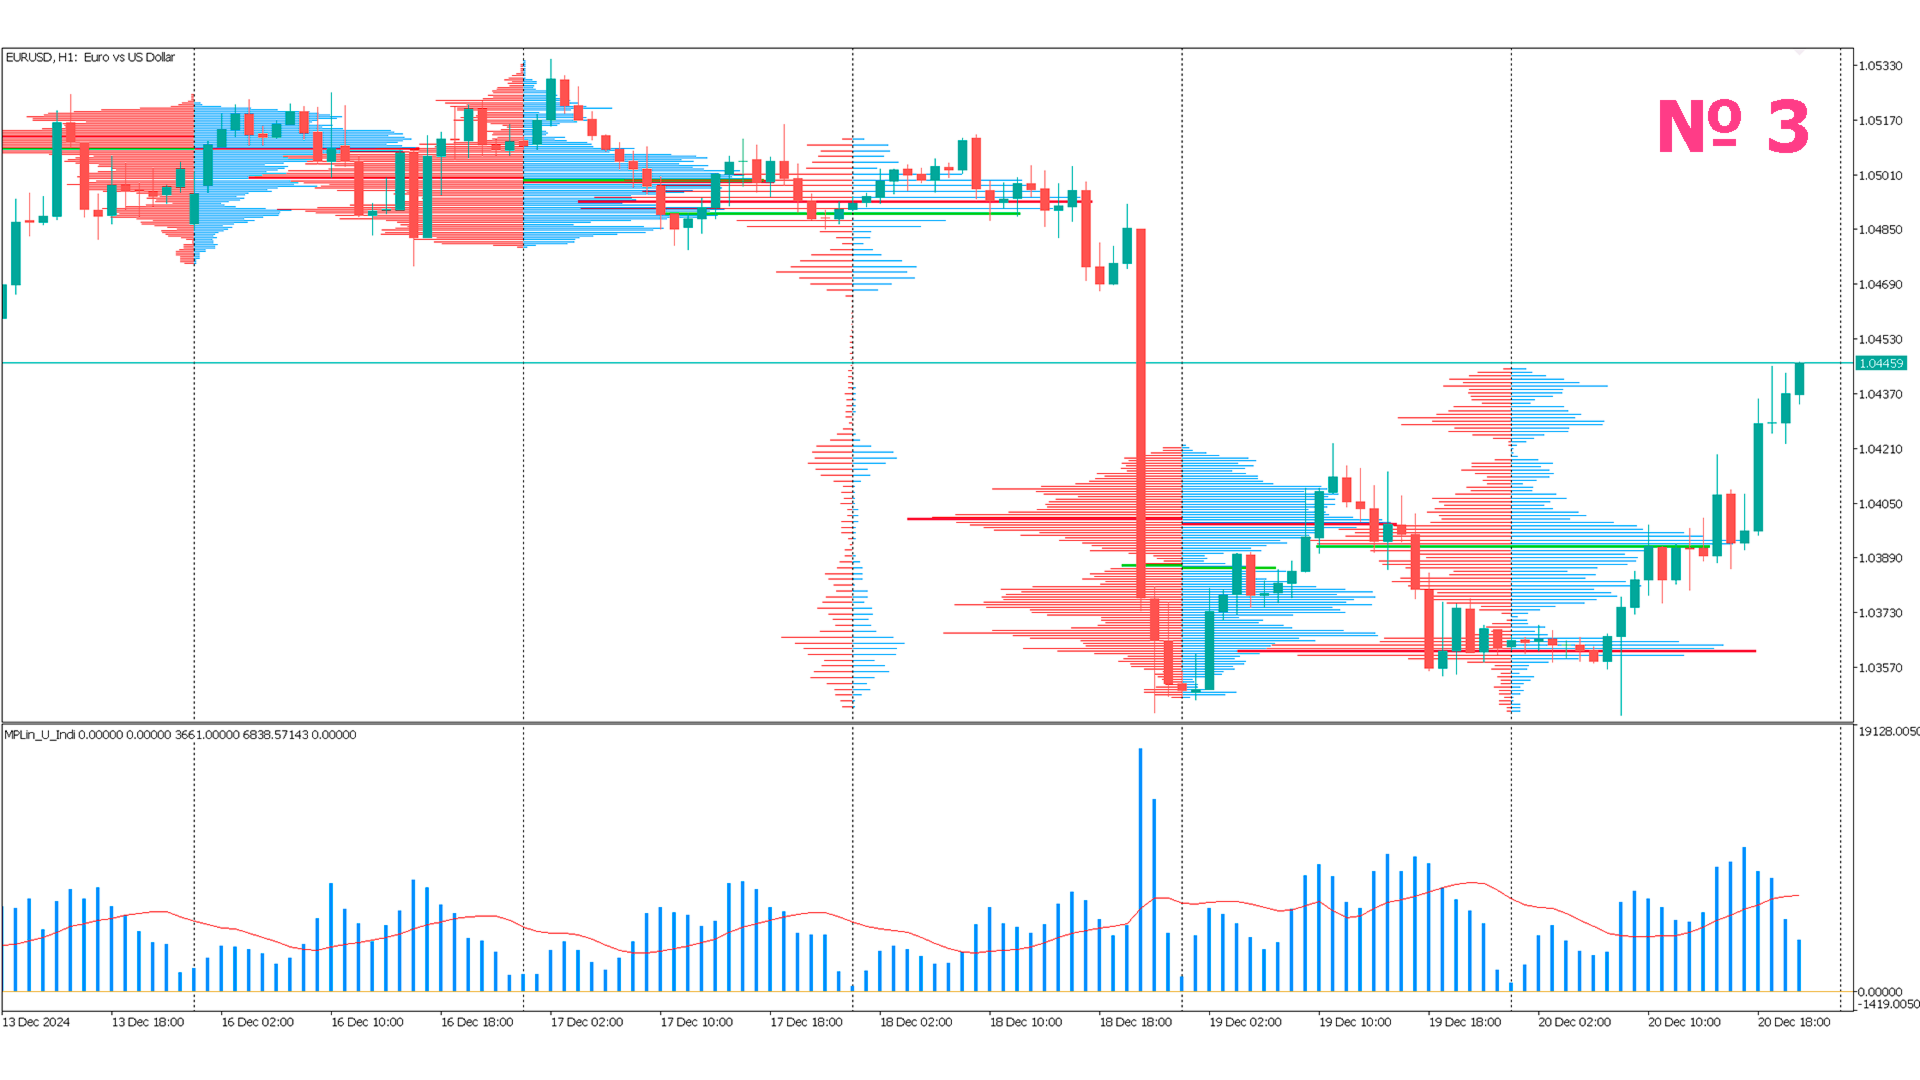
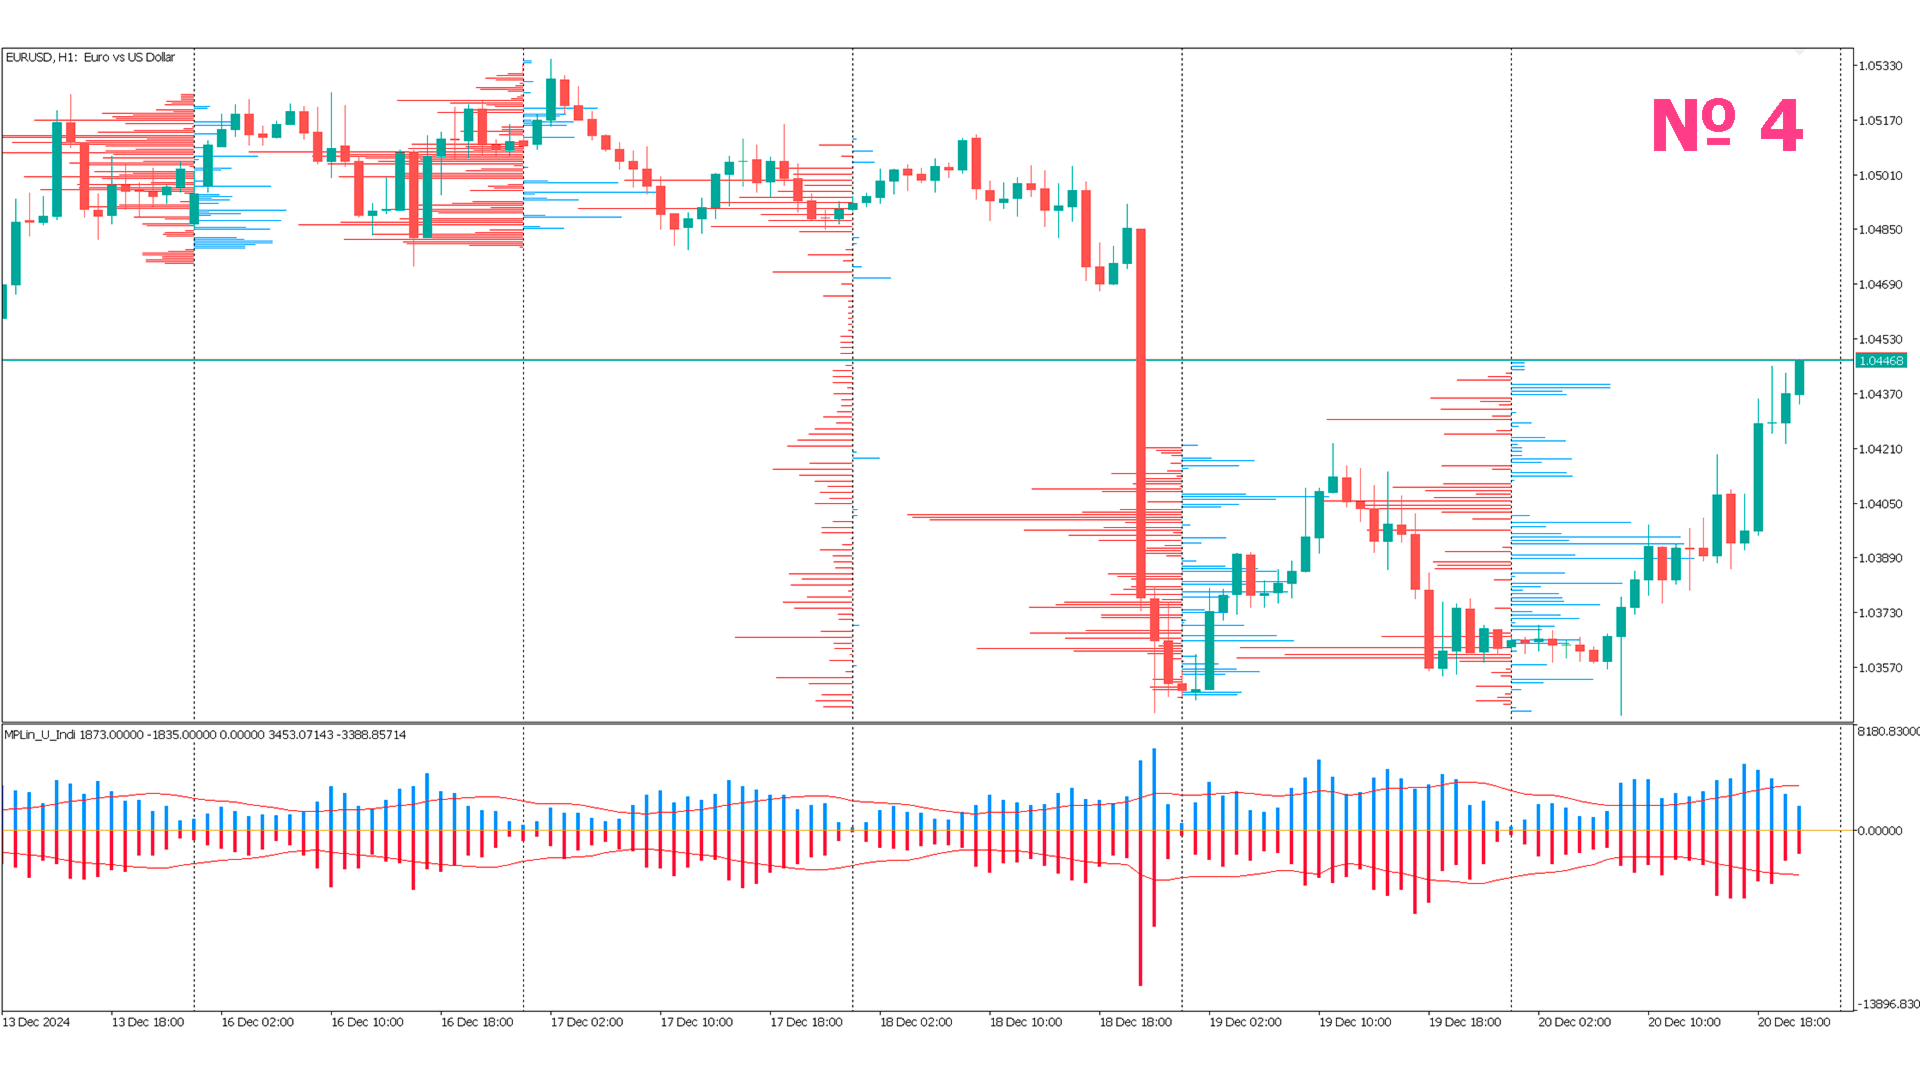
- Buy & Sell. In this case, the volume is divided into two parts. The volume "to buy" and the volume "to sell". This method is shown in screenshots 3 and 4.
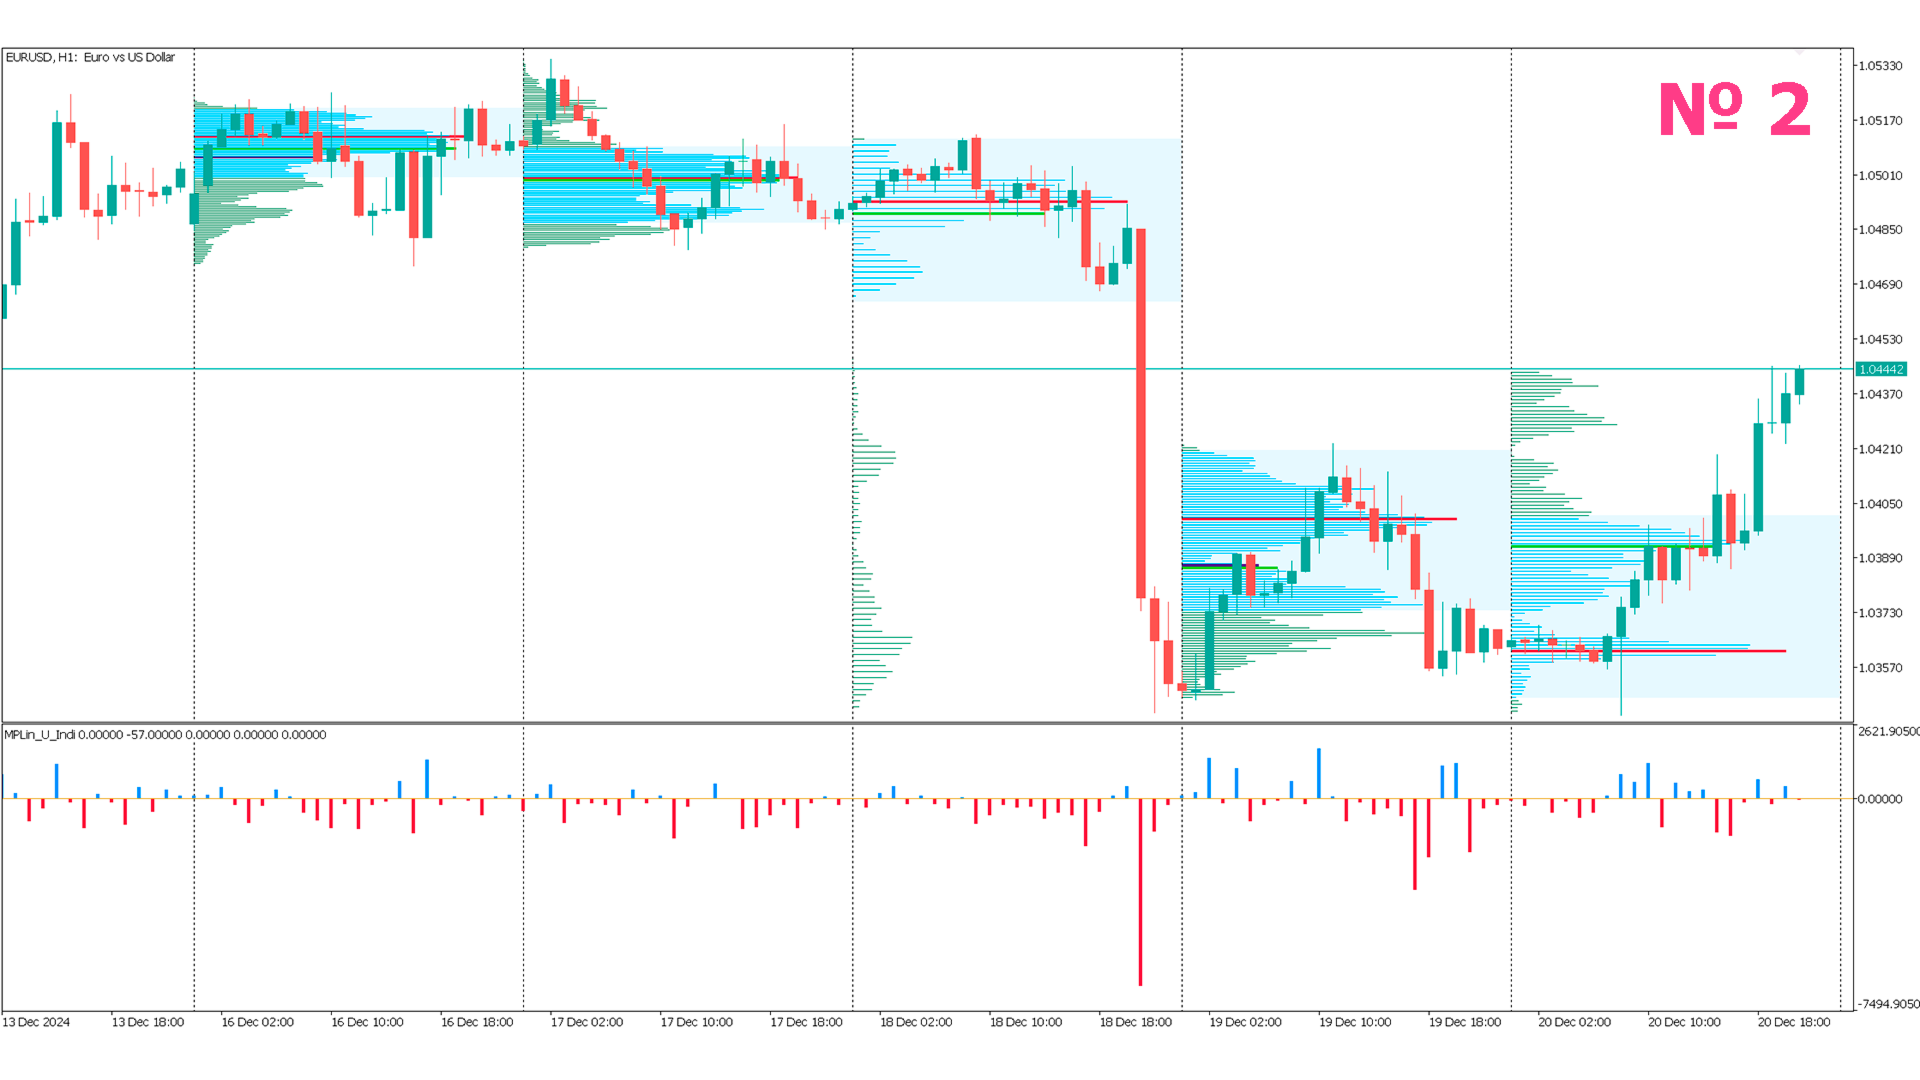
- Delta. This method displays the difference between the volumes "to buy" and "to sell". This method is demonstrated in screenshots 2 and 4.
In the input parameters, the trader can choose one of two options for using the source data, Volumes Type:
- Tick Volume - for working on Forex.
- Real Volume - for working with real volumes.
Histogram in the subwindow.
For the histogram in the subwindow, the trader can set the period of the moving average (for the Buy & Sell type, two moving averages are displayed), turn it off completely, set the color and thickness. There is a customizable notification for the histogram: "Exceeding average volume" - the current volume exceeds the average by "Vol. Multiplier". Market Profiles.
For the profile collection, the trader can select the appearance options: Horizontal size, color, thickness of the level lines, the number of visible profiles.
The main setting of the Market Profiles is the timeframe for which the Market Profiles are built:
- Target TF - By default, this is the daily timeframe.
For calculations, the indicator uses one of three calculation accuracies, which affect the number of profile levels:
- Exactly.
- Middle - used by default.
- Rough.
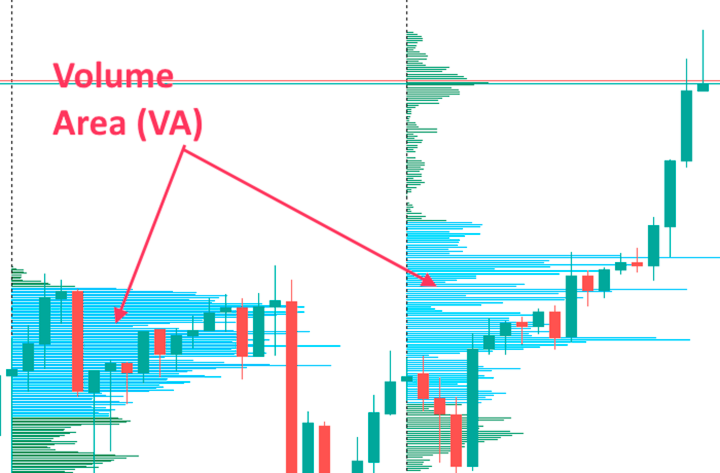
Value Area.
Value Area is a range of price values within which about 70% of all transactions per day are made. The trader can control the appearance of the Zone, disable its display and control the size (VA data, percent) in the input parameters.
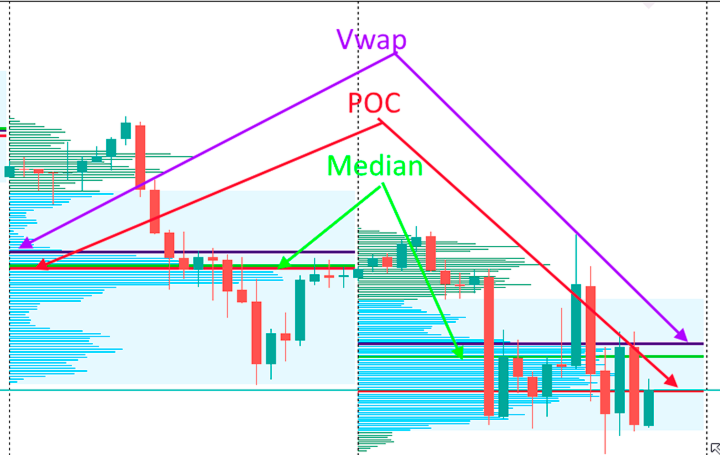
Profile Levels.
The indicator can display three levels on the Profiles:
- Vwap.
- POC.
- Median.
The display of each level and its appearance are configured separately in the input parameters.
Alerts on Market Profiles.
- POC change – Change in the POC position by the amount of POC Multiplier points.
- Crossing … - Price crossing the VAL, VAH, POC, Vwap, Median levels.
Alert Types.
To reliably inform the trader about the events that are taking place, a choice of one of the notification methods is provided (the method is the same for all notifications):
- No Signal - No notifications
- Simple Print - Simple output to the log
- Sound - Sound signal
- Push - Notification
- Email - Message to email
- Push + Sound + Message - Combined notification
- Email + Sound + Message - Combined notification
- Push + Email - Combined notification
- Push + Email + Sound + Message - Combined notification
More detailed and complete information about the input parameters and operation of the indicator can be obtained from the documentation for the indicator in pdf format. How to get it will be indicated in the author's profile.
If purchased, the "Market Profiles Linear United" indicator will be an excellent addition to the trader's arsenal, will prompt the exact entry and closing levels of a position, and will protect against mistakes. Do not forget about this))