Triple SuperTrend Histo
- インディケータ
- バージョン: 1.5
- アップデート済み: 5 5月 2022
- アクティベーション: 5
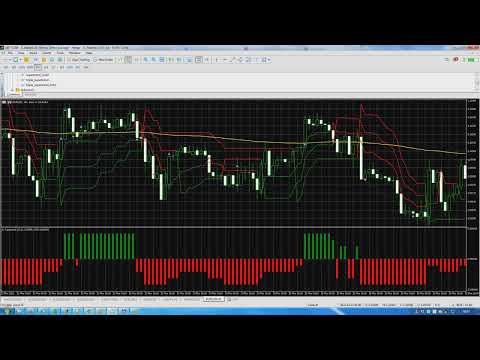
Triple SuperTrend Histo
indicator calculate three supertrends to show the trend as a histogram.
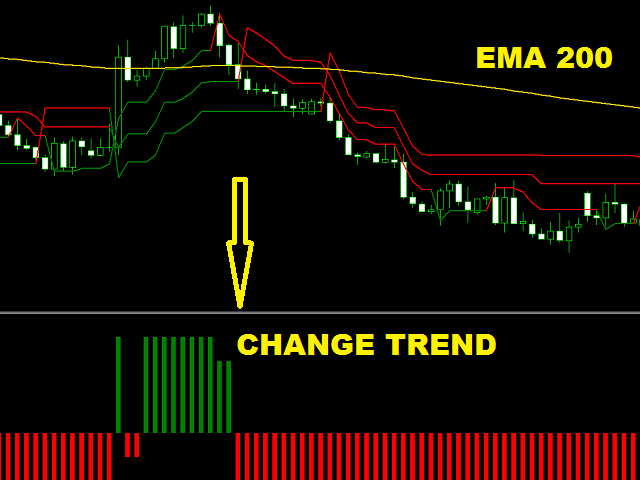
Changing the color from red to green means you can BUY, from green to red means you can SELL.
Description of the method of drawing a histogram.
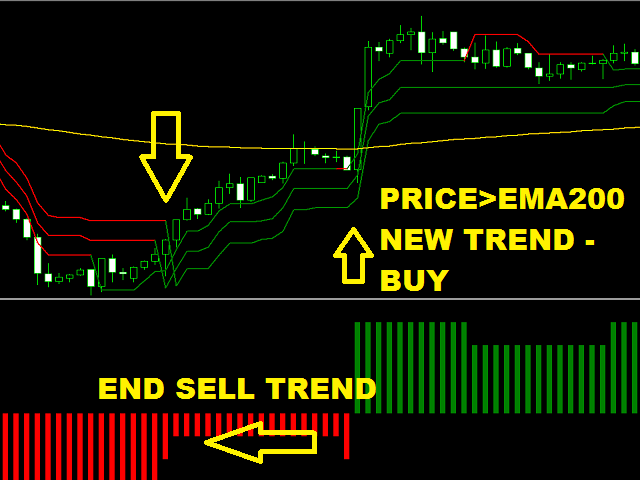
The price is above the EMA 200, I check the values of the supertrend.
Each price of the supertrend lines above is one point.
Three points is a strong BUY trend, color GREEN.
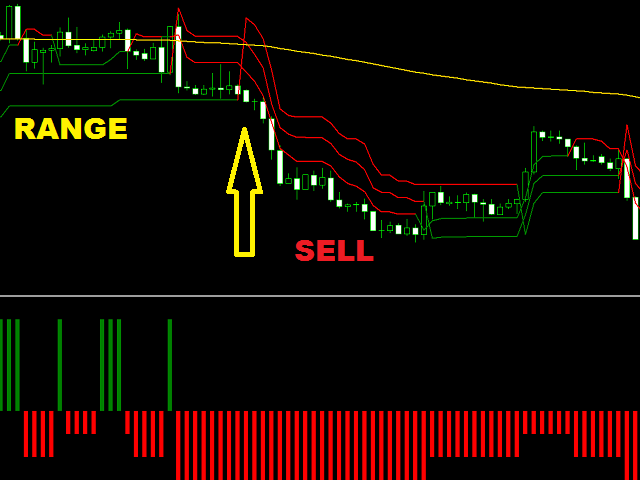
The price is below the EMA 200, I check the values of the supertrend.
Each price below the supertrend line is one point.
Three points is a strong SELL trend, color RED.
You can use the second my indicator:
You will see 3 supertrends and EMA 200 lines on the screen.
Working with my product :
https://www.mql5.com/en/market/product/80692
USAGE THIS INDICATOR
For BUY :
- Three green lines and price above EMA (200)
- Stop Loss below last supertrend red line.
For SELL:
- Three red lines and price bellow EMA (200)
- Stop Loss above last supertrend green line.
Some traders use the Supertrend Line as a Stop Loss boundary.