Atlantis Pro

Atlantis Pro Indicator — ティック単位の市場分析とポートフォリオ戦略を両立

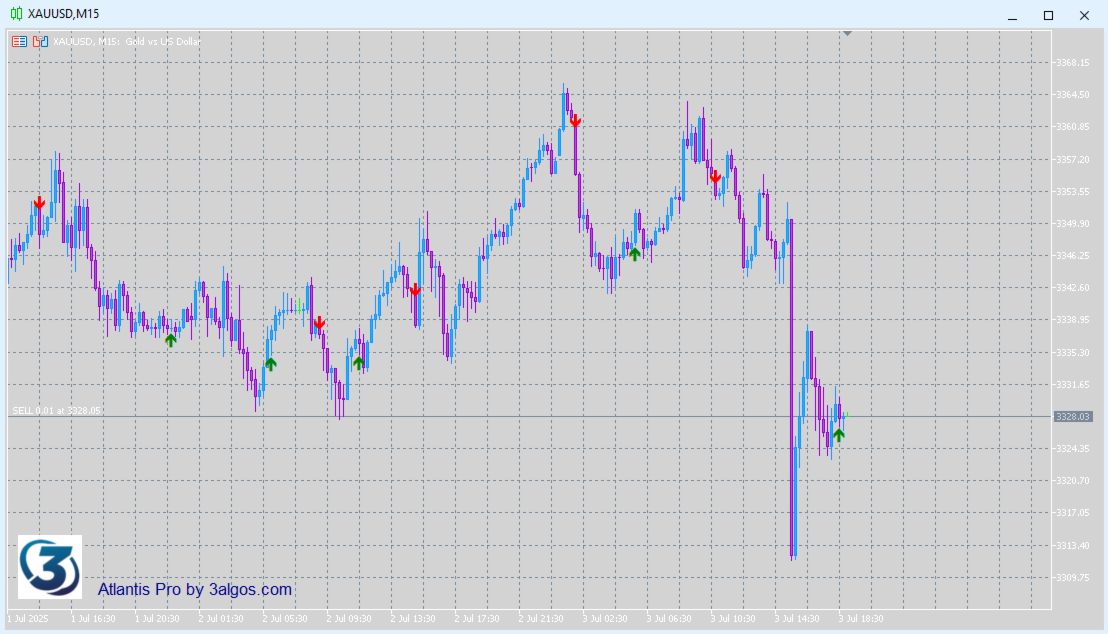
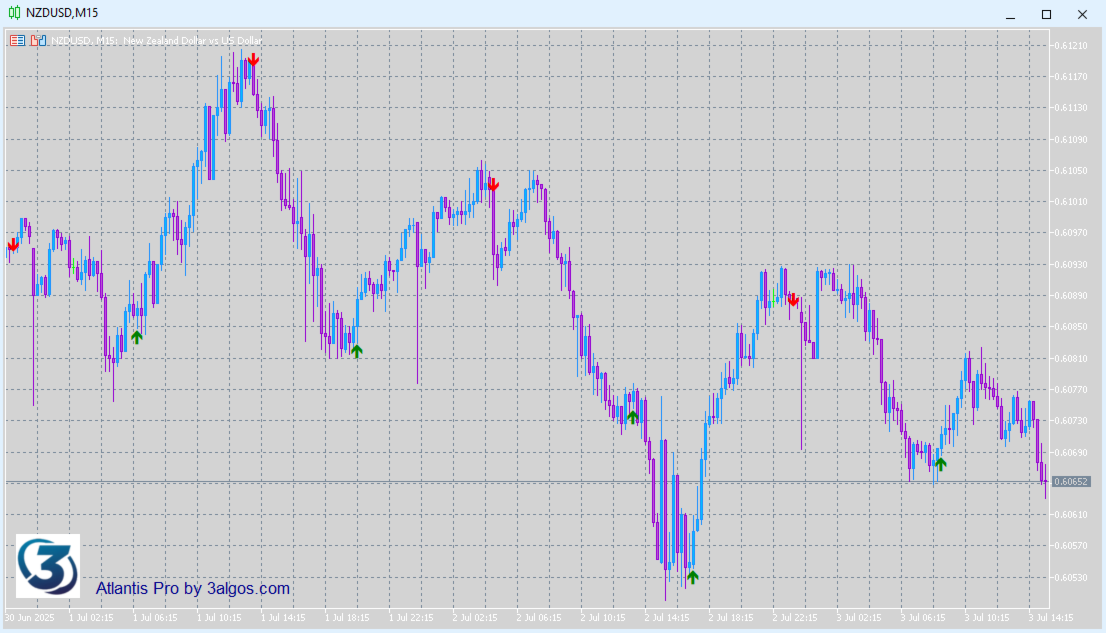
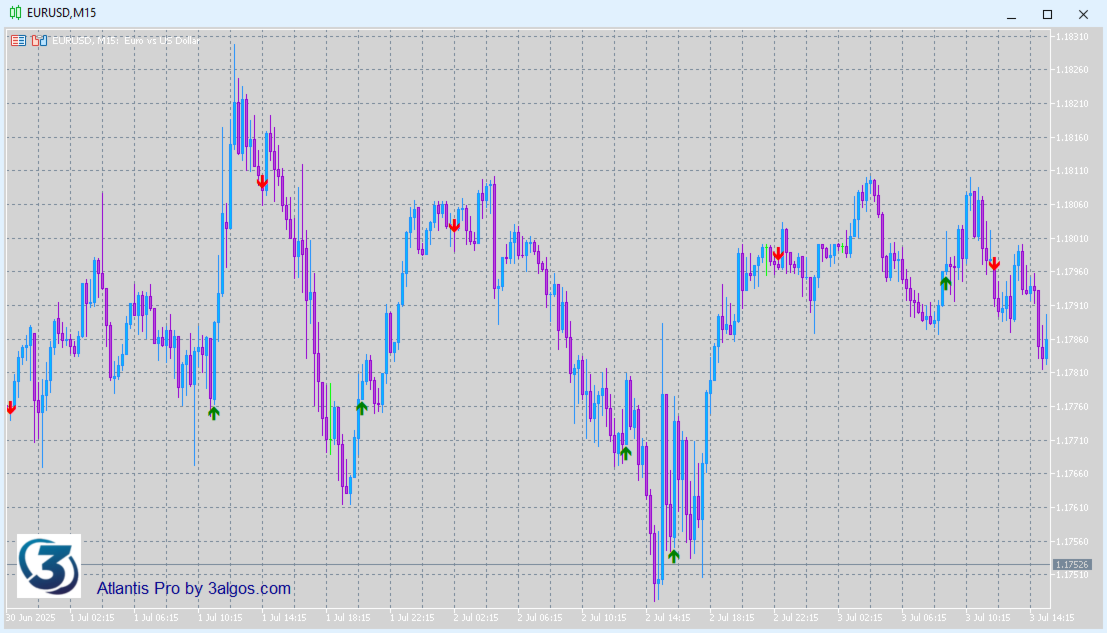
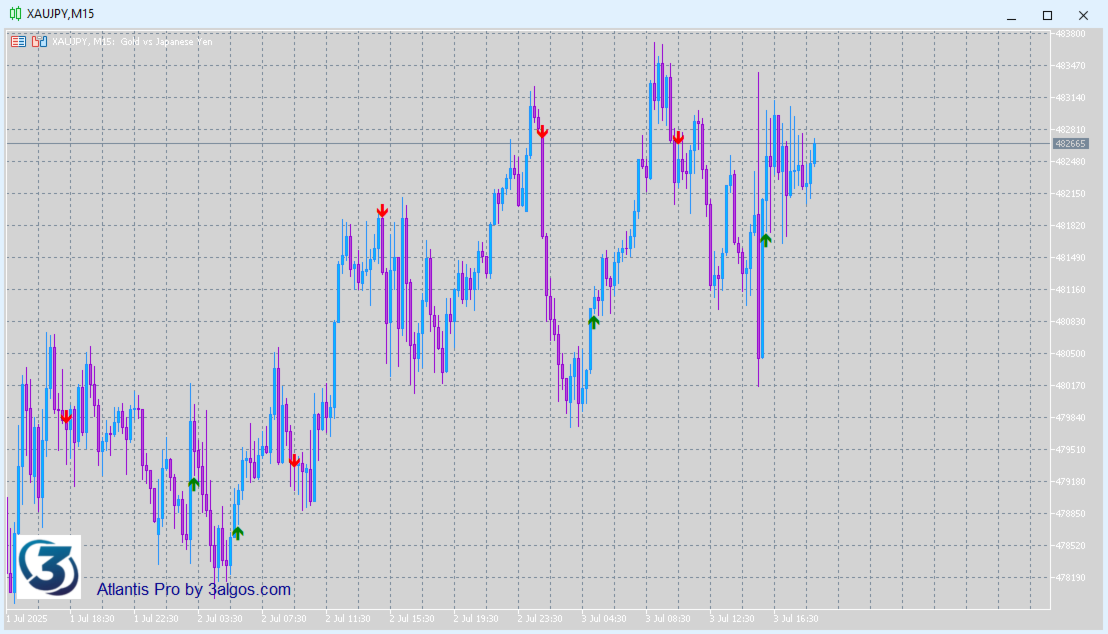
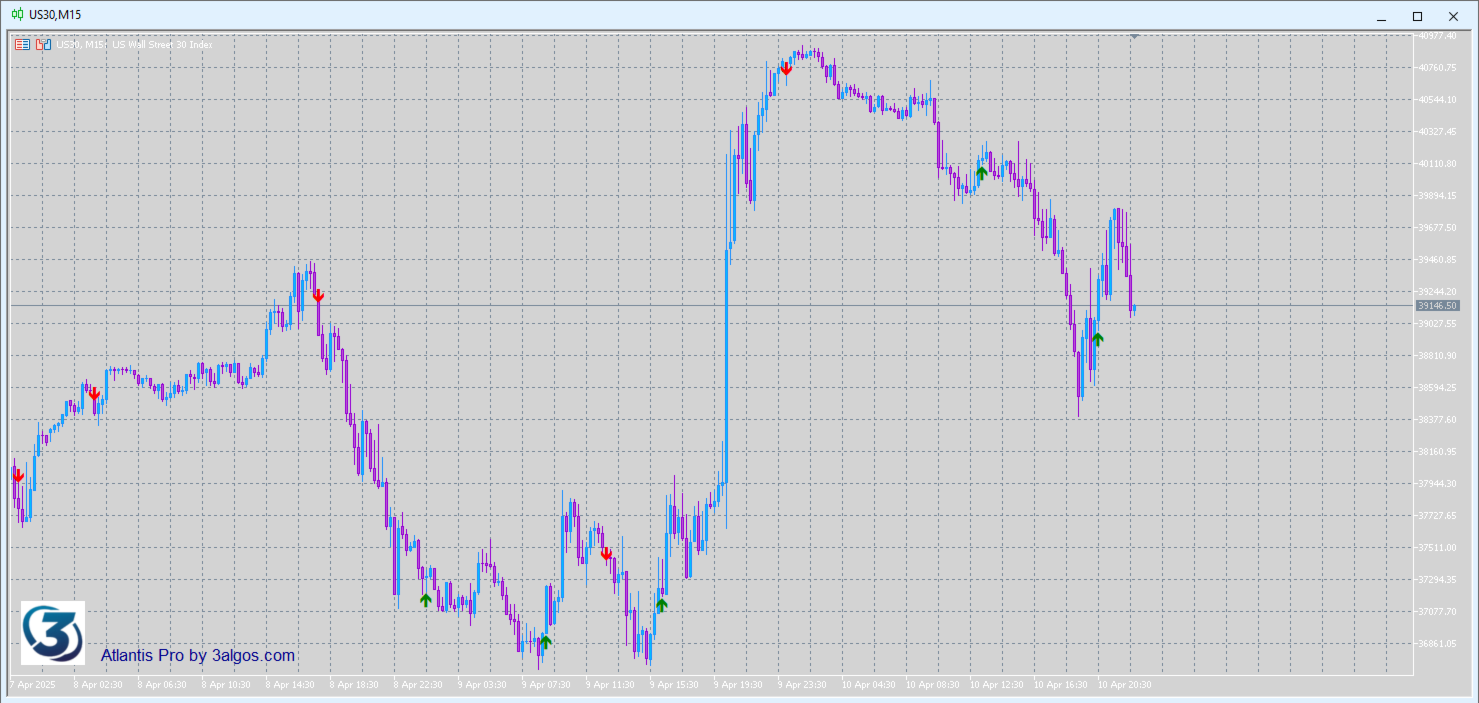
Atlantis Pro Indicator は、リアルタイムのティックデータを駆使して、重要な価格帯と高確率の反転ゾーンを高い精度で捉える多機能インジケーターです。市場のすべてのティックを連続的に解析し、買い/売り圧力の転換点を正確に見極め、チャート上に鮮明な Buy/Sell の矢印を即座に表示 — デフォルトで可視化され、すぐに行動可能です。

Atlantis Pro は あらゆる時間足・銘柄 に対応し、FX、株式、商品、指数、暗号資産など幅広く活用可能です。本当の強みは複数銘柄を 同時に監視・活用 できること。複数のシンボルで最適なエントリー・イグジットを同時に捉え、分散ポートフォリオ を構築してリスクを分散し、安定した利益を目指せます。

単一のチャートや銘柄に縛られず、相関性のある・ない市場を横断してシグナルをキャッチすることで、自然なヘッジが効き、利益のブレを抑制。マルチ銘柄対応で、より精度の高いポートフォリオ収益を確保し、市場の変動にも揺らがない安定性を支えます。

スキャルピング、スイングトレード、長期ポジション — どのスタイルでも Atlantis Pro は即実践可能なリアルタイムシグナルを提供し、判断力と自信を後押しします。

主な特徴:
✔️ ティック単位データ処理で高精度シグナル
✔️ チャート上の Buy/Sell 矢印がデフォルトで表示
✔️ どの時間足・どの銘柄でも使用可能
✔️ 複数銘柄を同時モニタリングしポートフォリオ取引に対応
✔️ 複数市場間での自然なヘッジで収益の安定化
✔️ 面倒な設定なし、シグナルは一目瞭然

Atlantis Pro Indicator でティックデータの可能性を最大限に引き出し、ポートフォリオ取引を進化させましょう。


おすすめのプロダクト
The market is unfair if only because 10% of participants manage 90% of funds. An ordinary trader has slim changes to stand against these "vultures". This problem can be solved. You just need to be among these 10%, learn to predict their intentions and move with them. Volume is the only preemptive factor that faultlessly works on any timeframe and symbol. First, the volume appears and is accumulated, and only then the price moves. The price moves from one volume to another. Areas of volume accumu
インディケータは現在のクオートを作成し、これを過去のものと比較して、これに基づいて価格変動予測を行います。インジケータには、目的の日付にすばやく移動するためのテキスト フィールドがあります。 オプション: シンボル - インジケーターが表示するシンボルの選択; SymbolPeriod - 指標がデータを取る期間の選択; IndicatorColor - インジケータの色; HorisontalShift - 指定されたバー数だけインディケータによって描画されたクオートのシフト; Inverse - true は引用符を逆にします。false - 元のビュー。 ChartVerticalShiftStep - チャートを垂直方向にシフトします (キーボードの上下矢印)。 次は日付を入力できるテキストフィールドの設定で、「Enter」を押すとすぐにジャンプできます。
Was: $249  Now: $99   Market Profile defines a number of day types that can help the trader to determine market behaviour. A key feature is the Value Area, representing the range of price action where 70% of trading took place. Understanding the Value Area can give traders valuable insight into market direction and establish the higher odds trade. It is an excellent addition to any system you may be using. Inspired by Jim Dalton’s book “Mind Over Markets”, this indicator is designed to suit the
The "MR Volume Profile 5" indicator is a charting tool that displays trading volume at different price levels rather than time intervals. A key concept in volume profile is the point of control (POC)—the price level with the highest volume traded during the session or time range. While tools like VWAP or OBV provide volume trends, the "MR Volume Profile 5" indicator offers granular detail about where the most market activity occurs at specific price levels. This makes it a more precise tool for
Was: $299  Now: $99  Supply Demand uses previous price action to identify potential imbalances between buyers and sellers. The key is to identify the better odds zones, not just the untouched ones. Blahtech Supply Demand indicator delivers functionality previously unavailable on any trading platform. This 4-in-1 indicator not only highlights the higher probability zones using a multi-criteria strength engine, but also combines it with multi-timeframe trend analysis, previously confirmed swings a
Daily & Composite Volume Profile   This is a professional-grade market profile tool designed for MetaTrader 5. It utilizes a   Dual-Profile System   to visualize supply, demand, and liquidity concentrations. Key Features Left Side: Daily Session Profiles Automatically identifies the start and end of every trading day. Generates a unique Volume Profile for each individual day. Allows you to see how value migrated from yesterday to today (e.g., Is today's volume higher or lower than yesterday?).
Volume Profile Canvas - Professional Volume Profile Indicator for MetaTrader 5 DESCRIPTION Volume Profile Canvas is a professional volume profile indicator for MetaTrader 5 that renders directly on the chart using a high-performance Canvas engine. It calculates and displays the volume distribution across price levels, identifying the Point of Control (POC), Value Area High (VAH) and Value Area Low (VAL) in real time. This is a pure analysis tool. It does not trade. It gives you an instant vi
MT4 バージョン: https://www.mql5.com/ja/market/product/166784 MT5 バージョン: https://www.mql5.com/ja/market/product/166785 流動性プロファイル 流動性プロファイルは、動的なヒートマップ形式のプロファイルを用いて、チャート上に潜在的な流動性ゾーンをマッピングする、視覚的な市場構造ツールです。 このインジケーターは、過去の価格変動とティックボリュームを分析し、流動性が集中している可能性のある価格帯を強調表示します。描画内容は以下のとおりです。 流動性ライン(潜在的な反応/スイープレベル) ヒートマッププロファイルボックス(流動性集中ゾーン) POC/最大流動性レベル(検出された最高集中度) この結果、トレーダーが以下の点を特定しやすくなる、分かりやすい視覚的なプロファイルが作成されます。 潜在的なマグネットレベル 可能性のあるスイープゾーン 現在の価格の上下の反応エリア エントリー、エグジット、リスク管理のコンテキスト 主な機能 動的な流動性ヒートマッププロファイル
スマート供給需要レクタングルツールインジケーターは、MT5のための究極の相棒です。重要な供給と需要のデータを瞬時に視覚化し、必要な場所—ゾーン上にリアルタイムで表示します。 このツールは、ゾーン分類、ピップ距離、強度、ゾーンサイズなどの豊富で実践的なデータを自動的にゾーン上に重ねて表示します。もう散らかりや推測は不要—明確で動的な洞察があなたの意思決定をサポートします。 トレーダーのために作られ、精密さで動きます。 イントラデイのスキャルピングでも、毎日のチャートの主要なゾーン分析でも、このインジケーターは手動で描いたゾーンを瞬時にインテリジェントなゾーンに変え、ワークフローを中断せずにチャートの情報価値を即座に高めます。 **機能一覧** **自動レベル検出** - チャート上のすべてのゾーンを瞬時に認識。 - 供給または需要として分類—手動タグ付け不要。 **豊富なリアルタイムメトリクス** 表示内容: - ゾーンサイズ - 現在の価格からのライブピップ距離 - ゾーンの強度スコア - ゾーンの年齢(ゾーンが存在した期間) **ライブアップデート** - 価格の動きに合
Poc volume honeyflow
Ali Abdalrasool Ai-sayyd Sobai
POC Highlighter - Volume Profile Indicator This indicator displays the Volume Profile and clearly marks the Point of Control (POC) with a prominent yellow horizontal line. The POC represents the price level with the highest traded volume within the visible chart range or selected period. Key Features: - Automatic calculation and display of Volume Profile histogram at the right side of the chart. - Highlights the POC level with a customizable yellow line (default: solid yellow). - Adjustable p
Introducing PivotWave – your ultimate trading companion that redefines precision and market analysis. Designed with traders in mind, PivotWave is more than just an indicator; it’s a powerful tool that captures the pulse of the market, identifying key turning points and trends with pinpoint accuracy. PivotWave leverages advanced algorithms to provide clear visual signals for optimal entry and exit points, making it easier for traders to navigate volatile market conditions. Whether you are a begin
This Volume Delta Profile is an advanced MetaTrader 5 indicator that visualizes   volume delta (order flow imbalance)   using a volume profile-style histogram. It shows the difference between buying and selling pressure at specific price levels, helping traders identify supply and demand zones. This indicator provides a unique perspective on market dynamics by visualizing the imbalance between buying and selling pressure, offering insights beyond traditional volume analysis. Core Concept Positiv
Infinity Liquidity AI - Premium MT5 Liquidity & Smart Money Indicator Limited Launch Price - Early Buyers Get the Best Deal Infinity Liquidity AI is now available with a limited early-buyer launch price. This is a premium high-quality MT5 indicator, and the price will increase step by step as more traders purchase it. First 2 buyers get it for only $39. Next 4 buyers get it for $49. Next 10 buyers get it for $50. After that, the price will increase by $10 after every 15 buyers until it reache
Gioteen Volatility Index (GVI) - your ultimate solution to overcoming market unpredictability and maximizing trading opportunities. This revolutionary indicator helps you in lowering your losing trades due to choppy market movements. The GVI is designed to measure market volatility, providing you with valuable insights to identify the most favorable trading prospects. Its intuitive interface consists of a dynamic red line representing the volatility index, accompanied by blue line that indicate
MT5用ボリュームプロファイルVPVR ボリュームプロファイルVPVRは、高度なボリュームプロファイル(可視範囲)をチャート上に直接再現する、強力で高性能なMetaTrader 5インジケーターです。取引活動が集中している場所を視覚化することで、市場構造を深く理解し、トレーダーが重要な価格レベルを正確に特定するのに役立ちます。 このインジケーターは、価格レベルごとのボリューム分布を動的に分析し、詳細なヒストグラムをチャート上に直接表示します。これにより、市場の受容ゾーン、拒否ゾーン、流動性クラスターを一目で把握できます。 主な機能 • 可視範囲モードと固定範囲モード VPVR(可視ローソク足に合わせて自動調整)と、より精密な分析のための独自のカスタム範囲をシームレスに切り替えられます。 • ポイントオブコントロール(POC) 取引量が最も多い価格レベル(市場の関心度が最も高いレベル)を自動的に検出し、ハイライト表示します。 • バリューエリア(VAH / VAL) 設定可能なパーセンテージ(デフォルト70%)に基づいてバリューエリアの高値と安値を表示し、適正価格帯を
Trade Like an Institution. Protect Like a Professional. Early Sniper Access: Limited Launch Offer! Get ready to elevate your trading precision. We are offering an exclusive, highly limited launch price for the first Dynamic Trend Sniper users. Our Unbeatable Launch Offer: First 10 Snipers Only: $69 (Full lifetime access + all v1.x updates) Standard Retail Price (After 10 Purchases): $129 Why Act Now? This is not just a discount; it's a strategic entry point. We are committed to rewarding
Candle Time Phases Et Indicator - Split any candle into three time-based phases and control the sequential development of the candle in real time. Candle Time Phases is a precision timing indicator that divides the current candle into three time-based phases as a percentage of its total duration. The indicator determines and clearly separates the initial uncertainty phase, the main movement, and the completion phase, while also analyzing the structure and sequential development of the candle in
FREE
Japanese このインジケーターは、チャートパターンでのトレードを好むトレーダーにとって、高度なチャート分析アシスタントとして機能します。目視での分析負担を軽減し、利益を上げるための精度を高めるように設計されています。 実際の使用においての、このインジケーターの主な利点と特徴は以下の通りです: 1. 自動パターン検出 (Automated Pattern Detection) 時間の節約とバイアスの軽減: 手動でトレンドラインを引く必要はありません。価格のスイングポイント(Pivot High/Low)を検索し、価格構造が条件を満たすと、ライジングウェッジ(上昇楔形)とフォーリングウェッジ(下降楔形)を自動的に描画します。 あらゆる状況を網羅: パターン形成中、ブレイクアウト、さらにはパターン失敗(Failed)まで検出でき、市場の全体像を明確に把握できます。 2. ターゲットとフィボナッチTPの内蔵 (Built-in Targets & Fibonacci TP) ターゲットを自動計算: ブレイクアウトが発生すると、システムはウェッジの開き幅に基づいてメインターゲットの距離を即
Description: The Volume Profile displays detailed informations of historical trading activities at certain price levels (Market Profile). Locate the areas with the best prices in the market and get an advantage over other market participants. Features: Customizable Market Profile Shows the "fair" Value Area with 70% of all Volume Shows critical low volume zones Shows VPOC, VAL and VAH Points integrated resource management to reduce the load while working with multiple charts Works on all timefr
VPO Profile MT5
Kyra Nickaline Watson-gordon
5 (2)
Definition : VPO is a Volume Price Opportunity. Instead of using bars or candles with an Open, High, Low, and Close price, each "bar" in a Market Profile is represented by horizontal bars against the price It is called Market Profile terminology. In other words volume-price-opportunity (VPO) profiles are histograms of how many volumes were traded at each price within the span of the profile. By using a VPO chart, you are able to analyze the amount of trading activity, based on volume, for each
An ICT fair value gap is a trading concept that identifies market imbalances based on a three-candle sequence. The middle candle has a large body while the adjacent candles have upper and lower wicks that do not overlap with the middle candle. This formation suggests that there is an imbalance where buying and selling powers are not equal. Settings Minimum size of FVG (pips) -> FVGs less than the indicated pips will be not be drawn Show touched FVGs Normal FVG color -> color of FVG that hasn't
FREE
The Sessions and Bar Time indicator is a professional utility tool designed to enhance your trading awareness and timing precision on any chart. It combines two key features every trader needs — market session visualization and real-time bar countdown — in one clean, efficient display. Key Features: Candle Countdown Timer – Shows the remaining time before the current candle closes, helping you anticipate new bar formations. Market Session Display – Automatically highlights the four main trading
FREE
This indicator allows you to enjoy the two most popular products for analyzing request volumes and market deals at a favorable price: Actual Depth of Market Chart Actual Tick Footprint Volume Chart This product combines the power of both indicators and is provided as a single file. The functionality of Actual COMBO Depth of Market AND Tick Volume Chart is fully identical to the original indicators. You will enjoy the power of these two products combined into the single super-indicator! Below is
Advanced Volume Profile Analysis Tool for MetaTrader 5 The Kecia Volume Profile Order Finder provides traders with volume profile analysis capabilities. This MT5 indicator combines volume profile visualization with statistical calculations to help identify potential trading opportunities and suggests entry, stop loss, and take profit levels based on market structure. Market Profile Visualization Transform your chart with customizable volume profile visualizations: Multiple visualization options
この指標は、指定されたバー数の作業ヒストグラム上の最大および最小価格ボリューム(市場プロファイル)のレベルを検索します。   合成のプロフィール。 ヒストグラムの高さは完全に自動化されており、あらゆる計測器と時間枠に適応します。 著者のアルゴリズムが使用され、よく知られている類似体を繰り返さない。 二つのヒストグラムの高さは、ろうそくの平均高さにほぼ等しい。 スマートアラートは、ボリュームレベルに関する価格を通知するのに役立ちます。 コンセプトSmart Money 。 Low Volume - Imbalance. は、良い市場の文脈を見つけ、市場の構造を決定し、バイナリオプションのフィルタとして使用されます。 それは価格のための磁石です。 High Volume - Liquidity. は、累積を終了するときのテストに使用されます。 入力パラメータ 。 基本 。 Bars Count - カウントして表示するバーの数 。 Signal Fractal = 5 (色信号のレベルのために)。 レベルは、次の条件の下で信号になります:それを超えない上部と下部に五つのヒストグラムが
Koala Supply Demand のご紹介 Koala Supply Demand インジケーターへようこそ。このインジケーターは、異なる時間足における 未ブレイクの供給・需要ゾーン を識別するために設計されています。このインジケーターは、トレーダーが市場をゾーンエリアとして視覚的に把握するのに役立ちます。価格が強力なゾーンをどのように尊重しているかを見ることができ、またゾーン内部で形成された場合にはプライスアクションシグナルも表示します。 Supply Demand Robot で自動取引 — Koala Supply Demand シグナルを利用した高度な EA : ダウンロード MSB コンセプトと Supply and Demand を組み合わせた 最も関連性の高い製品 はこちらで利用可能です :   ダウンロード Koala Supply Demand の MT4 バージョン も利用可能です :   ダウンロード さらに多くの無料製品を入手 するために私の MQL5 チャンネルへ参加してください :   参加 主な特徴: チャート上バックテスト機能:  独自の On
FREE
The MarketProfileTPO indicator for MetaTrader 5 is a powerful tool designed to bring the Market Profile concept, based on Time Price Opportunity (TPO) analysis , directly onto your main chart window. This indicator calculates and displays the price distribution over a specified period, highlighting key areas of market activity and concentration. It is particularly optimized for high-volatility instruments like NAS100, US30, and XAUUSD when used on the M1 (1-minute) timeframe, offering a detailed
Flow Architect Lite - Professional Market Structure Toolkit Free Version Features: Core Structure Analysis: Daily VWAP Engine   - Volume-weighted average price for institutional level tracking Standard Deviation Bands (SD1)   - Dynamic support and resistance zones Break of Structure Detection   - Visual markers for market structure shifts Fair Value Gap Identification   - Highlighted imbalance zones on your charts ATR Volatility Context   - Real-time Average True Range measurement Clean Informat
Cumulative Volume Delta (CVD) MA-X Plus:究極のオーダーフロー・フレームワーク CVD MA-X Plus で、市場の隠されたメカニズムを解き明かしましょう。標準的なボリューム指標は「どれだけ取引されたか」を伝えるだけですが、CVD MA-X Plusは、 誰が 戦いに勝っているのか、 いつ 勝っているのか、そして「 スマートマネー 」が どこに 定着しているのかを明らかにします。ティックレベルのプライスアクション(株式/先物/ゴールドなどの規制市場ではリアルボリュームに設定可能)と多層的なボリューム分布を集計することで、このインジケーターは市場の確信、枯渇、そして流動性の極めて鮮明なマップを提供します。これは、こちら( https://www.mql5.com/en/market/product/162375?source=Site+Profile+Seller )にあるCVD MA-Xの進化版です。 トレーダーの優位性:なぜPlus版にアップグレードするのか? 多くのトレーダーが失敗するのは、遅行するプライスアクションに反応してしまうからです。
インジケーター技術仕様 – Delta Profile for MetaTrader 5 Delta Profile は MetaTrader 5 用に開発されたインジケーターで、指定されたローソク足範囲内の出来高フローを詳細に分析するためのものです。異なる価格レベルにおける正の出来高(上昇に関連)と負の出来高(下降に関連)の不均衡を構造化し、可視化します。その結果、ユーザーは最も多くの取引が集中する価格帯や実際の市場不均衡が形成される領域を明確に把握できます。 以下に、本インジケーターの主要な技術特性と設定パラメータを示します。 基本コンセプト インジケーターは 価格レベル を識別し、それらを正の出来高、負の出来高、および純 Delta(正負の出来高差)に分類します。 各価格レベルは 水平バー としてチャートに表示され、市場の活動ゾーンや不均衡領域を視覚的に確認できます。 ユーザーは 分析対象ローソク足数 、 価格の丸め精度 、 最大表示レベル数 、および 表示スタイル を自由に設定できます。 主要機能 価格レベルのマッピング :設定された精度に基づき価格を丸め、対応するローソク足の
このプロダクトを購入した人は以下も購入しています
SignalTech MT5 is an unique fully rule based trading system for EURUSD, USDCHF, USDJPY, AUDUSD, NZDUSD, EURJPY, AUDJPY, NZDJPY, CADJPY.  All the winning trades with chart setups are published on the comments page. 2026-05 3493 Pips (Until 05-21 NY Closed) 2026-04 2243 Pips 2026-03 2165 Pips 2026-02 2937 Pips 2026-01 2624 Pips 2025-12 1174 Pips It can generate signals with Buy/Sell Arrows and Pop-Up/Sound Alerts. Each signal has clear Entry and Stop Loss levels, which should be automatically flag
Azimuth Pro
Ottaviano De Cicco
5 (7)
Azimuth Pro V2:MT5向けシンセティック・フラクタル構造分析と確認済みエントリー 概要 Azimuth Pro は Merkava Labs によるマルチレベルスイング構造インジケーターです。4つのネストされたスイングレイヤー、スイングアンカーVWAP、ABCパターン検出、3タイムフレーム構造フィルタリング、そして確定バーでの確認済みエントリー — 1つのチャートで、ミクロスイングからマクロサイクルまでを網羅するワークフロー。 これはブラインドシグナル製品ではありません。ロケーション、コンテキスト、タイミングを重視するトレーダーのための構造ファーストワークフローです。 V2発売記念オファー — Azimuth Pro V2をUSD 399で(次の100本)。最終価格:USD 499。 1. V2での変更点 シンセティック・マルチタイムフレームエンジン 上位タイムフレーム分析をMeridian Proと同じ独自のシンセティックアーキテクチャで一から再構築。よりクリーンなHTFコンテキスト、安定したライブ動作、従来のMTF同期問題なし。シンセティックエンジンは 固定比率タ
ARIPoint
Temirlan Kdyrkhan
1 (1)
ARIPoint is a powerful trading companion designed to generate high-probability entry signals with dynamic TP/SL/DP levels based on volatility. Built-in performance tracking shows win/loss stats, PP1/PP2 hits, and success rates all updated live. Key Features: Buy/Sell signals with adaptive volatility bands Real-time TP/SL/DP levels based on ATR Built-in MA Filter with optional ATR/StdDev volatility Performance stats panel (Success, Profit/Loss, PP1/PP2) Alerts via popup, sound, push, or email Cu
GEM Signal Pro GEM Signal Pro は、MetaTrader 5 向けのトレンドフォロー型インジケーターです。より明確なシグナル、より整理されたトレードセットアップ、そして実用的なリスク管理をチャート上で確認したいトレーダーのために設計されています。 単純な矢印だけを表示するのではなく、GEM Signal Pro はトレード全体の考え方を、より見やすく分かりやすい形で表示します。条件が確認されると、インジケーターはエントリー価格、ストップロス、利確目標をチャート上に表示し、トレードセットアップをより効率的に確認できるようにします。 動作の仕組み このインジケーターは、まず内部ロジックに基づいて有効なシードシグナルを検出します。 確認条件が満たされると、GEM Signal Pro はチャート上に完全なセットアップを表示します。これにより、トレーダーはトレード構造をより明確に把握し、手作業による分析を減らすことができます。 チャート上のトレードレベル 確認済みシグナルに対して、GEM Signal Pro は以下を表示できます。 エントリー価格 ストップロス テ
MetaTrader 5 向けスマート多層ブレイクアウト&プルバック検出器 「スマート・シンプル・ファスト!」 高確率のブレイクアウトエントリーを見逃すことにうんざりしていませんか? 複数のチャートを何時間もスキャンし、ブレイクアウトをトレンド方向と通貨のモメンタムに合わせようとして、それでも動きを逃してしまうことはありませんか? Break Pullback は、1つのインジケーターでそのすべてを解決します。 Break Pullback とは何ですか? Break Pullback は、マーケットストラクチャー、ブレイクアウト、トレンド継続のセットアップを取引するトレーダー向けに特別に設計されたプロフェッショナルグレードの MetaTrader 5 インジケーターです。 リアルタイムで複数の通貨ペアにわたるブレイクとプルバックの形成を自動的に検出し、3層の確認を通じてすべてのシグナルをフィルタリングします: ストラクチャラルブレイクアウト検出 — チャート上の主要なブレイクレベルを特定 HTF 日足バイアス — エントリーを支配的な日足トレンド方向に合わせる 通貨強弱指数 —
OmniSync Projection
Antonio-alin Teculescu
5 (1)
Chronos Fractal Engine is an innovative price projection indicator for MetaTrader 5, designed to transform your technical analysis by intelligently identifying and projecting historical price patterns. Built upon an advanced correlation algorithm and the fractal principles of the market, this powerful tool visualizes potential future price movements, giving you a unique edge in your trading decisions. What is Chronos Fractal Engine? At its core, the Chronos Fractal Engine employs a sophisticat
ARICoin is a powerful trading companion designed to generate high-probability entry signals with dynamic TP/SL/DP levels based on volatility. Built-in performance tracking shows win/loss stats, PP1/PP2 hits, and success rates all updated live. Key Features: Buy/Sell signals with adaptive volatility bands Real-time TP/SL/DP levels based on ATR Built-in MA Filter with optional ATR/StdDev volatility Performance stats panel (Success, Profit/Loss, PP1/PP2) Alerts via popup, sound, push, or email Cust
Big Player Range
Thalles Nascimento De Carvalho
5 (3)
BigPlayerRange — MT5向け最強インジケーター BigPlayerRange は、MetaTrader 5 で日経ミニやドル先物などの取引において、 最も効果的なインジケーター と評価されています。大口投資家(機関投資家)の行動を可視化し、高精度なテクニカル分析を可能にします。 どのように機能するのか? BigPlayerRangeは、買い圧力ゾーン(緑ライン)と売り圧力ゾーン(赤ライン)を描画し、価格がその範囲を超えるとトレンド方向への動きを示唆します。 緑のライン上で終値: 買いの勢いが強く、上昇トレンドの可能性。 赤のライン下で終値: 売り圧力が優勢で、下落が予想される。 範囲内での価格: レンジ相場でブレイクを待つ段階。 主なメリット: 機関投資家ゾーンの検出: 大口のエントリーポイントを視覚化。 自動ターゲット計算: 利確ポイントを戦略的に設定。 プルバックの可能性分析: リスク管理に役立つ情報提供。 推奨の使い方: Imbalance DOM Pro と併用してゾーンブレイクを確認。 SwingVolum
「 Dynamic Scalper System MT5 」インジケーターは、トレンド波の中でスキャルピング取引を行う手法のために設計されています。 主要通貨ペアと金でテスト済みで、他の取引商品との互換性があります。 トレンドに沿った短期的なポジションオープンのシグナルを提供し、追加の価格変動サポートも提供します。 インジケーターの原理 大きな矢印はトレンドの方向を決定します。 トレンド波の中では、小さな矢印の形でスキャルピングシグナルを生成するアルゴリズムが機能します。 赤い矢印は強気方向、青い矢印は弱気方向です。 トレンドの方向には敏感な価格変動ラインが描かれ、小さな矢印のシグナルと連動します。 シグナルは次のように機能します。適切なタイミングでラインが現れるとエントリーシグナルが形成され、ラインが開いている間はポジションが保持され、完了すると取引が終了します。 推奨される動作時間枠はM1~H4です。 矢印は現在のローソク足に形成され、次のローソク足が開いている場合は、前のローソク足の矢印は再描画されません。 入力パラメータ Trend Wave Period - トレ
AriX
Temirlan Kdyrkhan
1 (4)
AriX Indicator for MT5 A powerful trend-following and signal-evaluation tool AriX is a custom MT5 indicator that combines Moving Averages and ATR-based risk/reward logic to generate clear buy/sell signals. It visualizes dynamic SL/TP levels, evaluates past trade outcomes, and displays win/loss statistics in a clean on-chart panel. Key features include: Buy/Sell signals based on MA crossovers ATR-based SL/TP1/TP2/TP3 levels with visual lines and labels Signal outcome tracking with real-time stat
CGE Trading Suite
Carl Gustav Johan Ekstrom
5 (2)
Institutional-Grade Analytics for MT5 C GE Trading Suite delivers the analytical edge typically reserved for professional trading desks. The platform integrates a full suite of analytical tools into one seamless workflow: dynamic grid mapping, liquidity behavior analysis, ECM, trend lines, MIDAS, trade cycles, and directional channel projections. Together, these provide a unified view of market structure and momentum. Directional clarity is further enhanced by the capital flow index, which meas
UZFX SWS {スキャルピング・ウィニング・シグナルズ} Pro v1.0 は、Usman Zabir(UZFX LABS)が開発した強力なノンリペインティング指標です。急変する市場で正確なエントリーシグナルを求めるスキャルパー、デイトレーダー、スイングトレーダー向けに特別に設計されています。遅延や誤った再描画のない、信頼性の高いリアルタイムシグナルを求めるトレーダーに最適です。 私のおすすめ* 最適時間枠:30分以上。 {1時間} が私のお気に入りです。そして結果は驚くべきもの...! 注:{ LTL 164343 }インジケーターと組み合わせることで、シグナルの勝率を高めることができます。 LTLシグナルでトレンドを判断し、SWSシグナルをエントリーシグナルとして活用してください。 このアプローチにより勝率が最大化され、誤ったシグナルの発生を防ぐことができます。 主な機能: 直近および過去のシグナルを明確な視覚的矢印で表示(古いシグナルを点で表示するオプション付き)。 取引ラインの自動計算・描画:エントリー、ストップロス(直近のスイングロー/ハイに基づく)、複数テイクプロフ
Hidden Trend Channel Project 17 Tool SPECIAL NOVEMBER SALE is now finished. Price goes back to normal.  This is an Automated Tool for Multi Timeframe Trend Channel Analysis Visualization with Intelligent Range Market, Trending Market, Reversal, Breakout Detection.  It draws multiple Trend Channels with multiple sub-trendlines levels inside the channel for perfectly give you the trader, the crystal clear Trend channels where price trend direction is moving. This tool is accurately useful for T
OrderFlow Absorption – MT5用プロフェッショナル・デルタ&アブソープションシグナルインジケーター OrderFlow Absorptionで本物のオーダーフロー分析の力を解き放ちましょう。MetaTrader 5向けの究極のデルタヒストグラム&アブソープションシグナルインジケーターです。あらゆる価格変動の裏側で何が起きているのかを知りたいトレーダーのために設計されており、市場を動かす隠れた買い/売り圧力や吸収イベントを明らかにします。 特徴 デルタヒストグラムの可視化:   買い圧力・売り圧力を色分けされたヒストグラムで即座に表示。 アブソープションシグナル検出:   高度なロジックで強気・弱気の吸収イベントを特定し、反転の兆しを早期に通知。 チャートマーカー:   吸収シグナルをチャート上に直接マークし、視覚的に分かりやすく表示。 ポップアップアラート:   新しい吸収シグナルが出現した際にリアルタイムで通知。 カスタマイズ可能な閾値:   弱いシグナルを除外し、高確率のセットアップに集中。 リソース管理:   大きなチャートでも高速に動作する効率的な計算。
BTCUSD PRO Signal Solution for MT5 BTCUSD PRO is a decision-support indicator for MetaTrader 5, designed for traders who analyze BTCUSD or BTCUSD# with a structured signal workflow. The product is not an automated trading system. It does not open, close, or manage trades automatically. It provides analytical buy and sell signal information and displays a visual trade plan on the chart so the user can make their own trading decisions. Main purpose BTCUSD PRO is designed for traders who prefe
First time on MetaTrader, introducing IQ Star Lines - an original Vedic Astrology based indicator. "Millionaires don't use astrology, billionaires do" . - J.P. Morgan, Legendary American financier and banker. Welcome to  the new and updated  IQ Star Lines , the ultimate fusion of ancient planetary harmonic cycles and modern quantitative trading. published for the   first time on Metatrader. This is an indicator built by the developer, who has spent almost 2 decades trading while studying Vedic
UZFX {SSS} スキャルピング・スマートシグナル MT5は、変動の激しい市場において正確かつリアルタイムのシグナルを求めるスキャルパー、デイトレーダー、スイングトレーダー向けに設計された、リペイントしない高性能な取引インジケーターです。(UZFX-LABS)によって開発されたこのインジケーターは、価格行動分析、トレンド確認、スマートフィルタリングを組み合わせることで、すべての通貨ペアおよび時間軸において、高確率の売買シグナルを生成します。 推奨* 最適な時間足:15分足以上。 {1時間足}が私のお気に入りです。そして、その成果は驚くべきものです...! 注:{ LTL 164343 }インジケーターと組み合わせることで、シグナルの勝率を高めることができます。 LTLシグナルでトレンドを判断し、SSSシグナルをエントリーシグナルとして活用してください。 このアプローチにより勝率が最大化され、誤ったシグナルの発生を防ぐことができます。 主な機能 スマートシグナル検出 – 強力なトレンド反転や継続パターンを正確に特定します。 マルチタイムフレーム・スキャルピング – すべての時間
==================================================================== SMC Pro v6.1 APEX AI — XAUUSD Gold Empire MetaTrader 5 Indicator · Smart Money Concepts · Predictive Intelligence Engine ==================================================================== SMC Pro v6.1 APEX AI is a professional Smart Money Concepts indicator system built exclusively for XAUUSD (Gold) on MetaTrader 5. It combines the complete SMC framework — Order Blocks, Liquidity sweeps, Fair Value Gaps, Break of Structure,
マーケットメーカーのためのツール。 Meravith は次の機能を提供します: すべての時間足を分析し、現在有効なトレンドを表示します。 強気と弱気の出来高が等しくなる流動性ゾーン(出来高均衡)を強調表示します。 異なる時間足のすべての流動性レベルをチャート上に直接表示します。 テキスト形式の市場分析を生成し、参考情報として表示します。 現在のトレンドに基づいて目標値、サポートレベル、ストップロスを計算します。 取引のリスクリワード比を算出します。 口座残高に基づいてポジションサイズを計算し、潜在的な利益を推定します。 また、市場に大きな変化があった場合には警告を表示します。 インジケーターの主要ライン: 強気/弱気の出来高エグゾーストライン ― 目標値として機能します。 市場のトレンドを示すライン。市場が強気か弱気かによって色が変わり、トレンドのサポートとして機能します。主にその色が市場センチメントを示します。 出来高均衡ライン(Eq)。Eq(Volume Equilibrium)ラインはシステムの中核です。これは買い手と売り手の出来高のバランスポイントを表します。市場の流動性を示し
note: this indicator is for METATRADER4, if you want the version for METATRADER5 this is the link:  https://www.mql5.com/it/market/product/108106 TRENDMAESTRO ver 2.5 TRENDMAESTRO recognizes a new TREND from the start, he never makes mistakes. The certainty of identifying a new TREND is priceless. DESCRIPTION TRENDMAESTRO identifies a new TREND in the bud, this indicator examines the volatility, volumes and momentum to identify the moment in which there is an explosion of one or more of these da
Introducing Assembler:  The best value for money,  Designed for advanced traders and professionals, yet accessible for ambitious beginners ready to elevate their trading game. Great for ICT, SMC, TREND and breakout traders . Combining advanced analytics, a sleek graphical interface, and highly customizable features, Assembler empowers you to trade with precision, clarity, and confidence. Key Features of Assembler 1. Dynamic Graphical User Interface (GUI): A fully draggable, customizable interf
プレミアムレベルは、正しい予測の精度が80%を超える独自の指標です。 この指標は、最高のトレーディングスペシャリストによって2か月以上テストされています。 あなたが他のどこにも見つけられない作者の指標! スクリーンショットから、このツールの正確さを自分で確認できます。 1は、1キャンドルの有効期限を持つバイナリーオプションの取引に最適です。 2はすべての通貨ペア、株式、商品、暗号通貨で機能します 手順: 赤い矢印が表示されたらすぐにダウントレードを開き、青い矢印が表示されたら閉じます。青い矢印の後に開くこともできます。 試してテストしてください!推奨設定はデフォルトです! 日足チャートで最高の精度を示します! インディケータは、2600 Pipsの収益性に対して、約10Pipsという非常に小さなマージンを使用します。
MATADOR GOLD XAUUSD M5 Scalp Signals for MT5 MATADOR GOLD is a decision-support indicator for MetaTrader 5, designed for traders who analyze short-term Gold movement on the M5 timeframe. The indicator does not open, close, or manage trades automatically. It provides buy and sell signal guidance so the user can make their own trading decisions according to their risk plan, broker conditions, and trade management rules. Main purpose MATADOR GOLD is built to help traders avoid noisy signal flow and
このインジケーターは、市場で 関心が示されたゾーン をハイライトし、その後に 注文の蓄積ゾーン を表示します。 これは、大規模な**板情報(オーダーブック)**のように機能します。 これは、 巨大な資金 のためのインジケーターです。その性能は卓越しています。 市場にどんな関心が存在していても、 必ず目に見えるようになります 。 (これは 完全に再設計され、自動化されたバージョン です。もはや手動分析は必要ありません。) トランザクションスピード(取引速度) は新しい概念のインジケーターで、市場で大口注文が どこに・いつ 集中しているかを示し、それに基づいたチャンスを提供します。 トレンドの変化を 非常に早い段階 で察知することができます。 FXでは「出来高」と呼ばれているものは誤解されています。実際には、これは 時間あたりの価格変動量 です。したがって、正しい名称は トランザクションスピード です。 考え方・行動・分析の仕方すべてが問われます。 分析パラダイムの転換は非常に重要です。 このインジケーターは、FXにおける出来高の考え方を 根本から再定義 し、論理的な形で正確に活用する、
A tool for on-chart strategy backtesting and performance analysis. A utility for developing, debugging, and testing custom trading ideas and indicator functions. An indicator designed to quickly test trading concepts and visualize the effectiveness of different input parameters. An all-in-one sandbox for testing everything from simple crossovers to complex, multi-condition trading systems.
+++++++++++++++++++++++++++++++++++++++++++++++++++++++++++++++++++++++++++++++++++++++++++++++++ +++ Link to EURUSD Only Free Version -->  https://www.mql5.com/en/market/product/156904?source=Unknown +++++++++++++++++++++++++++++++++++++++++++++++++++++++++++++++++++++++++++++++++++++++++++++++++ Hallo Trader, This is a traditional GANN & FIBONACCI strategy based on detection of an impulsive move in the opposite direction. This is called a Breakout. At the moment of Breakout, the indicator draw
Footprint は、オーダーフロー(Order Flow)と出来高分析のためのインジケーターです。 クラスターレベルでの市場構造の特定、アクティビティの高い主要ゾーンの発見、そして設定ウィンドウを毎回開くことなくチャート上で直接フィルター操作を行うのに役立ちます。 Footprintインジケーターの機能 Bid x Ask、Deltaのクラスターチャート; チャート上のコントロールパネル; フィルター調整用のスライダー; Absorption; Initiative; Stacked Imbalances; Big Trades; dPOC / Dynamic Point of Control; Delta; サイドマーケットプロファイル; 累積デルタ(Cumulative Delta)。 主な利点 高密度のティックフローに対する高速な計算とデータ表示; チャート内管理 — 設定を開くことなく、主要モードとフィルターを直接切り替え可能; 重要な価格レベルとクラスターを強調するためのフィルタリング; シグナルの視覚的ハイライト:吸収、主導権、インバランス、大口取引; 日、週、または現
Pointer Trend Switch — precision trend reversal indicator Pointer Trend Switch is a high-precision arrow indicator designed to detect key moments of trend reversal based on asymmetric price behavior within a selected range of bars. It identifies localized price impulses by analyzing how far price deviates from the opening level, helping traders find accurate entry points before a trend visibly shifts. This indicator is ideal for scalping, intraday strategies, and swing trading, and performs equa
Weis Wave with Alert MT5
Trade The Volume Waves Single Member P.C.
4.94 (17)
Rental/Lifetime Package Options and Privileges  Rent Monthly Six Months   Yearly/Lifetime Weis Wave with Speed with Alert+Speed Index x x x Manual  x x x Quick Set up Video x x x Blog x x x Lifetime Updates x x x Setup and Training Material x x Discord Access Channel "The SI traders"          x Rectangle Break Alert Tool      x How to trade with it:    http://www.tradethevolumewaves.com   ** If you purchase please contact me to setup your  : Training Room and  complete manual access.  Wei
この位置が買いに適しているかどうかの判断をサポートします。 この位置が売りに適しているかどうかの判断をサポートします。 4つの指標が同時に底に達した場合は、反発のチャンスに注目してください。 4つの指標が同時に天井付近にある場合は、下落のチャンスに注目してください。 本システムは、中国の先進的なアルゴリズム技術と高度な数学モデリング体系に基づいて構築されています。 私は主に XAUUSD M5 でこの指標を使用しており、この時間足が最も良い結果を示します。 この指標のアルゴリズムと数式は非常に複雑なため、テスト時に動作が遅くなる場合があります。テストでは、リペイントの有無と遅れの有無を確認してください。正式版では実際の使用時により安定します。 この指標システムはリペイントせず、未来データも使用しません。ご購入前にご自身でテストしてご確認いただけます。 この指標には完全にカスタマイズ可能なアラートシステムが搭載されており、以下のリンクからご確認いただけます。 正式に使用する前に、完全な使用説明を十分にお読みください。 ご不明な点がございましたら、どうぞお早めにご連絡ください。できるだけ早
フィルタ:
レビューなし
レビューに返信