Pattern Detector

CandlePatternDetector v2.0

MT5 Custom Indicator — Full Description & User Guide

What This Indicator Does

CandlePatternDetector is a MetaTrader 5 chart indicator that automatically scans every closed bar on your chart and identifies 8 key candlestick reversal patterns in real time. When a pattern is found, it places a coloured arrow directly above or below the signal candle — green for bullish signals, red for bearish signals.

Every signal is context-aware: the indicator reads the current market trend at each bar and uses that to decide whether a pattern is a bullish reversal or a bearish reversal. The same candle shape can mean different things in different conditions, and the indicator handles this automatically.

All visual settings, pattern toggles, and style controls are accessible directly from an interactive on-chart panel — no need to open the settings dialog to change anything during live trading.

Detected Patterns

All 8 patterns fire in both directions. The trend context at the signal bar determines whether the arrow is green (bullish) or red (bearish).

Pattern Shape Description Bullish Meaning Bearish Meaning
Dragonfly Doji Long lower shadow, tiny body at the top, almost no upper shadow Buyers rejected a push lower; reversal up likely Indecision at resistance; potential stall or reversal down
Gravestone Doji Long upper shadow, tiny body at the bottom, almost no lower shadow Indecision at support; potential bounce Sellers rejected a push higher; reversal down likely
Hammer Small body in upper portion, lower wick at least 2× the body, minimal upper wick Classic bullish reversal at lows (Hammer) Bearish warning at highs — same shape is called a Hanging Man
Inverted Hammer Small body in lower portion, long upper wick at least 2× the body, minimal lower wick Buyers tested higher and almost held; reversal up likely Bearish signal at highs — same shape is called a Shooting Star
Shooting Star Identical shape to Inverted Hammer (separate toggle for independent control) Bullish in downtrend context Classic bearish reversal at highs
Morning Star 3 candles: large bearish → small-body star → bullish close past the midpoint of candle 1 Strong bullish reversal — exhaustion of sellers In uptrend: three-bar exhaustion warning
Evening Star 3 candles: large bullish → small-body star → bearish close below the midpoint of candle 1 In downtrend: three-bar capitulation/reversal signal Strong bearish reversal — exhaustion of buyers
Engulfing Current candle body completely contains the prior candle body (both bull and bear variants) Bullish Engulfing: bull bar swallows prior bear bar Bearish Engulfing: bear bar swallows prior bull bar

Note on Inverted Hammer vs Shooting Star: These are the same candle shape. The indicator keeps them as separate panel toggles so you can enable one context and disable the other. For example: enable Shooting Star (bearish) but disable Inverted Hammer (bullish) if you only want to trade that shape in uptrends.

Signal Logic

For every fully closed bar (bar index ≥ 1): 1. Detect trend → Uptrend or Downtrend 2. Check all enabled patterns against that bar's OHLC 3. If pattern found: Downtrend → Green arrow below the candle (bullish reversal) Uptrend → Red arrow above the candle (bearish reversal)

Signals are placed only on fully closed bars. The current (forming) bar is never marked. This means the indicator does not repaint — once an arrow appears it stays exactly where it was placed.

Trend Detection

You choose the trend method in the input settings. Two methods are available:

Moving Average (default) The bar's closing price is compared to the MA value at that bar.

  • Close > MA → Uptrend → bearish signal context
  • Close < MA → Downtrend → bullish signal context

Configure with: MA Period, MA Type (SMA/EMA/SMMA/LWMA), MA Applied Price.

Market Structure Looks back N bars and finds the highest high and lowest low of that range. The midpoint of that range is used as the trend divider.

  • Close > midpoint → Uptrend
  • Close < midpoint → Downtrend

Configure with: Structure Lookback (bars).
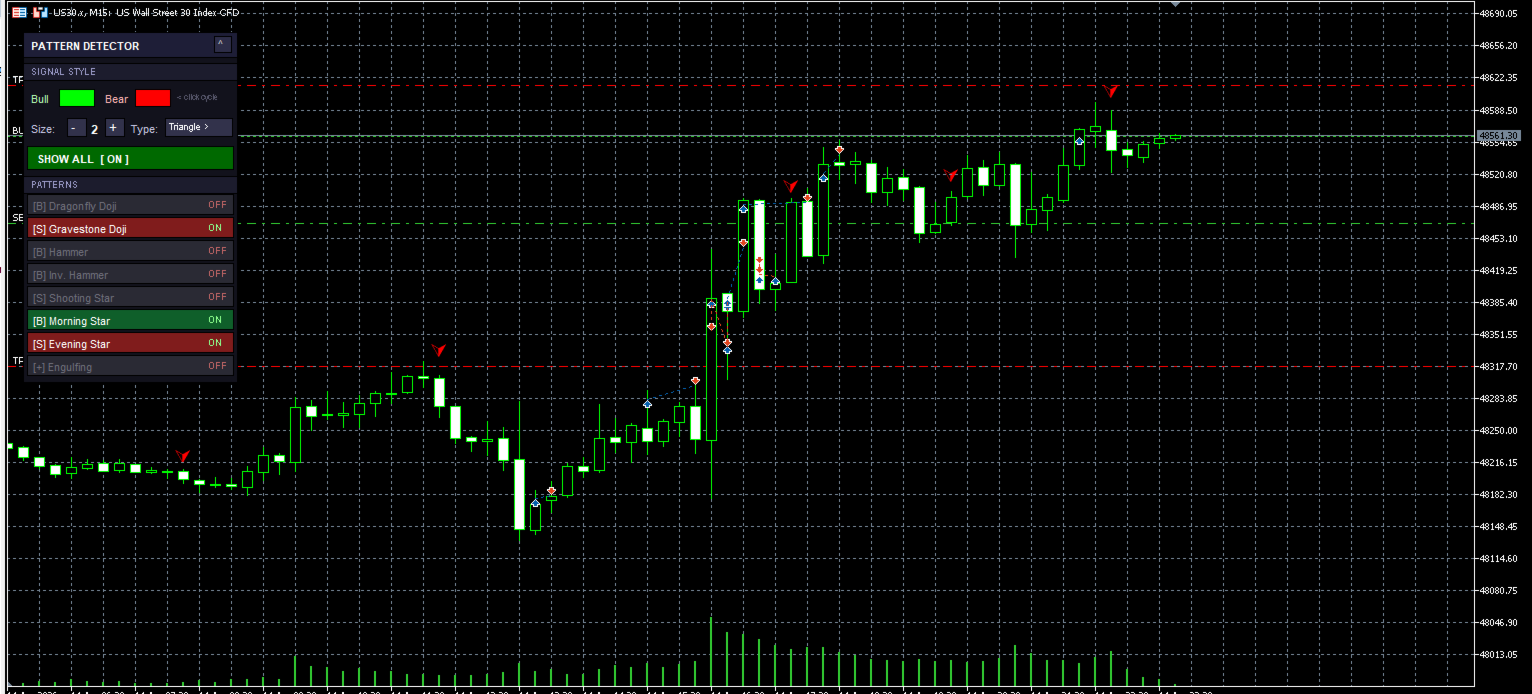
The On-Chart Panel

The panel is displayed directly on the chart and gives you full real-time control without opening any dialog.

┌────────────────────────────────┬────┐
│  PATTERN DETECTOR              │ ^  │  ← Click ^ to minimise
├────────────────────────────────┴────┤
│  SIGNAL STYLE                       │
│  Bull [████]  Bear [████]  <click   │  ← Click swatches to cycle colour
│  Size:  [ - ] [ 2 ] [ + ]           │
│  Type:  [ Arrow >        ]          │  ← Click to cycle arrow type
├─────────────────────────────────────┤
│  [ SHOW ALL  [ ON ]               ] │  ← Master signal toggle
├─────────────────────────────────────┤
│  PATTERNS                           │
│  [B] Dragonfly Doji          ON  ]  │
│  [S] Gravestone Doji         ON  ]  │
│  [B] Hammer                  ON  ]  │
│  [B] Inv. Hammer             ON  ]  │
│  [S] Shooting Star           ON  ]  │
│  [B] Morning Star            ON  ]  │
│  [S] Evening Star            ON  ]  │
│  [+] Engulfing               ON  ]  │
└─────────────────────────────────────┘

Signal Style Controls (inside the panel)

Control How to use Effect
Bull colour swatch Click to cycle through 5 colours: Lime → Green → Aqua → Yellow → White Changes colour of all bullish arrows instantly
Bear colour swatch Click to cycle through 5 colours: Red → OrangeRed → Magenta → Orange → HotPink Changes colour of all bearish arrows instantly
Size − / + Click − or + to decrease or increase Arrow size 1 (smallest) to 5 (largest); updates all markers instantly
Type Click to cycle: Arrow → Triangle → Dot → Star Changes arrow wingdings code on all markers instantly

Pattern Controls

Control Action
SHOW ALL [ ON / OFF ] Master switch — hides or reveals every signal arrow on the chart at once. Individual pattern states are remembered and restored when you turn it back ON.
Individual pattern row Click anywhere on the row to toggle that pattern ON (coloured) or OFF (grey). Signals for that pattern are immediately hidden or shown.
^ / v (header) Minimises the panel to just the header bar to save chart space. Click again to restore.

Pattern Row Colours

Row colour Meaning
Green Pattern is ON and primarily bullish
Red Pattern is ON and primarily bearish
Blue Pattern is ON and covers both directions (Engulfing)
Grey Pattern is OFF — no signals will appear

Input Parameters

Trend Detection

Parameter Default Description
Method Moving Average Switch between MA-based or Market Structure trend detection
MA Period 50 Number of bars used to calculate the moving average
MA Type EMA Smoothing method: SMA, EMA, SMMA, or LWMA
MA Price Close Which price the MA is applied to
Structure Lookback 10 How many bars back to look for HH/LL when using Market Structure mode

Pattern Sensitivity

Parameter Default Description
Doji Body % 5.0 A candle qualifies as a Doji only if its body is ≤ this % of total range. Lower = stricter.
Hammer Body % 33.0 Max body size as % of range for Hammer, Inverted Hammer, Shooting Star.
Hammer Wick Ratio 2.0 Minimum ratio of the dominant wick to the body. Higher = longer wick required.
Star Body % 30.0 Max body size % for the middle candle of Morning/Evening Star.

Alerts

Parameter Default Description
Popup alert Off Shows a dialog box when a new signal appears on the last closed bar
Sound alert Off Plays a sound file when a new signal appears
Push notification Off Sends a push notification to your mobile MT5 app (requires MT5 mobile linked)
Sound file alert.wav Filename of the sound — must exist in your MT5 installation's Sounds folder

Alerts only fire on bar index 1 (the most recently closed bar) and only once per bar, so a full chart recalculation never triggers a flood of alerts.

Panel Position

Parameter Default Description
X offset 15 Horizontal distance from the top-left corner of the chart in pixels
Y offset 30 Vertical distance from the top-left corner of the chart in pixels

Installation

  1. Open MetaTrader 5
  2. Go to File → Open Data Folder
  3. Navigate to MQL5 → Indicators
  4. Copy CandlePatternDetector.mq5 into that folder
  5. In MT5, open the Navigator panel (Ctrl+N)
  6. Right-click IndicatorsRefresh
  7. Double-click CandlePatternDetector or drag it onto any chart
  8. Set your preferred inputs in the dialog, then click OK

The indicator compiles automatically the first time it loads. If there are compilation errors, open MetaEditor (F4), open the file, and press F7 to see the error list.

Tuning Guide

Goal What to change
See more signals Increase Doji Body %, increase Hammer Body %, decrease Hammer Wick Ratio
Reduce noise / false signals Decrease Doji Body %, increase Hammer Wick Ratio, use a longer MA Period
Longer-term trend bias Increase MA Period (e.g. 100, 200)
Faster trend response Switch to Market Structure with a smaller Lookback
Trade only one candle shape in one direction Disable the pattern on the opposite context (e.g. keep Shooting Star ON, turn Inverted Hammer OFF)
Clean up chart temporarily Click SHOW ALL [ OFF ] — all arrows hide instantly, nothing is deleted

Technical Notes

  • No repainting — signals are placed only on bars with index ≥ 1 (fully closed). Bar 0 is never touched.
  • Object naming — every chart object is prefixed CPD_ . This guarantees clean removal when the indicator is detached and prevents conflicts with other tools.
  • Marker naming convention — CPD_MRK_<PATTERNCODE><B|S>_<BARNUMBER> . The B/S suffix records which direction the signal fired in, allowing the panel to independently toggle visibility per pattern.
  • Performance — on a full scan (chart load), the indicator scans all bars in a single pass with no nested indicator calls inside the loop. The MA buffer is copied once before the loop begins. Panel objects use partial updates (only the changed object is redrawn) rather than rebuilding the entire panel on every click.

CandlePatternDetector v2.0 — MQL5 Custom Indicator


おすすめのプロダクト
NOTE: Turn Pattern Scan ON This indicator identifies Swing Points, Break of Structure (BoS), Change of Character (CHoCH), Contraction and Expansion patterns which are plotted on the charts It also comes with Alerts & Mobile notifications so that you do not miss any trades. It can be used on all trading instruments and on all timeframes. The non-repaint feature makes it particularly useful in backtesting and developing profitable trading models. The depth can be adjusted to filter swing points.
FREE
QuantumAlert Stoch Navigator is a free indicator available for MT4/MT5 platforms, its work is to provide "alerts" when the market is inside "overbought and oversold" regions in the form of "buy or sell" signals. This indicator comes with many customization options mentioned in the parameter section below, user can customise these parameters as needful. Join our   MQL5 group , where we share important news and updates. You are also welcome to join our private channel as well, contact me for the p
FREE
VolumeBasedColorsBars — Free Powerful Volume Analysis for All Traders Unlock the hidden story behind every price bar! VolumeBasedColorsBars is a professional-grade, 100% FREE indicator that colorizes your chart candles based on real, adaptive volume analysis. Instantly spot surges in market activity, identify exhaustion, and catch the moves that matter. This indicator gives you:    • Dynamic color-coded bars for instant volume context    • Adaptive thresholds based on historical, session-awar
FREE
マルチタイムフレーム対応、カスタマイズ可能なビジュアルシグナル、設定可能なアラートシステムを備えたBalance of Power(BOP)インジケーター。 フリーランスプログラミングサービス、アップデート、その他のTrueTL製品は私の MQL5プロフィール からご利用いただけます。 フィードバックとレビューを大歓迎します! BOPとは? Balance of Power(BOP)は、価格の変化をバーの値幅と比較することで、買い手と売り手の強さを測定するオシレーターです。インジケーターは(終値 - 始値)/(高値 - 安値)として計算され、その後Simple Moving Average(SMA)で平滑化されます。 BOP値は-1から+1の間で変動します。正の値は買い手が強いことを示し(終値が始値より高い)、負の値は売り手が強いことを示します(終値が始値より低い)。値の大きさは動きの強さを示します。BOPは買い圧力と売り圧力のバランスを示すことで、市場の強さと潜在的な反転を識別するのに役立ちます。 特徴: 矢印と垂直線によるビジュアルシグナルマーカー 設定可能なトリガーを持つ3
FREE
ニューラルネットワークインジケーター   学習機能が組み込まれています。 これは、多層的にカスタマイズ可能なパーセプトロンと高度なトレーニング設定を備えた、真の自律型人工知能システムです。 将来の価格変動を予測します。このインジケーターは、あらゆる金融銘柄でご自身でトレーニングできます。機械学習の特別な知識は必要ありません。必要なものはすべてこのツールに集約されており、自動モードとプリセットによって簡単に実装できます。 メジャーアップデートv2.0-2.5がリリースされました。 高度な入力機能:インジケータのサポートが追加されました。 これで、生の価格データを3つのテクニカル指標と組み合わせて、より深い市場分析を行うことも、価格なしの指標のみを使用することもできます。 ブロックせずにライブトレーニング:インテリジェントな学習アルゴリズムは、バックグラウンドで非同期的に動作します。 あなたのMetaTrader5ターミナルは完全に応答し続け、ニューラルネットワークを学びながら市場の取引と分析を継続することができます。 特徴: 簡単スタート 。自動モードですぐにスタートできる簡単な設定
FlatBreakout MT5 (Free Version) Flat Range Detector and Breakout Panel for MT5 — GBPUSD Only FlatBreakout MT5   is the free version of the professional FlatBreakoutPro MT5 indicator, specially designed for flat (range) detection and breakout signals on the   GBPUSD   pair only. Perfect for traders who want to experience the unique fractal logic of FlatBreakout MT5 and test breakout signals on a live market without limitations. Who Is This Product For? For traders who prefer to trade breakout of
FREE
Free automatic Fibonacci is an indicator that automatically plots a Fibonacci retracement based on the number of bars you select on the BarsToScan setting in the indicator. The Fibonacci is automatically updated in real time as new highest and lowest values appears amongst the selected bars. You can select which level values to be displayed in the indicator settings. You can also select the color of the levels thus enabling the trader to be able to attach the indicator several times with differe
FREE
Caicai L&S Yield Histogram Important Notice: This indicator is an integral tool of the automated EA Caicai Long and Short Pair Trading . This indicator visually displays the percentage deviation (Yield %) of a pair's current spread relative to its own historical mean. It is an excellent tool for quickly visualizing the gross financial potential of a market distortion in Long & Short operations. Main Features: Percentage Visualization: Understand the size of the distortion in palpable percentage
Pivot Points Indicator – a fast, reliable, and fully customizable pivot detection for MetaTrader 5. This indicator uses MetaTrader’s native iHighest and iLowest functions to identify pivot highs and lows by scanning for the highest and lowest prices within a user-defined window of bars. A pivot is confirmed only when the current bar is the absolute maximum or minimum within the selected range, ensuring accurate and timely signals based on robust built-in logic. Key Features No Repainting : Onc
FREE
FX Clock
Abderrahmane Benali
FXClock – Professional Clock Indicator for Traders Please leave a 5 star rating if you like this free tool! Thank you so much :) The FXClock indicator is a practical and simple tool that displays time directly on your trading platform, allowing you to track multiple key pieces of information at the same time. It is specially designed to help traders synchronize their trading with market hours and global sessions. Key Features: Displays the broker server time with precision. Displays your local c
FREE
CosmiCLab SMC FIBO CosmiCLab SMC FIBO is a professional trading indicator designed for traders who use Smart Money Concepts (SMC), market structure analysis and Fibonacci retracement levels. The indicator automatically detects market swings and builds Fibonacci levels based on the latest impulse movement. It also identifies market structure changes such as BOS (Break of Structure) and CHOCH (Change of Character), helping traders understand the current market direction. CosmiCLab SMC FIBO also pr
マルチタイムフレーム対応、カスタマイズ可能なビジュアルシグナル、設定可能なアラートシステムを備えたAverage True Range(ATR)インジケーター。 フリーランスプログラミングサービス、アップデート、その他のTrueTL製品は私の MQL5プロフィール でご覧いただけます。 フィードバックとレビューを大変お待ちしております! ATRとは? Average True Range(ATR)は、J. Welles Wilderが開発した市場のボラティリティを測定するテクニカルインジケーターです。指定した期間のTrue Rangeの平均を計算します。True Rangeは以下の中で最大の値です:現在の高値から現在の安値までの距離、前回の終値から現在の高値までの距離、または前回の終値から現在の安値までの距離。 ATRは価格方向を示しません — ボラティリティのみを測定します。ATRが上昇するとボラティリティの増加を示し、ATRが低下するとボラティリティの減少を示します。トレーダーはATRを使用して市場状況を評価し、動的なストップロスを設定し(例:ATRベースのトレーリングストッ
FREE
PR EA - Engulfing Pattern Trading System Automated Engulfing Pattern Detection with MA Confirmation The PR EA is a Meta Trader 5 expert advisor that identifies and trades bullish/bearish engulfing candlestick patterns when confirmed by a moving average filter. Designed for swing trading on 30-minute charts with compatibility for M15 and H1 time frames. Key Features: Pattern Recognition - Detects valid bullish/bearish engulfing candle formations Trend Confirmation - 238-period SMA filter
発見が困難で頻度が少ないため、分岐は最も信頼できる取引シナリオの1つです。このインジケーターは、お気に入りのオシレーターを使用して、通常の隠れた分岐点を自動的に見つけてスキャンします。 [ インストールガイド | 更新ガイド | トラブルシューティング | よくある質問 | すべての製品 ] 取引が簡単 通常の隠れた発散を見つけます 多くのよく知られている発振器をサポート ブレイクアウトに基づいて取引シグナルを実装します 適切なストップロスおよび利益レベルを表示します 設定可能なオシレーターパラメーター カスタマイズ可能な色とサイズ バー単位でサイズ別に分岐をフィルタリング パフォーマンス統計を実装します 電子メール/音声/視覚アラートを実装します 幅広い市場の見通しを提供するために、異なるオシレーターを使用して、干渉なしで同じチャートにインジケーターを何度もロードできます。このインジケーターは、次のオシレーターをサポートしています。 RSI CCI MACD オスマ 確率的 勢い 素晴らしい発振器 加速器発振器 ウィリアムズパーセントレンジ 相対活力指数 特に外国為替市場では、
KT Renko Patterns は、レンコチャートの各レンガをスキャンしながら、さまざまな金融市場でトレーダーによく使用されている有名なチャートパターンを検出します。 時間ベースのチャートと比較して、レンコチャートは視認性が高くシンプルなため、パターンベースのトレードがより簡単かつ明確になります。 KT Renko Patterns は複数のレンコパターンを搭載しており、その多くは Prashant Shah 氏の著書『Profitable Trading with Renko Charts』でも詳しく解説されています。 KT Renko Patterns インジケーターに基づいた 100% 自動化された EA は、こちらからご利用いただけます - KT Renko Patterns EA 。 機能一覧 最大8種類の明確なレンコパターンを表示し、あいまいさなく取引をサポートします。 完全な客観性を保つため、すべてのパターンにストップロスとフィボナッチターゲットが設定されています。 KT Renko Patterns は各パターンの精度を継続的に測定し、重要な統計情報をチャート
PROMETHEUS TECHNICAN VERSION Free | By THE SONS A gift from The Sons — no strings, no trial, no expiry. Every trader deserves access to professional-grade market intelligence. That belief is why Prometheus Technical Version exists, and why it costs nothing. Consider it our handshake to the trading community. What You're Getting This is not a simplified tool dressed up as a gift. Prometheus Technican Version is a fully built, institutional-quality technical analysis indicator running a dual-model
FREE
概要 このインジケーターは、クラシックな ドンチャンチャネル を強化したバージョンで、実践的なトレード機能を追加しています。 標準の3本線(上限、下限、中央線)に加え、 ブレイクアウト を検出し、チャート上に矢印で視覚的に表示します。また、チャートを見やすくするために、 現在のトレンド方向と逆側のラインのみを表示 します。 インジケーターの機能: 視覚的シグナル :ブレイクアウト時にカラフルな矢印を表示 自動通知 :ポップアップ、プッシュ通知、Eメール RSIフィルター :市場の相対的な強弱に基づいてシグナルを検証 カスタマイズ可能 :色、ラインの太さ、矢印コード、RSI閾値など 動作原理 ドンチャンチャネルは次のように計算します: 上限線 :直近N本のクローズ済みローソク足の最高値 下限線 :直近N本のクローズ済みローソク足の最安値 中央線 :最高値と最安値の平均値 上方ブレイクアウト は終値が上限線を超えたときに発生し、 下方ブレイクアウト は終値が下限線を下回ったときに発生します。 インジケーターは以下を行います: 3本のドンチャンラインを描画 方向転換後の最初のブレイクアウト
FREE
RBreaker Gold Indicatorsは、金先物の短期日内取引戦略であり、トレンドフォローと日内反転の2つの取引手法を組み合わせたものです。トレンド相場での利益を捉えるだけでなく、相場が反転した際には迅速に利確し、その流れに沿ってポジションを反転させることができます。 この戦略は、アメリカの雑誌『Futures Truth』において、15年連続で最も収益性の高い取引戦略トップ10に選ばれた実績を持ち、非常に長いライフサイクルを誇り、現在も国内外で広く使用・研究されています。 本インディケーターは、2026年の金先物の値動きに対応し、14日間のATR指標に基づいて、ブレイクアウト係数A、観察係数B、リバーサル係数Rをより合理的な値で定義しています。非常に優れたインディケーターであり、安定的な年間収益を実現しています。ぜひおすすめします〜
The idea of the system is to indentify the reversal patterns using the calculation of the composite candle. The reversal patterns is similar to the "Hammer" and "Hanging Man" patterns in Japanese candlestick analysis. But it uses the composite candle instead the single candle and doesn't need the small body of the composite candle to confirm the reversal. Input parameters: Range - maximal number of bars, used in the calculation of the composite candle. Minimum - minimal size of the composite can
FREE
The Swing High Low and Fibonacci Retracement Indicator is a powerful technical analysis tool designed to identify key price levels and potential reversal zones in the market. It automatically detects recent swing highs and swing lows on the chart and overlays Fibonacci retracement levels based on these points. This indicator helps traders: Visualize market structure by highlighting recent swing points. Identify support and resistance zones using Fibonacci ratios (e.g., 38.2%, 50%, 61.8%). Adapt
FREE
このインジケータは、AB = CDリトレースメントパターンを検出します。 AB = CDリトレースメントパターンは、初期価格セグメントが部分的にリトレースされ、プルバックの完了から等距離の動きが続く4ポイントの価格構造であり、すべての調和パターンの基本的な基盤です。 [ インストールガイド | 更新ガイド | トラブルシューティング | よくある質問 | すべての製品 ] カスタマイズ可能なパターンサイズ カスタマイズ可能なACおよびBD比率 カスタマイズ可能なブレイクアウト期間 カスタマイズ可能な線、色、サイズ CD fiboレベルに基づいてSLおよびTPレベルを表示します パターンとブレイクアウトの視覚/音声/プッシュ/メールアラート AB = CDリトレースメントは、かなり拡大して再描画できます。物事を簡単にするために、このインディケーターはひねりを実装します。トレードをシグナルする前に、正しい方向へのドンチャンブレイクアウトを待ちます。最終結果は、非常に信頼性の高い取引シグナルを備えた再描画インジケーターです。ドンチャンのブレイクアウト期間が入力として入力されます。 強
This indicator finds Three Drives patterns. The Three Drives pattern is a 6-point reversal pattern characterised by a series of higher highs or lower lows that complete at a 127% or 161.8% Fibonacci extension. It signals that the market is exhausted and a reversal can happen. [ Installation Guide | Update Guide | Troubleshooting | FAQ | All Products  |  Get Help ] Customizable pattern sizes Customizable colors and sizes Customizable breakout periods Customizable 1-2-3 and 0-A-B ratios It impl
FREE
Indicator Name: Fibaction – price action candle Detector Description: Fibo Signal Boxes is a powerful Smart Money Concept (SMC)-inspired indicator that auto-detects price action candles. bullish hammers and shooting stars, then draws precise Fibonacci entry zones and multiple take-profit levels directly on the chart. as for the SL personally i use 40 pips rules  Key Features: Detects bullish hammer and shooting star reversal candles. Automatically draws Fibonacci entry and TP boxes. as
Classic SNR MetaTrader 5 Expert Advisor | Multi-Symbol Support & Resistance Trading with Trend-Based Logic Overview Classic SNR Breakout EA is a professional trading robot that identifies structural Support & Resistance levels using daily swing points and executes trades based on H1 price action relative to these levels. The EA applies   dual logic : in an uptrend, it sells on H1 rejection below an SNR level; in a downtrend, it buys on H1 rejection above an SNR level. Breakout confirmations are
MarketMagnet
Kelly Adediran Raymond
Are you ready to take your trading journey to new heights? Look no further than MarketMagnet, this groundbreaking indicator designed to propel your trading success with excitement and accuracy. Powered by the convergence of Momentum and CCI (Commodity Channel Index), MarketMagnet equips traders with the ultimate tool to determine direction and entry prices for a wide range of recommended currency pairs and instruments. It is designed for traders seeking to scalp for a few pips on lower timeframe
Magic EA MT5
Kyra Nickaline Watson-gordon
Magic EA is an Expert Advisor based on Scalping, Elliot Waves and with filters such as RSI, Stochastic and 3 other strategies managed and decided with the robot smartly. Large number of inputs and settings are tested and optimized and embedded in the program thus inputs are limited and very simple. Using EA doesn't need any professional information or Forex Trading Knowledge. EA can trade on all symbols and all time frames, using special and unique strategies developed by the author. The EA w
The Bitcoin Reaper
Profalgo Limited
3.71 (34)
発売プロモーション: 現在の価格で入手できるコピーの数はごく限られています。 最終価格: 999ドル 新規 (349 ドルから) --> 1 EA を無料で入手 (取引口座番号 2 つ)。 究極のコンボディール   ->   こちらをクリック 公開グループに参加する: ここをクリック   LIVE SIGNAL LIVE SIGNAL V2.0 UPDATE 2.0 INFO BITCOIN REAPER へようこそ!   Gold Reaper が大成功を収めた後、同じ勝利の原則を Bitcoin 市場に適用する時が来たと判断しました。そして、それは非常に有望に見えます!   私はこれまで 20 年以上にわたってトレーディング システムを開発してきましたが、私の専門分野は「断然」ブレイクアウト戦略です。 このシンプルながらも効果的な戦略は、常に最高の取引戦略の上位にランクインしており、基本的にあらゆる市場に適用できます。     特にビットコインのような変動の激しい市場では、真価を発揮します。   それで、この戦略はどのように機能するのでしょうか? ブレイクアウト戦略は、重要なサ
Are you tired of drawing trendlines every time you're analyzing charts? Or perhaps you would like more consistency in your technical analysis. Then this is for you. This indicator will draw trend lines automatically when dropped on a chart. How it works Works similar to standard deviation channel found on mt4 and mt5. It has 2 parameters: 1. Starting Bar 2. Number of bars for calculation The   starting bar   is the bar which drawing of the trend lines will begin, while the   number of bars for c
FREE
Blue Orbit 今日の価格 は 190 です。 10 コピーが売れると、新しい価格は 249 になります。早めの slot をお見逃しなく。 現在の販売数: 9 。 市場の自然な「フローダイナミクス」を解釈するために設計された Blue Orbit で、自動取引の新しい時代に足を踏み入れてください。このシステムは、リアルタイムのモメンタムシフトを読み取り、疲労ゾーンを検出し、トレンドの疲労が反転の強さに出会うところでエントリーを実行することに重点を置いています。これは非線形で流動的なアプローチであり、厳格な機械的セットアップをはるかに超えています。 MQLで私たちの成長するトレーダーコミュニティに参加しましょう:  (こちらをクリック) EAの洞察を深く掘り下げましょう:   (こちらをクリック) 概要 チャートシンボル: XAUUSD (シングルチャートセットアップ) 時間足: M15 最適: XAUUSD 最小入金: おすすめは$500 レバレッジ: 1:100から1:500が最適 適切なバックテスト: 私に連絡して   セットアップファイルとヘルプノートを送ります
When you purchase the MT5 Unlimited version, I’m including mobile version for FREE (TV) . see my profile page or  text me for details! Magic Finger can help you identify trends and trading opportunities clearly. The finger points to the open position signal, and the discoloration line is confirmed by the trend. If you are a day trader, you can choose to trade during a period of active trading, referring to the discoloration line as the basis for the next order, finger signal as a filter.
このプロダクトを購入した人は以下も購入しています
このインジケーターを購入された方には、以下の特典を 無料 で提供しています: 各トレードを自動で管理し、ストップロスとテイクプロフィットを設定し、戦略ルールに基づいてポジションを決済する補助ツール 「Bomber Utility」 様々な銘柄に合わせたインジケーターの設定ファイル(セットファイル) 「最小リスク」、「バランスリスク」、「待機戦略」 の3つのモードで使用できる Bomber Utility 用の設定ファイル このトレーディング戦略をすぐに導入・設定・開始できる ステップバイステップのビデオマニュアル ご注意: 上記の特典を受け取るには、MQL5のプライベートメッセージシステムを通じて販売者にご連絡ください。 オリジナルのカスタムインジケーター 「Divergence Bomber(ダイバージェンス・ボンバー)」 をご紹介します。これは、MACDのダイバージェンス(乖離)戦略に基づいた 「オールインワン」型のトレーディングシステム です。 このテクニカルインジケーターの主な目的は、価格とMACDインジケーターの間に発生するダイバージェンスを検出 し、将来の価格の動きを示す
Azimuth Pro
Ottaviano De Cicco
5 (6)
Azimuth Pro V2:MT5向けシンセティック・フラクタル構造分析と確認済みエントリー 概要 Azimuth Pro は Merkava Labs によるマルチレベルスイング構造インジケーターです。4つのネストされたスイングレイヤー、スイングアンカーVWAP、ABCパターン検出、3タイムフレーム構造フィルタリング、そして確定バーでの確認済みエントリー — 1つのチャートで、ミクロスイングからマクロサイクルまでを網羅するワークフロー。 これはブラインドシグナル製品ではありません。ロケーション、コンテキスト、タイミングを重視するトレーダーのための構造ファーストワークフローです。 V2発売記念オファー — Azimuth Pro V2をUSD 399で(次の100本)。最終価格:USD 499。 1. V2での変更点 シンセティック・マルチタイムフレームエンジン 上位タイムフレーム分析をMeridian Proと同じ独自のシンセティックアーキテクチャで一から再構築。よりクリーンなHTFコンテキスト、安定したライブ動作、従来のMTF同期問題なし。シンセティックエンジンは 固定比率タ
Quantum TrendPulse を ご紹介します。これは、   SuperTrend   、   RSI   、および Stochastic のパワーを 1 つの包括的なインジケーターに組み合わせて、取引の可能性を最大限に引き出す究極の取引ツールです。精度と効率を求めるトレーダー向けに設計されたこのインジケーターは、市場のトレンド、勢いの変化、最適なエントリー ポイントとエグジット ポイントを自信を持って特定するのに役立ちます。 主な特徴: SuperTrend 統合: 現在の市場動向に簡単に追従し、収益性の波に乗ることができます。 RSI精度: 買われすぎと売られすぎのレベルを検出し、市場の反転のタイミングに最適で、SuperTrendのフィルターとして使用されます。 確率的精度: 確率的振動を活用して、変動の激しい市場で隠れたチャンスを見つけます。SuperTrend のフィルターとして使用されます。 マルチタイムフレーム分析:   M5 から H1 または H4 まで、さまざまなタイムフレームで市場を常に把握します。 カスタマイズ可能なアラート: カスタム取引条件が満たされ
このインジケーターを購入すると、プロ仕様のトレードマネージャーを無料で差し上げます。 まず第一に、このトレーディングシステムがノンリペイント、ノンリドロー、ノンラグのインジケーターであることを強調する価値がある。これにより、手動取引とロボット取引の両方に理想的なものになっています。 オンラインコース、マニュアル、プリセットのダウンロード。 「スマートトレンドトレーディングシステム MT5」は、新規および経験豊富なトレーダー向けにカスタマイズされた包括的なトレーディングソリューションです。10以上のプレミアムインジケーターを組み合わせ、7つ以上の堅実なトレーディング戦略を備えており、多様な市場状況に対応する多目的な選択肢となっています。 トレンドフォロー戦略:トレンドを効果的に乗り越えるための正確なエントリーとストップロス管理を提供します。 リバーサル戦略:潜在的なトレンドの反転を特定し、トレーダーがレンジ相場を活用できるようにします。 スキャルピング戦略:高速で正確なデイトレードおよび短期取引のために設計されています。 安定性:すべてのインジケーターはノンリペイント、ノンリドロー、ノ
OmniSync Projection
Antonio-alin Teculescu
5 (1)
Chronos Fractal Engine is an innovative price projection indicator for MetaTrader 5, designed to transform your technical analysis by intelligently identifying and projecting historical price patterns. Built upon an advanced correlation algorithm and the fractal principles of the market, this powerful tool visualizes potential future price movements, giving you a unique edge in your trading decisions. What is Chronos Fractal Engine? At its core, the Chronos Fractal Engine employs a sophisticat
ご紹介     Quantum Breakout PRO は 、ブレイクアウト ゾーンの取引方法を変革する画期的な MQL5 インジケーターです。 13年以上の取引経験を持つ経験豊富なトレーダーのチームによって開発されました。     クォンタム ブレイクアウト プロ   は、革新的でダイナミックなブレイクアウト ゾーン戦略により、あなたのトレーディングの旅を新たな高みに押し上げるように設計されています。 クォンタム ブレイクアウト インジケーターは、5 つの利益ターゲット ゾーンを備えたブレイクアウト ゾーン上のシグナル矢印と、ブレイクアウト ボックスに基づいたストップロスの提案を提供します。 初心者トレーダーにもプロのトレーダーにも適しています。 量子EAチャネル:       ここをクリック 重要!購入後、インストールマニュアルを受け取るためにプライベートメッセージを送ってください。 推奨事項: 時間枠: M15 通貨ペア: GBPJPY、EURJPY、USDJPY、NZDUSD、XAUUSD アカウントの種類: ECN、Raw、またはスプレッドが非常に低い R
優れたテクニカルインジケーター「Grabber」をご紹介します。これは、すぐに使える「オールインワン」トレーディング戦略として機能します。 ひとつのコードに、市場のテクニカル分析ツール、取引シグナル(矢印)、アラート機能、プッシュ通知が強力に統合されています。 このインジケーターを購入された方には、以下の特典を無料で提供します: Grabberユーティリティ:オープンポジションを自動で管理するツール ステップバイステップのビデオマニュアル:インジケーターのインストール、設定、取引方法を解説 カスタムセットファイル:インジケーターをすばやく自動設定し、最大限の成果を出すための設定ファイル 他の戦略はもう忘れてください!Grabberだけが、あなたを新たなトレードの高みへと導いてくれるのです。 Grabber戦略の主な特徴: 推奨タイムフレーム:M5〜H4 対応通貨ペア・資産:どれでも使用可能ですが、私が実際に検証した以下を推奨します(GBPUSD、GBPCAD、GBPCHF、AUDCAD、AUDUSD、AUDSGD、AUDCHF、NZDUSD、NZDCAD、EURCAD、EURUSD、E
CGE Trading Suite
Carl Gustav Johan Ekstrom
5 (2)
Institutional-Grade Analytics for MT5 C GE Trading Suite delivers the analytical edge typically reserved for professional trading desks. The platform integrates a full suite of analytical tools into one seamless workflow: dynamic grid mapping, liquidity behavior analysis, ECM, trend lines, MIDAS, trade cycles, and directional channel projections. Together, these provide a unified view of market structure and momentum. Directional clarity is further enhanced by the capital flow index, which meas
まず第一に、この取引インジケーターは再描画されず、再描画されず、遅延しないことを強調する価値があります。これにより、手動取引とロボット取引の両方に理想的なものになります。 ユーザーマニュアル:設定、入力、戦略。 アトミックアナリストは、価格の強さとモメンタムを利用して市場でより良いエッジを見つけるためのPA価格アクションインジケーターです。ノイズや誤ったシグナルを除去し、取引ポテンシャルを高めるための高度なフィルターを備えています。複雑なインジケーターの複数のレイヤーを使用して、アトミックアナリストはチャートをスキャンし、複雑な数学的計算をシンプルなシグナルと色に変換します。これにより、どのような初心者トレーダーでも理解して使用し、一貫した取引の決定を行うことができます。 「アトミックアナリスト」は、新規および経験豊富なトレーダー向けにカスタマイズされた包括的な取引ソリューションです。プレミアムインジケーターとトップノッチの機能を1つの取引戦略に組み合わせ、すべてのタイプのトレーダーにとって汎用性のある選択肢にします。 デイリートレーディングとスキャルピング戦略:高速で正確なデイ
Meridian Pro
Ottaviano De Cicco
5 (1)
Meridian Pro:MT5用プロフェッショナル・マルチタイムフレーム・トレンドマトリックス 概要 Meridian Pro は Merkava Labs が開発したマルチタイムフレーム・トレンドマトリックスで、方向性の状態、強度、モメンタムの状況、マトリックスの合意をひとつのコンパクトなパネルに集約します。ひとつのアダプティブエンジンがM1からW1まで一貫して適用されます。シンボルごとの調整は不要。インジケーターの積み重ねも不要。すべてのアセットとすべてのタイムフレームをカバーするひとつの構造化された読み取りです。 発売キャンペーン — Meridian Proを USD 99 (導入価格)で入手。通常価格:USD 149 。 1. Meridian Proが他と異なる理由 ひとつのエンジン、バラバラなインジケーターのダッシュボードではない 多くのMTFダッシュボードは、タイムフレームごとに生のインジケーター値を繰り返すだけです。Meridian Proはマトリックス全体でひとつのアダプティブ・トレンドエンジンを使用するため、パネルの各行が同じ構造化フレームワークから導出されます
BTMM State Engine Pro is a MetaTrader 5 indicator for traders who use the Beat The Market Maker approach: Asian session context, kill zone timing, level progression, peak formation detection, and a multi-pair scanner from a single chart. It combines cycle state logic with a built-in scanner dashboard so you do not need the same tool on many charts at once. What it does Draws the Asian session range; session times can follow broker server offset or be set in inputs. Tracks level progression (L
ARICoin is a powerful trading companion designed to generate high-probability entry signals with dynamic TP/SL/DP levels based on volatility. Built-in performance tracking shows win/loss stats, PP1/PP2 hits, and success rates all updated live. Key Features: Buy/Sell signals with adaptive volatility bands Real-time TP/SL/DP levels based on ATR Built-in MA Filter with optional ATR/StdDev volatility Performance stats panel (Success, Profit/Loss, PP1/PP2) Alerts via popup, sound, push, or email Cust
ARIPoint is a powerful trading companion designed to generate high-probability entry signals with dynamic TP/SL/DP levels based on volatility. Built-in performance tracking shows win/loss stats, PP1/PP2 hits, and success rates all updated live. Key Features: Buy/Sell signals with adaptive volatility bands Real-time TP/SL/DP levels based on ATR Built-in MA Filter with optional ATR/StdDev volatility Performance stats panel (Success, Profit/Loss, PP1/PP2) Alerts via popup, sound, push, or email Cu
SignalTech MT5 is a trading system for EURUSD, USDCHF, USDJPY, AUDUSD, NZDUSD, EURJPY, AUDJPY, NZDJPY, CADJPY H2 and H3 Timeframe.  It can generate signals with Buy/Sell Arrows and Pop-Up/Sound Alerts. Each signal has clear Entry and Stop Loss levels, which should be automatically flagged on the chart, as well as potential Targets 1, 2, and 3. The Entry and TP levels are fixed after the trade is taken. The exit level is dynamic. If there are signs of a potential short-term trend reversal, the
Was: $299  Now: $99  Supply Demand uses previous price action to identify potential imbalances between buyers and sellers. The key is to identify the better odds zones, not just the untouched ones. Blahtech Supply Demand indicator delivers functionality previously unavailable on any trading platform. This 4-in-1 indicator not only highlights the higher probability zones using a multi-criteria strength engine, but also combines it with multi-timeframe trend analysis, previously confirmed swings a
Master Editionは、ボリュームとマネーフローの視点を通じて市場構造を可視化するために設計されたプロフェッショナルグレードの分析ツールです。標準のボリュームインジケーターとは異なり、このツールはチャート上に日足ボリュームプロファイルを直接表示し、価格発見がどこで行われたか、そして「スマートマネー」がどこに位置しているかを正確に確認できます。 このMaster Editionは、明確さとスピードを考慮して設計されており、ロード時にチャートレイアウトを即座に美化するユニークな自動テーマ同期システムを備えています。 主な機能: 真のマネーフロー計算: 標準のティックボリュームを超えます。「Use Money Flow」を有効にすると、ボリュームは価格によって重み付けされ、特定の価格レベルでの実際の資本コミットメントが明らかになります。 バリューエリア (VA) の可視化: バリューエリア(デフォルトではボリュームの70%)を自動的に計算します。 VA Fill: コントロールゾーンを即座に識別するために、バリューエリアの背景をシェーディングします。 主要レベル: コントロールポイン
RelicusRoad Pro: 定量的市場オペレーティングシステム 【期間限定】無制限アクセス 70% OFF - 2,000人超のトレーダーと共に なぜ多くのトレーダーは「完璧な」インジケーターを使っても失敗するのでしょうか? それは、文脈を無視して 単一の概念 だけでトレードしているからです。文脈のないシグナルは単なるギャンブルです。勝ち続けるには、 根拠の重なり(コンフルエンス) が必要です。 RelicusRoad Proは単なる矢印インジケーターではありません。完全な 定量的市場エコシステム です。独自のボラティリティモデリングを用いて、価格が推移する「適正価値の道(Fair Value Road)」をマッピングし、ノイズと真の構造的ブレイクを判別します。 推測はやめましょう。機関投資家レベルの「ロード・ロジック」でトレードを。 コアエンジン:「Road」アルゴリズム システムの中心となる Road Algo は、市場環境にリアルタイムで適応するダイナミックなボラティリティチャネルです。 安全ライン(平衡点) と、価格が数学的に反転しやすい 拡張レベル を投影します。 Si
まず第一に、この取引ツールはノンリペイント、ノンリドロー、ノンラグの指標であり、プロの取引に理想的ですことを強調する価値があります。 オンラインコース、ユーザーマニュアル、デモ。 スマートプライスアクションコンセプトインジケーターは、新米から経験豊富なトレーダーまで、非常 に強力なツールです。Inner Circle Trader AnalysisやSmart Money Concepts Trading Strategiesなど、20以上の有用な指標を1つに組み合わせています。このインジケーターはスマートマネーコンセプトに焦点を当て、大手機関の取引方法を提供し、彼らの動きを予測するのに役立ちます。 特に、流動性分析に優れており、機関がどのように取引しているかを理解しやすくしています。市場のトレンドを予測し、価格の動きを慎重に分析するのに優れています。機関の戦略とトレードを合わせることで、市場の動向についてより正確な予測ができます。このインジケーターは多目的であり、市場構造を分析し、重要な注文ブロックを特定し、さまざまなパターンを認識するのに優れています。 このインジケーター
CRT Multi-Timeframe Market Structure & Liquidity Sweep Indicator Non-Repainting | Multi-Asset | MT4 Version Available MT4 Version: https://www.mql5.com/en/market/product/162556 Full Setup Guide: https://www.mql5.com/en/blogs/post/767525 Indicator Overview CRT Ghost Candle HTF Fractal is a complete institutional-grade market structure toolkit for MetaTrader 5. It projects higher-timeframe candle structure, CRT trap levels, session levels, previous period highs and lows, pivot points, and a real
Gartley Hunter Multi - An indicator for searching for harmonic patterns simultaneously on dozens of trading instruments and on all possible timeframes. Manual (Be sure to read before purchasing) | Version for MT4 Advantages 1. Patterns: Gartley, Butterfly, Shark, Crab. Bat, Alternate Bat, Deep Crab, Cypher 2. Simultaneous search for patterns on dozens of trading instruments and on all possible timeframes 3. Search for patterns of all possible sizes. From the smallest to the largest 4. All fou
Bill Williams Advanced is designed for automatic chart analysis using Bill Williams' "Profitunity" system. The indicator analyzes four timeframes at once. Manual (Be sure to read before purchasing) Advantages 1. Analyzes the chart using Bill Williams' "Profitunity" system. Signals are displayed in a table in the corner of the screen and on the price chart. 2. Finds all known AO and AC signals, as well as zone signals. Equipped with a trend filter based on the Alligator. 3. Finds "Divergence Bar
トレンドラインは、外国為替取引におけるテクニカル分析の最も重要なツールです。残念ながら、ほとんどのトレーダーはそれらを正しく描画していません。自動トレンドラインインジケーターは、市場のトレンドの動きを視覚化するのに役立つ本格的なトレーダー向けのプロフェッショナルツールです。 トレンドラインには、強気トレンドラインと弱気トレンドラインの2種類があります。 上昇トレンドでは、外国為替トレンドラインは価格変動の最低スイングポイントを介して描画されます。 少なくとも2つの「最低安値」を接続すると、トレンドラインが作成されます。 下降トレンドでは、トレンドラインは価格変動の最も高いスイングポイントを介して描画されます。 少なくとも2つの「最高値」を接続すると、トレンドラインが作成されます。 トレンドラインが壊れたとき? 弱気のろうそくが強気のトレンドラインの下で閉じ、ろうそくの高さがトレンドラインの上にあるとき、強気のトレンドラインは壊れます。 強気のろうそくが弱気のトレンドラインの上で閉じ、ろうそくの安値がトレンドラインの下にあるとき、弱気のトレンドラインは壊れます。 トレ
このダッシュボードは、選択したシンボルの取引戦略に応じて、スキャルピングと長期モードの両方で、チャート上の需給ゾーンを発見し表示します。さらに、ダッシュボードのスキャナーモードは、一目ですべての希望のシンボルをチェックし、適切なポジションを見逃さないようにするのに役立ちます /  バージョンMT4 無料インディケータ:   Basic Supply Demand 特徴 複数の通貨ペアの取引機会を見ることができ、需給ゾーンの近さに応じてランク付けされた全ペアを明確かつ簡潔に表示します。 色から検出パラメータまで、特定のニーズに合わせてカスタマイズ可能な設定 主な入力 Indicator mode : 新機能を備えたインジケーター・モードまたはパネル・モードから選択。 Symbols :   "主要28通貨ペア "または "選択されたシンボル "から選択。 Selected Symbols :   カンマで区切られた監視したいシンボル (「EURUSD,GBPUSD,XAUUSD」)。お使いのブローカーがペアに接尾辞または接頭辞を付けている場合は、次の2つのパラメータ(ペア接頭辞または
このインジケーターは、反転ポイントと価格戻りゾーンを正確に表示します。     主要プレーヤー 。新たなトレンドが形成される場所を把握し、最大限の精度で意思決定を行い、すべての取引をコントロールします。 TREND LINES PRO インジケーターと組み合わせることで、その潜在能力を最大限に発揮します。 VERSION MT4 インジケーターが示す内容: 新しいトレンドの始まりに活性化する反転構造と反転レベル。 リスクと報酬の比率を最小限に抑えた利益 確定 と 損失停止の レベルの表示     RR 1:2   。 インテリジェントな削減ロジックによるストップロス。 指定されたインジケーターから 2 つのトレンド タイプの反転パターンを表示します。 指標: トレンドを追う   TREND LINES PRO   (世界的なトレンドの変化) TREND PRO   (クイックトレンド変更) シンプルで効果的   スキャナー   リアルタイムトレンド(新機能)。 マルチタイムフレームのインストゥルメント フィルタリング。 画面   利益     LOGIC AI信号の後。 当日プラス方
AriX
Temirlan Kdyrkhan
1 (4)
AriX Indicator for MT5 A powerful trend-following and signal-evaluation tool AriX is a custom MT5 indicator that combines Moving Averages and ATR-based risk/reward logic to generate clear buy/sell signals. It visualizes dynamic SL/TP levels, evaluates past trade outcomes, and displays win/loss statistics in a clean on-chart panel. Key features include: Buy/Sell signals based on MA crossovers ATR-based SL/TP1/TP2/TP3 levels with visual lines and labels Signal outcome tracking with real-time stat
現在33%オフ 初心者にもエキスパートトレーダーにも最適なソリューション このインジケーターは独自の機能と新しい公式を多数内蔵しており、ユニークで高品質かつ手頃な取引ツールです。このアップデートでは、2つの時間枠ゾーンを表示できるようになります。より長いTFだけでなく、チャートTFとより長いTF(ネストゾーンを表示)の両方を表示できます。すべてのSupply Demandトレーダーの皆さんのお気に召すはずです。:) 重要情報の公開 Advanced Supply Demandの可能性を最大化するには、 https://www.mql5.com/ja/blogs/post/720245 にアクセスしてください。   エントリーまたはターゲットの正確なトリガーポイントを正確に特定できれば取引がどのように改善されるか想像してみてください。新しい基盤となるアルゴリズムに基づいて構築されているため、買い手と売り手の間の潜在的な不均衡をさらに簡単に特定できます。これは、最も強い需要と供給のゾーンと、過去のパフォーマンス(古いゾーンを表示)がグラフィカルに表現されるためです。これらの機能は、最適な
Smart Structure Concepts MT5
Cristhian Alexander Gaibor Cuasquer
Smart Structure Concepts MT5 は MetaTrader 5 で最も完全な機関投資家向け SMC ツールキットです — 4言語の教育的ツールチップと、価格がゾーンに入った瞬間のライブプッシュアラートを備えています。 ほとんどの SMC インジケーターはボックスを描くだけで、あなたに推測を強いります。このインジケーターはチャート上で各シグナルを直接説明します。任意の BOS、CHoCH、Order Block、FVG、流動性レベルにマウスを合わせれば、その意味と次に何をすべきかが即座にわかります — 英語、スペイン語、ポルトガル語、フランス語で。 含まれる機能 — Internal & Swing BOS / CHoCH をリアルタイムで検出(リペイントなし) — Internal & Swing Order Blocks と自動ミティゲーション — 上昇・下降 Fair Value Gaps — Equal Highs & Lows(EQH / EQL)流動性マッピング — Premium / Discount / Equilibrium ゾーン —
マーケットメーカーのためのツール。 Meravith は次の機能を提供します: すべての時間足を分析し、現在有効なトレンドを表示します。 強気と弱気の出来高が等しくなる流動性ゾーン(出来高均衡)を強調表示します。 異なる時間足のすべての流動性レベルをチャート上に直接表示します。 テキスト形式の市場分析を生成し、参考情報として表示します。 現在のトレンドに基づいて目標値、サポートレベル、ストップロスを計算します。 取引のリスクリワード比を算出します。 口座残高に基づいてポジションサイズを計算し、潜在的な利益を推定します。 また、市場に大きな変化があった場合には警告を表示します。 インジケーターの主要ライン: 強気/弱気の出来高エグゾーストライン ― 目標値として機能します。 市場のトレンドを示すライン。市場が強気か弱気かによって色が変わり、トレンドのサポートとして機能します。主にその色が市場センチメントを示します。 出来高均衡ライン(Eq)。Eq(Volume Equilibrium)ラインはシステムの中核です。これは買い手と売り手の出来高のバランスポイントを表します。市場の流動性を示し
Berma Bands
Muhammad Elbermawi
5 (8)
Berma Bands (BBs) インジケーターは、市場のトレンドを特定して活用したいトレーダーにとって貴重なツールです。価格と BBs の関係を分析することで、トレーダーは市場がトレンド段階にあるか、レンジ段階にあるかを判断できます。 詳細については、[ Berma Home Blog ] をご覧ください。 バーマ バンドは、上部バーマ バンド、中部バーマ バンド、下部バーマ バンドの 3 つの異なる線で構成されています。これらの線は価格の周りにプロットされ、全体的な傾向に対する価格の動きを視覚的に表します。これらのバンド間の距離から、ボラティリティや潜在的な傾向の反転についての洞察を得ることができます。 バーマ バンドの線がそれぞれ離れると、市場が横ばいまたはレンジ相場の期間に入っていることを示すことがよくあります。これは、明確な方向性の偏りがないことを示しています。トレーダーは、これらの期間中にトレンドを特定するのが難しいと感じる可能性があり、より明確なトレンドが出現するまで待つ場合があります。 バーマ バンドの線が 1 本の線に収束すると、強いトレンド環境の兆候となること
Ziva LSE System
Hassan Abdullah Hassan Al Balushi
ZIVA LSE System A Professional Liquidity & Structure Execution Framework Executive Overview ZIVA LSE System is a professionally engineered analytical framework designed to interpret market behavior through structural logic and liquidity dynamics. It is not positioned as a conventional indicator. Rather, it functions as a structured execution environment that organizes price action into a clear, disciplined decision-making model. The system is built to deliver consistency, clarity, and controlle
作者のその他のプロダクト
RSI+EMA Grid & Dragonfly+EMA Grid System The RSI+EMA Grid & Dragonfly+EMA Grid System is a sophisticated Expert Advisor (EA) developed for traders who seek both consistency and adaptability in dynamic market conditions. Combining two proven strategies, this EA is built for precision entries, controlled risk, and intelligent position management. Strategy 1: RSI + EMA Grid System This strategy uses a combination of the Relative Strength Index (RSI) and Exponential Moving Averages (EMAs) to identi
Professional-Grade VWAP + Market Profile Technology for Precision Trading VWAP Scalping Pro is an advanced analytical tool that integrates Volume-Weighted Average Price (VWAP) analysis with professional Market Profile visualization. It provides traders with institutional-style insights into price structure, volume distribution, and session dynamics — ideal for scalping, intraday, and swing trading strategies. Key Features Triple VWAP Strategy Framework Trend VWAP (50) – Defines long-term dire
All-in-One Chart Patterns Professional Level: The Ultimate 36-Pattern Trading System All-in-One Chart Patterns Professional Level is a comprehensive 36-pattern indicator well known by retail traders, but significantly enhanced with superior accuracy through integrated news impact analysis and proper market profile positioning. This professional-grade trading tool transforms traditional pattern recognition by combining advanced algorithmic detection with real-time market intelligence.  CORE FEATU
FREE
Engulfx Pro – Advanced Breakout & News-Driven EA for MT5 Engulfx Pro is a powerful and intelligent Expert Advisor designed for traders who demand smart decision-making, precision entries, and dynamic risk control. This EA combines high-quality technical confirmations with market timing logic to trade breakouts effectively — while staying ahead of volatility caused by major news events. Whether you're a trend trader or a volatility hunter, Engulfx Pro adapts with two professional-grade strategi
FREE
Stop Loss Hunting: Market Manipulation Visualized This professional candlestick chart clearly highlights stop loss hunting zones —a common market manipulation tactic used by institutional players. Sharp downward wicks pierce below local support levels, triggering retail traders' stop losses before price reverses sharply in the opposite direction. Each event is marked with precision red arrows , showcasing engineered liquidity grabs designed to shake out weak positions before strong bullish moves
FREE
Key Marketing Elements:  Professional Positioning: Premium product language - "Ultimate Professional Trading System" Enterprise terminology - "institutional-quality," "professional-grade" Technical credibility - AI-powered, neural network technology Market compliance - MQL5 certified, fully compliant  Value Proposition Highlights: Triple strategy framework with clear explanations AI/Neural network technology as key differentiator Professional visual interface with specific details Comprehensive
FREE
RSI + Grid Distance Strategy with 200 EMA Filter Overview The RSI + Grid Distance Strategy integrates momentum and mean-reversion principles within a structured grid trading framework. By combining the Relative Strength Index (RSI) with dynamic grid levels and a 200-period Exponential Moving Average (EMA) filter, the system seeks to optimize trade timing, trend alignment, and overall position efficiency. Core Logic 1. RSI Signal Generation The algorithm utilizes a 17-period RSI , identifying b
Smart Money EQ H/L Scanner v2.0 – Advanced Institutional Market Structure Indicator for MT5 Overview The Smart Money EQ H/L Scanner v2.0 is a professional MT5 indicator built to identify Smart Money Concepts (SMC) in real time. It detects Equal Highs (EQH) and Equal Lows (EQL) patterns — zones that often indicate institutional liquidity targets — helping traders anticipate potential reversals and market manipulation areas. This tool combines price structure, volume profile, and economic event d
--------------------------------------------------------------------------------------------------------------------------------------------------------------------------------------------------------------------------------------------------------------------------------------------------------------  MARKET PROFILE PRO - Professional Volume Analysis & Smart Trading Dashboard Transform Your Trading with Institutional-Grade Market Profile Analysis Market Profile Pro brings Wall Street's most pow
ICT Breaker Block EA - Professional Order Block Trading System  Trade Like The Institutions The ICT Breaker Block EA is a sophisticated automated trading system based on the powerful Inner Circle Trader (ICT) methodology. This EA identifies institutional order blocks, detects when they are broken (becoming "breaker blocks"), and enters trades when price returns to test these levels.  What This EA Does Core Strategy The EA automatically: Detects Order Blocks - Identifies consolidation zones where
LIQUIDITY VOID EA          Professional MetaTrader 5 Expert Advisor PRODUCT OVERVIEW The Liquidity Void EA is a sophisticated automated trading system designed for MetaTrader 5 that capitalizes on liquidity gaps in the market. Based on institutional trading concepts, this
SMC STRATEGY SCALPER PRO - EXPERT ADVISOR ========================================== PROFESSIONAL TRADING SOLUTION FOR MT5 OVERVIEW -------- SMC Strategy Scalper Pro is an advanced automated trading system built on Smart Money Concepts (SMC) methodology. This Expert Advisor combines institutional trading strategies with cutting-edge algorithmic execution to identify and capitalize on high-probability market structures. Designed for serious traders who demand precision, reliability, and prof
Skyliner
Domantas Juodenis
Skyliner EA - The Professional Smart Money Trading System Hello, traders! I am Skyliner , the ultimate multi-market Expert Advisor built on institutional Smart Money Concepts and designed to trade like the professionals do. Unlike other EAs that focus on a single instrument, I am a versatile, all-market powerhouse capable of delivering precision trades across Forex majors, precious metals, and stock indices. My specialty? Smart Money trading using BOS (Break of Structure), FVG (Fair Value Gaps),
Revolution Scalper X v2.0 - Expert Advisor Description Revolution Scalper X is a sophisticated multi-asset scalping Expert Advisor (EA) for MetaTrader 5 that combines advanced risk management, flexible trading strategies, and comprehensive monitoring capabilities through dual on-chart dashboards. Key Features: Multi-Asset Trading Capabilities: Dual Mode Operation : Can operate in single-pair mode (current chart symbol) or multi-asset mode Asset Categories : Supports Forex, Cryptocurrency, and Me
Alliance EA – Smart Money & Swing Trading Expert Advisor for MT5 Alliance EA is a professional MetaTrader 5 Expert Advisor built around Swing Trading and Smart Money Concept (SMC) strategies. It is designed for traders who want a structured, rule-based, and disciplined automated trading system rather than risky scalping or martingale approaches. Alliance EA focuses on high-probability setups , institutional price behavior, and capital protection—making it suitable for both new and experienced t
Induciment Pinbar Signal – Professional Supply & Demand Trading System IT-Pinbar SD is a professional Expert Advisor built on institutional supply & demand concepts , inducement detection, and pinbar confirmation. It is designed to trade where smart money operates , not where retail traders chase price. The EA automatically identifies high-quality supply and demand zones , filters them by strength, and waits for liquidity grabs (false breakouts) before entering. Optional pinbar confirmation ensu
ORB Strategy X (For people who can contact me directly 75% with updates if i do them, discount will be for a month) This Strategy Was Banned. Now It's Back. The Opening Range Breakout is not new. Institutional desks have traded it for decades. When it started appearing in automated form on retail platforms, something interesting happened — brokers began quietly restricting accounts that ran it consistently. Requote storms. Artificial slippage on breakout candles. Platform-level execution delays
PHANTOM SNAP EA  v3.0          Advanced CRT + TBS Automated Trading System               MetaTrader 5 | Multi-Symbol | Netting  OVERVIEW Phantom Snap EA is a professional algorithmic trading system built on two of the most pow
OPEN RANGE BREAKOUT  PRO WHAT IS OPEN RANGE BREAKOUT PRO? Open Range Breakout Pro is a fully-featured, all-in-one trading indicator built exclusively for MetaTrader 5. It automatically identifies the Opening Range — the high and low formed during the first configurable minutes of a trading session — and then detects, visualises, and alerts you to high-probability breakout opportunities the moment price escapes that range. Beyond the core strategy, the indicator ships with a professional dual-
フィルタ:
レビューなし
レビューに返信