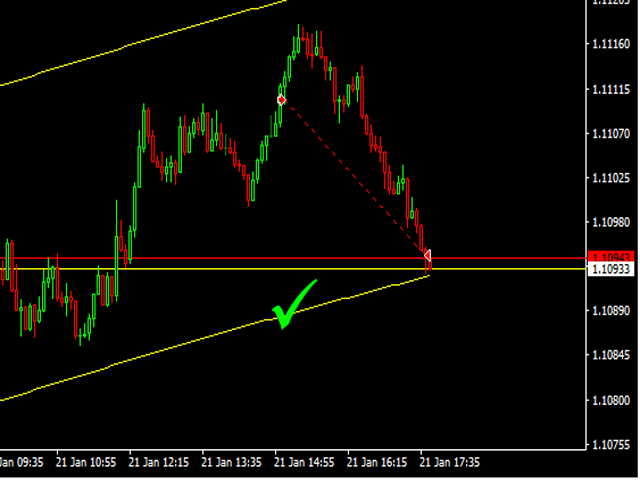
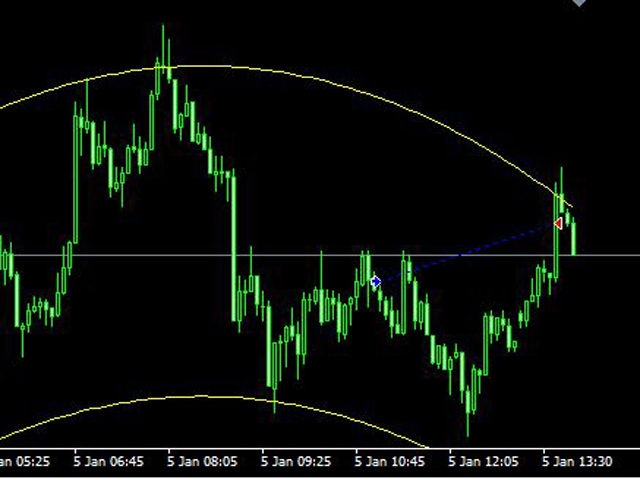
you are in a trade making profit... should you take profit now or wait...?
This easy to use Dynamic Take Profit Indicator helps you to decide when to get out of a winning trade.
Or you can supervise or overrule any EA when to close an open order when manual trading, or read out the buffers[1][2]to integrate in an Expert!
As soon as the price crosses the yellow line, price direction should reverse soon and orders should be closed.
The band is dynamic and changing with every new candle as it is based on polynomial regression, so it has to be repainting by design (the screenshots are static, curvature has already changed)
Chinetti pip collector XL is a complete turnkey trading system. If a trader does not yet have his own trading system, he can apply Chinetti pip collector XL to trading. Trading with this indicator is very easy. Even a beginner in Forex can handle it.
Trading rules: wait for the indicator to start drawing a blue line. This means that the price trend is starting now. Now we are waiting for the indicator to analyze the market and draw an up arrow on the chart. At this point, we open a buy order.
Volume indicator Effect Volume , in the Forex market volumes are unique (tick). This volume indicator demonstrates the level of financial and emotional involvement. When the indicator forms a new top, it indicates that buyers are stronger than sellers over a certain period of time. If the indicator decreases, this indicates that the bears are stronger.
Why is it impossible to track normal volumes in Forex? The fact is that this is an over-the-counter market. Consequently, it is practically imp
VSA - P (Volume Spread Analysis) Period-Based Histogram is a tool that visually represents market volume dynamics using Volume Spread Analysis principles, with a focus on highlighting key volume changes over specific time periods. The histogram captures changes in volume and price spread relationships in real-time, enabling traders to detect early signals of accumulation, distribution, and shifts in buying or selling pressure.
Indicator is non repainting and working with real-time on tick data.
Price Magnet — Price Density and Attraction Levels Indicator Price Magnet is a professional analytical tool designed to identify key support and resistance levels based on statistical Price Density. The indicator analyzes a specified historical period and detects price levels where the market spent the most time. These zones act as “magnets,” attracting price action or forming a structural base for potential reversals. Unlike traditional Volume Profile tools, Price Magnet focuses on price-time d
The Pairs Spread indicator has been developed for the popular strategy known as pairs trading, spread trading, or statistical arbitrage. This indicator measures the distance (spread) between prices of two directly (positively) correlated instruments and shows the result as a curve with standard deviations. So, traders can quickly identify when the instruments are too far apart and use this information for trade opportunities.
How to use the Pairs Spread indicator Best results are attained whe
The indicator shows which trading pairs, strategies, robots and signals that you use are profitable and which are not. The statistic of trades and balance graph are displayed in the account currency and pips - to switch simply click on the graph. button "$"(top left) - minimize/expand and move the indicator panel button ">"(bottom right) - stretching and resetting to the original size
Statistic of trades 1 line - account balance, current profit and lot of open trades; 2 line - the number of all
The Pulse は、蓄積期間をリアルタイムで示す指標である。 簡単に言えば、蓄積とは、「スマートマネー」が市場で強力な動きを起こす前に静かに資産を集めることです。 チャート上では、価格が1つの範囲で「立ち往生」しているように見えます。 これは蓄積段階です-誰かが大きな動きの準備をしています。 そして、市場が"凍結"しているように見えるが、同時に緊張が感じられるときに、これらの瞬間に気づくことを学ぶなら、適切なタイミングで適切な場
さらに、 The Pulse インジケータは、各蓄積に対して計算を実行し、蓄積期間後の可能な価格ポテンシャルの方向を決定することができる。 The Pulse インジケータの助けを借りて、市場構造をよりよく見て理解することができます。
The Pulse Blog. The blog: Why every trader should have The Pulse indicator as an additional tool for trading. Version mt5 蓄積期間を決定することは、適切な瞬間を待つことができることを意味します。
This indicator help to mark the high and low of the session Asian,London,Newyork , with custom hour setting
This indicator is set to count from minute candle so it will move with the current market and stop at the designated hour and create a accurate line for the day.
below is the customization that you can adjust :
Input Descriptions EnableAsian Enables or disables the display of Asian session high and low levels.
EnableLondon Enables or disables the display of London session high and
The main idea of this indicator is rates analysis and prediction by Fourier transform. Indicator decomposes exchange rates into main harmonics and calculates their product in future. You may use the indicator as a standalone product, but for better prediction accuracy there is another related indicator - FreqoMaster - which uses FreqoMeterForecast as a backend engine and combines several instances of FreqoMeterForecast for different frequency bands. Parameters: iPeriod - number of bars in the ma
Williams Precision Prime – Precision Meets Legend Williams Precision Prime is a high-performance trend-following indicator that bridges the gap between Larry Williams' time-tested logic and modern algorithmic filtering, all wrapped in the exclusive Peak Precision design. Engineered for traders who demand clarity, stability, and mathematically sound entries, this system utilizes a triple-layer EMA strategy (100, 50, and 21) to identify high-probability "Cross-Momentum" setups within a confirmed d
AP VWAP Bands Pro (MT4) Volume-weighted average price with ±σ bands for clear intraday bias, mean-reversion zones, and dynamic support/resistance. Works on crypto (incl. BTC), FX, indices, and metals. Uses tick-volume when real volume isn’t available.
What it shows VWAP line (volume-weighted mean price).
Two envelopes around VWAP (default ±1σ and ±2σ) to highlight balance vs. extension.
Reset modes: Day, Week, or Anchor Time (HH:MM) to start VWAP where you need it (e.g., exchange open).
Why
The indicator shows the potential trend direction by cyclical-wave dependence. Thus, all the rays of the intersection will be optimal rays, in the direction of which the price is expected to move, taking into account the indicator period. Rays can be used as a direction for potential market movement. But we must not forget that the approach must be comprehensive, the indicator signals require additional information to enter the market.
SpreadChartOscillator is an indicator that displays the spread line of a symbol in the subwindow of the oscillator. In the parameters it is possible to specify another symbol from which the spread line will be broadcast. If the "Symbol" parameter is left empty, the spread line will be displayed from the current symbol on which the indicator is set. This tool is ideal for traders who want to see the spread dynamics in the oscillator format and use it to protect themselves from entering the market
The indicator analyzes the volume scale and splits it into two components - seller volumes and buyer volumes, and also calculates the delta and cumulative delta. The indicator does not flicker or redraw, its calculation and plotting are performed fairly quickly, while using the data from the smaller (relative to the current) periods. The indicator operation modes can be switched using the Mode input variable: Buy - display only the buyer volumes. Sell - display only the seller volumes. BuySell -
Dollar mint indicator is a special workmanship with years of experience in forex.
Dollar mint ea is a fully non repaint indicator optimised with price action data such that once it gives you a signal t . The indicator can be used to trade anything on the mt4 with much ease.
Benefits ;
Fully non repaint Use in any timeframe Use in all the available tradable assets on mt4
Best to use on h4. It generates fully analysed buy and sell signals based on trend and also filters out retracements and
TrendMaster Pro Alert: Your Professional Manual Trading Station Stop chasing the market and start leading it. TrendMaster Pro Alert is an interactive trading dashboard designed to simplify complex analysis and execute flawless trades. Key Features of TrendMaster Pro: Multi-Tier Trend Control: Stay on the right side of the market by monitoring M15, H1, and H4 trends simultaneously. No more trading against the major flow. Advanced Filter Suite: A powerful blend of ADX (momentum), RSI, and
Multicurrency indicator in table format. Signals appear with confirmation, do not redraw. The indicator works on the current (open) timeframe. Notifications come for an open instrument. The strategy includes: price touching the moving average in the direction of the trend, as well as an extraordinary recalculation of the classic ADX indicator to determine the trend as an additional filtering of entries. Entries are displayed on the chart as arrows and, as mentioned above, the arrows are not redr
The Signal Strength Meter is a Multi-Currency, Dual Timeframe Interactive Indicator, which calculates the strength of buy and sell signals, and displays a score for each symbol on a display board. Get a 7-Day Free Trial Version: Click Here (Full Access to The Indicator for 7 Days) Check Video Below For Complete Demonstration, and User Manual here . Key Features:
Allows you to see multiple currency signals from one chart Analyses the signals from more than a dozen classic indicators Identif
This indicator will mirror the assets in use in another metatrader, being able to choose the timeframe and a template. This is the Metatrader 4 Client, it needs the Metatrader 4 or 5 Server versions: Metatrader 4 Mirror Chart Server: https://www.mql5.com/en/market/product/88644
Metatrader 5 Mirror Chart Server: https://www.mql5.com/en/market/product/88652 Details of how it works in the video.
This indicator allow you to measure Profit/Loss of current, closed or future trade in account currency and estimate margin level at the trade close point. Profit/Loss indicator is based on MT4 native Crosshair instrument and has following inputs: Trade Direction = Buy/Sell Lot size = 0.1 Font size = 8 Font color = DeepSkyBlue Offset horizontal Offset vertical
The RSI Panel MTF indicator has been created in order to have the ability to monitor the values of the standard RSI indicator from a multitude of timeframes and symbols on a single chart, as well as to receive timely notifications about the trading opportunities using an audio signal or a notification. The indicator can output both the indicator values, and only the indicator signals (confirmed and expected). A user-friendly feature for selecting the required symbol has been implemented - simply
The Comparison indicator can be used as an independent trading system. It is based on the idea that some currency pairs follow each other. The indicator allows you to simultaneously display another chart on the chart of one currency pair, which allows you to anticipate some movements and quite accurately determine the beginning of trends.
The principle of trading by indicator signals is also simple: a currency pair, the chart of which is above, should be sold, and the one below, should be boug
New version 8.00 is available.
In this version, I tried to take into account the wishes of the user. Each of you can also take part in the improvement of this advisor. In the default settings, the adviser opens trades when the extremum point is broken standard indicator Zigzag. When the upper point of the zigzag extremum is broken, it opens a buy deal, and when the lower point of the zigzag extremum is broken, it opens a sell deal.
In addition to the standard ZigZag indicator, which
After purchase, contact me privately to receive 1 month of free testing with EA Forex Proton! This advanced MT4 trading robot automatically executes signals from any MT4 indicator, including Market Makers. The latest version also includes AI integration, allowing each trade signal to be analyzed using Artificial Intelligence. Live Signal with EA Forex Proton: Click here Market Makers is a powerful price action trading system designed to identify high-probability Buy and Sell opportunities based
12% OFF EASTER SALE An exclusive indicator that utilizes an innovative algorithm to swiftly and accurately determine the market trend. The indicator automatically calculates opening, closing, and profit levels, providing detailed trading statistics. With these features, you can choose the most appropriate trading instrument for the current market conditions. Additionally, you can easily integrate your own arrow indicators into Scalper Inside Pro to quickly evaluate their statistics and profitabi
Volatility Trend System - a trading system that gives signals for entries. The volatility system gives linear and point signals in the direction of the trend, as well as signals to exit it, without redrawing and delays.
The trend indicator monitors the direction of the medium-term trend, shows the direction and its change. The signal indicator is based on changes in volatility and shows market entries.
The indicator is equipped with several types of alerts. Can be applied to various trading ins
- Real price is 80$ - 40% Discount (It is 49$ now) Contact me for instruction, add group and any questions! - Non-repaint - I just sell my products in Elif Kaya profile, any other websites are stolen old versions, So no any new updates or support. - Lifetime update free Related product: Bitcoin Expert
Introduction The breakout and retest strategy is traded support and resistance levels. it involves price breaking through a previous level. The break and retest strategy is designed to help tr
12% OFF EASTER SALE The Reversal Master is an indicator for determining the current direction of price movement and reversal points. The indicator will be useful for those who want to see the current market situation better. The indicator can be used as an add-on for ready-made trading systems, or as an independent tool, or to develop your own trading systems. The Reversal Master indicator, to determine the reversal points, analyzes a lot of conditions since the combined analysis gives a more a
THE ONLY CURRENCY STRENGTH INDICATOR THAT IS BASED ON PRICE ACTION. DESIGNED FOR TREND, MOMENTUM & REVERSAL TRADERS
This indicator reads price action to confirm trend and strength . Advanced multi-currency and multi-time frame indicator that shows you simply by looking at one chart, every currency pair that is trending and the strongest and weakest currencies driving those trends.
For full details on how to use this indicator, and also how to get a FREE chart tool, please see user manual HERE
Wave and Cycle counter to give an immediate indication how far the ongoing trend has progressed.
Low numbers: trend has just started, ride the trend. Higher numbers: trend is 'older', watch for reversals
This indicator is 100% compatible with the fantastic TopDog trading strategy.
(I will NOT give any details about this Top Dog strategy)
The trend direction is determined by a SMA value (or any other MA) you can set.
Waves and cycles numbers and letters are derived from a SlowStoch setting.
Wave
*** 10 years profitable backtest on EURUSD (Jan 2010 - Jan 2020) ***
*** 10 years profitable backtest on GBPUSD (Jan 2010 - Jan 2020) ***
Just try it, in use by myself! USE ON 5 DIGIT BROKERS (1.12345) 5 MIN FRAME ONLY DEFAULT SETTINGS ARE READY FOR USE DESIGNED FOR EURUSD GBPUSD others possible see backtests The EA calculates promising entry points according a carefully developed algorithm, based on moving averages and many other factors
ユーザーは評価に対して何もコメントを残しませんでした