The Pulse mt4
- 지표
- 버전: 1.6
- 업데이트됨: 24 2월 2026
- 활성화: 10

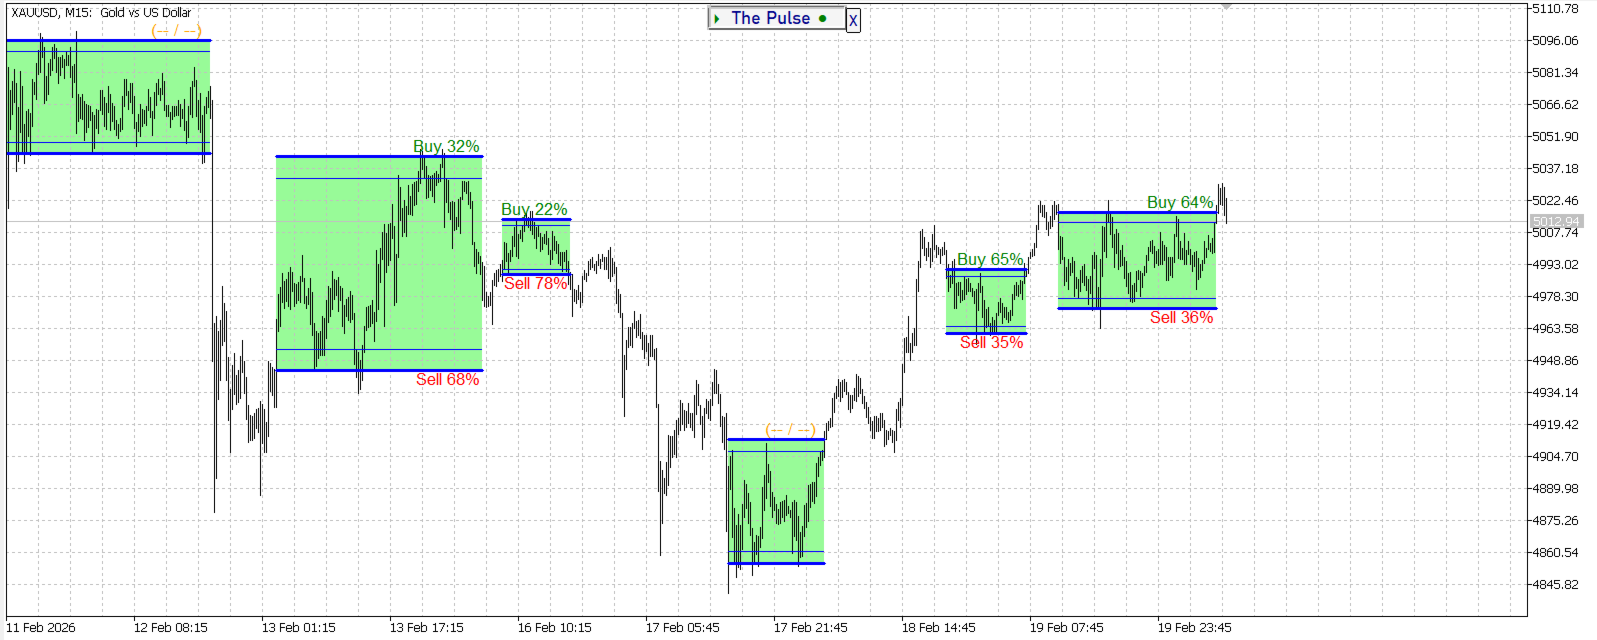
The Pulse 은 축적 기간을 실시간으로 보여주는 지표입니다.
간단히 말해서,축적은"스마트 머니"가 시장에서 강력한 움직임을 시작하기 전에 조용히 자산을 수집 할 때입니다.
차트에서는 가격이 한 범위에"붙어"있는 것처럼 보입니다. 이것은 축적 단계입니다—누군가가 큰 움직임을 준비하고 있습니다.
그리고 이러한 순간을 알아 차리는 법을 배우면—시장이"동결"하는 것처럼 보이지만 동시에 긴장이 느껴질 때-적절한 시간에 적절한 장소에있을 수 있습니다.
또한,The Pulse 표시기는 각 축적에 대한 계산을 수행하고 축적 기간 후에 가능한 가격 잠재력의 방향을 결정할 수 있습니다.
The Pulse 표시기의 도움으로 시장 구조를 훨씬 더 잘보고 이해할 수 있습니다 .
The Pulse Blog.
Version mt5
축적 기간을 결정하는 것은 적절한 순간을 기다릴 수 있다는 것을 의미합니다.The Pulse 표시기는 축적 기간을 나타내며 축적 가격은 원하는대로 움직일 수 있지만 대부분의 경우 움직임은 측면입니다
축적 기간은 다양한 방법으로 사용할 수 있습니다:
- 축적 기간 동안,당신은 시장에서 머물 수 있고 가격이 축적 된 에너지를 방출하고 움직이기 시작할 때까지 기다릴 수 있습니다.
- 적절한 기술과 경험을 통해 축적 내에서 거래 할 수 있습니다.
- 장기 가격 또는 추세 이동 후 축적이 나타나면 이전에 열린 거래를 검토하는 것이 더 나을 수 있습니다. 예를 들어,이익을 수정하거나 손익분기 점에 설정합니다.
지시자 The Pulse:
- 자동으로 축적 기간을 감지
- 색상 및 신호로 차트의 영역을 강조 표시합니다- 간단하고 이해할 수 있습니다.
-
축적 후 잠재력을 계산합니다.
- 표시기는 다시 그리지 않습니다.
- 모든 쌍 및 시간대에 작동합니다.
- 복잡한 설정이 없습니다.
이것이 거래에 어떻게 도움이 되나요? 구체적으로:
- 조기 진입. 주요 움직임 시작 전에 시장에 들어가면 더 많은 이익을 얻고 위험은 줄어듭니다.
- 손실 거래 감소. 잘못된 돌파와 소음을 피할 수 있습니다.
- 확신. 시장 구조를 볼 수 있게 됩니다.
- 규율. 지루함 때문에 거래하지 않고 기다리는 법을 배웁니다.
누적 지표 The Pulse 는 시장에서 너의 내부 나침반이다.
누적을 인식하는 방법을 배워라 - 그러면 너는 더 이상 시장의 수동적인 승객이 아닐 것이다. 너는 관찰자가 된다. 이해하는 사람. 자신감 있는 사람.
너는 현재의 모습만이 아니라 곧 올 것까지도 볼 수 있다.
이것은 마법이 아니다. 이것은 시장을 읽는 기술이다.


an easy tool to see accumulations and with it button it is easy to use an real plus in trading well done warmly