MACD colored
- インディケータ
-
AMS Trading
 We code Indicators and Experts in MT4 and MT5 for real traders requiring robust, modular, reliable and extensible systems.
• You're an IB or Trader with a clear trading recipe.
• We're engineers who build it with extensibility, stability and user-friendliness. - バージョン: 1.0
- アクティベーション: 20
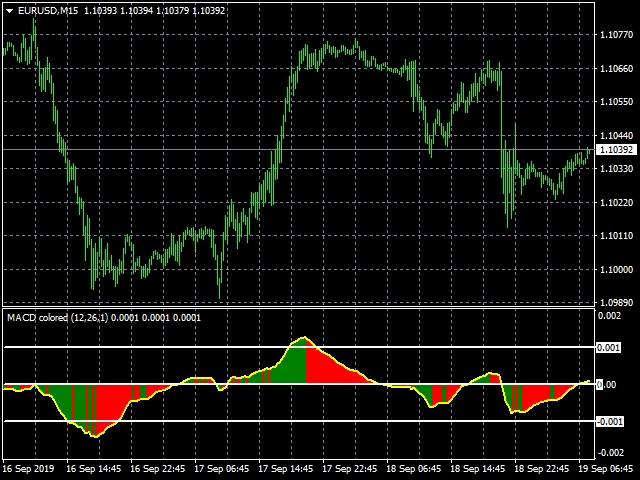
This indicator is based on the standard MACD indicator, but showing the changes up and down colored.
It is a nice assistance to visualize our Expert MAGIC MACD.
MAGIC MACD MT4: https://www.mql5.com/en/accounting/buy/market/41144?period=0
MAGIC MACD MT5: https://www.mql5.com/en/accounting/buy/market/41151?period=0
Inputs in the Indicator:
Fast EMA: standard is 12
Slow EMA: standard is 26
Signal: depending on what you want to see. For the MAGIC MACD the standard is 1
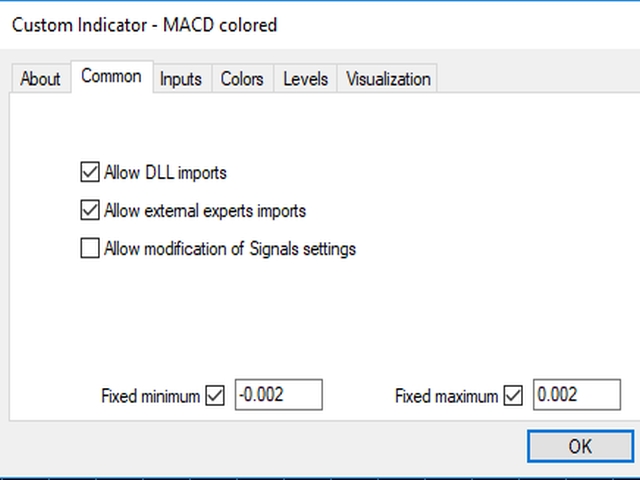
in common settings:
Fixed Minimum
Fixed Maximum
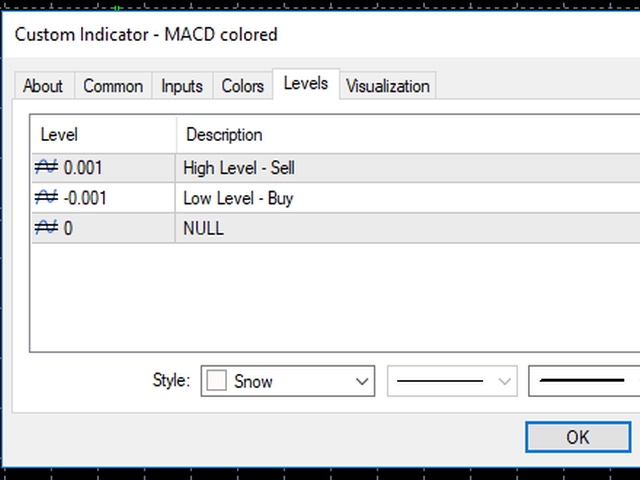
Levels:
Define Buy level - See Picture for the MAGIC MACD setting
Define Sell Level - See Picture for the MAGIC MACD Setting