DrawFibonacci MT4
- インディケータ
-
Kazuya Yamaoka
 FXトレーダー&FXライバー💹具体的な手順まで全てを配信📹ドル円中心🇺🇸🇯🇵定石に基づく9つのMetaTraderオリジナルインジケーターで収益化📈日々の収支も公開📊
 - バージョン: 1.1
- アップデート済み: 25 6月 2023
- アクティベーション: 5
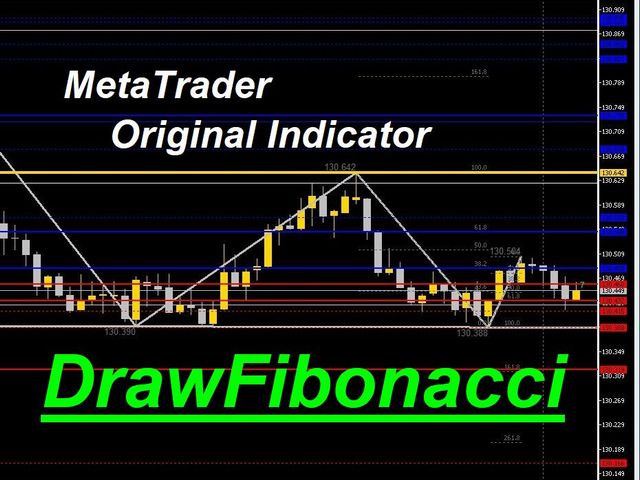
Fibonacci automatically draws Fibonacci retracement,
Because Fibonacci automatically draws Fibonacci retracement, you can know at a glance the price to buy at a push or sell back.
Therefore, you can trade in favorable conditions in a trending market.
The "PowerMap" is a bundle of four items ("DrawTurningPoint", "DrawHurdle", "DrawChartPattern", "DrawFibonacci").
Please be careful not to purchase more than one copy (duplicates).
We are live-streaming the actual operation of the system.
Please check for yourself if it is usable.
Please check it out for yourself.
We do not guarantee your investment results. Investments should be made at your own risk.
We sharll not be liable for any disadvantage or damage caused by the use of the information provided.