Adaptive Volatility Range
- インディケータ
-
Stanislav Konin
 I started my journey in Forex in 2017, and now I work in the stock market and futures.
I devote a lot of time to developing and testing effective trading systems. - バージョン: 1.17
- アップデート済み: 12 4月 2026
- アクティベーション: 7
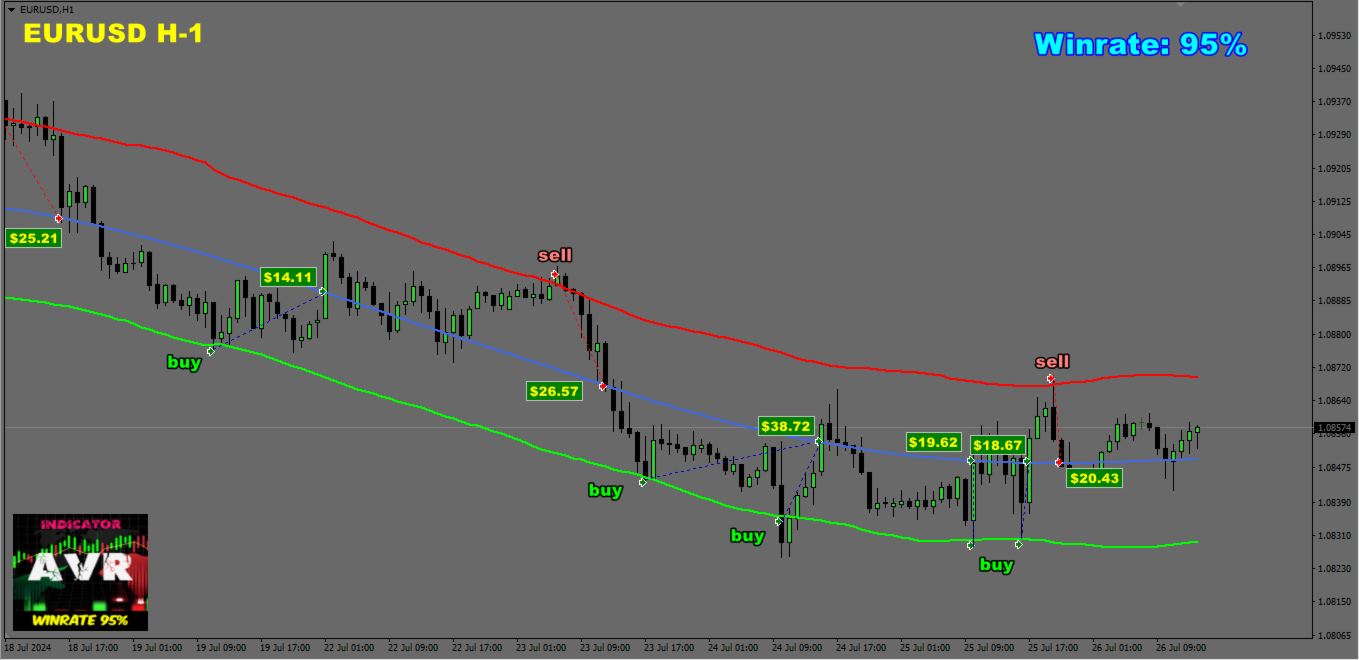
Adaptive Volatility Range [AVR] is a powerful tool for identifying key trend reversal points. AVR accurately reflects the Average True Range (ATR) of volatility, taking into account the Volume-Weighted Average Price (VWAP). The indicator adapts to any market volatility by calculating the average volatility over a specific period, ensuring a stable rate of profitable trades.
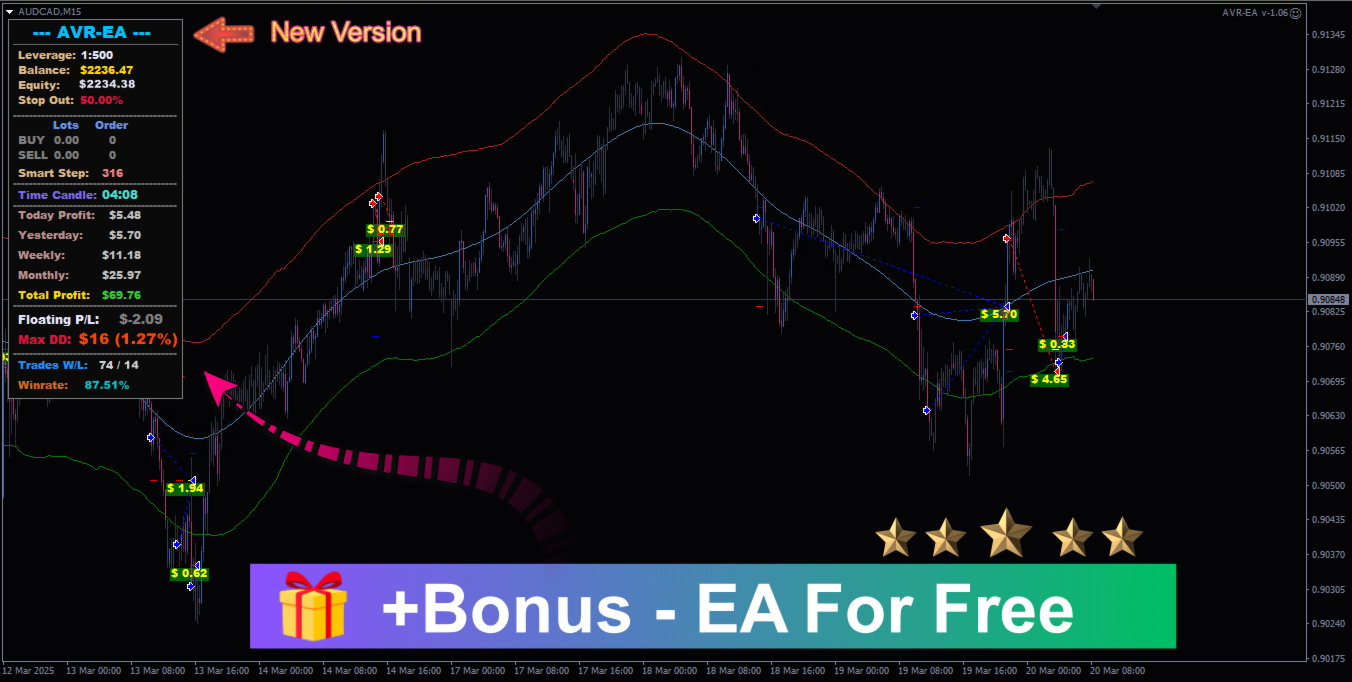
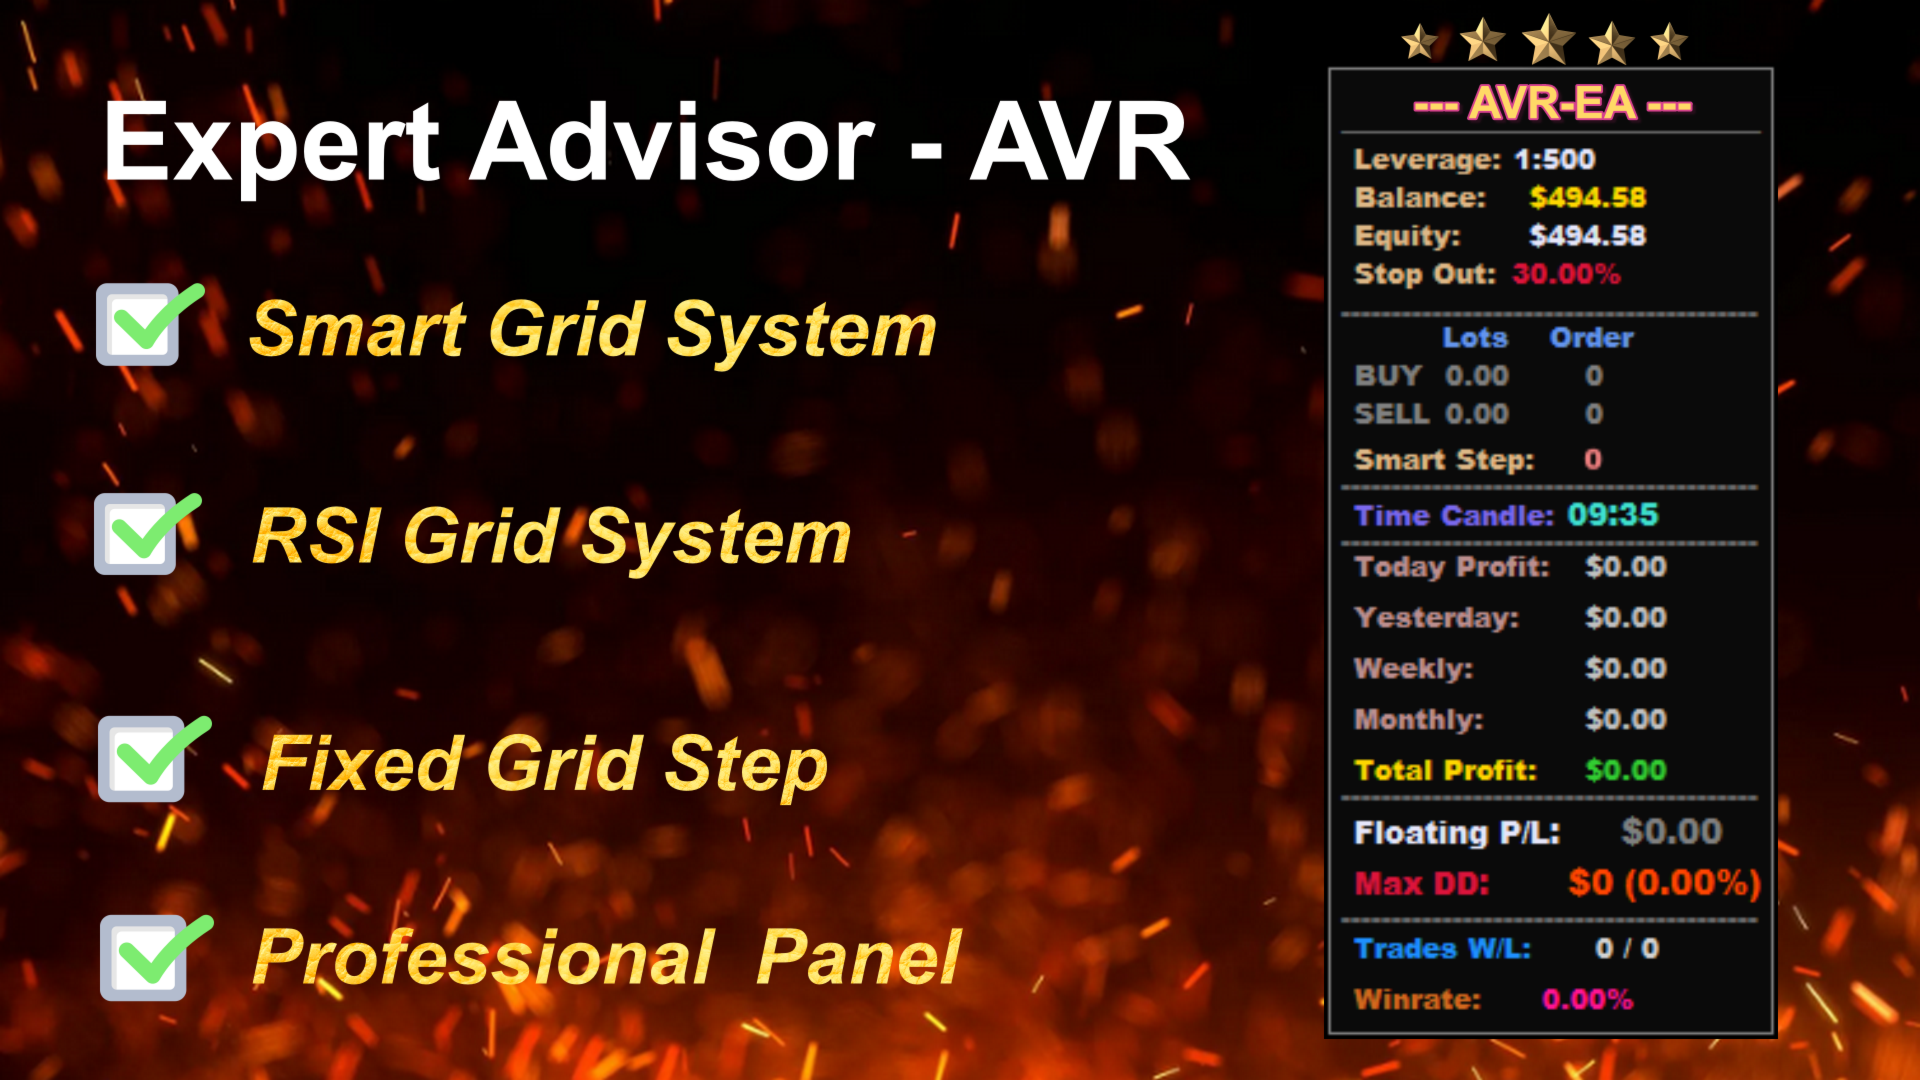
You receive not just an indicator but a professional automated trading system, AVR-EA.
Advantages:
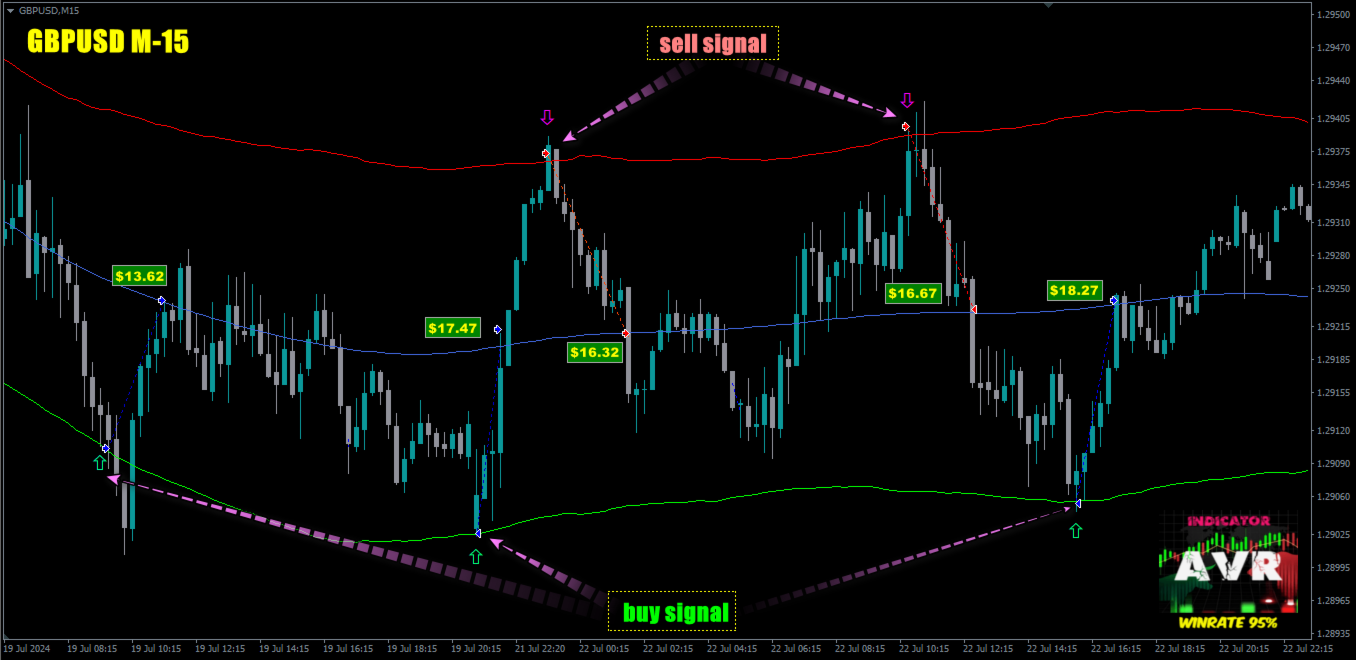
✅👉 100% No Repaint – all lines and signal arrows are generated as data arrives and remain unchanged.
✅ Two signal generation algorithms have been developed:
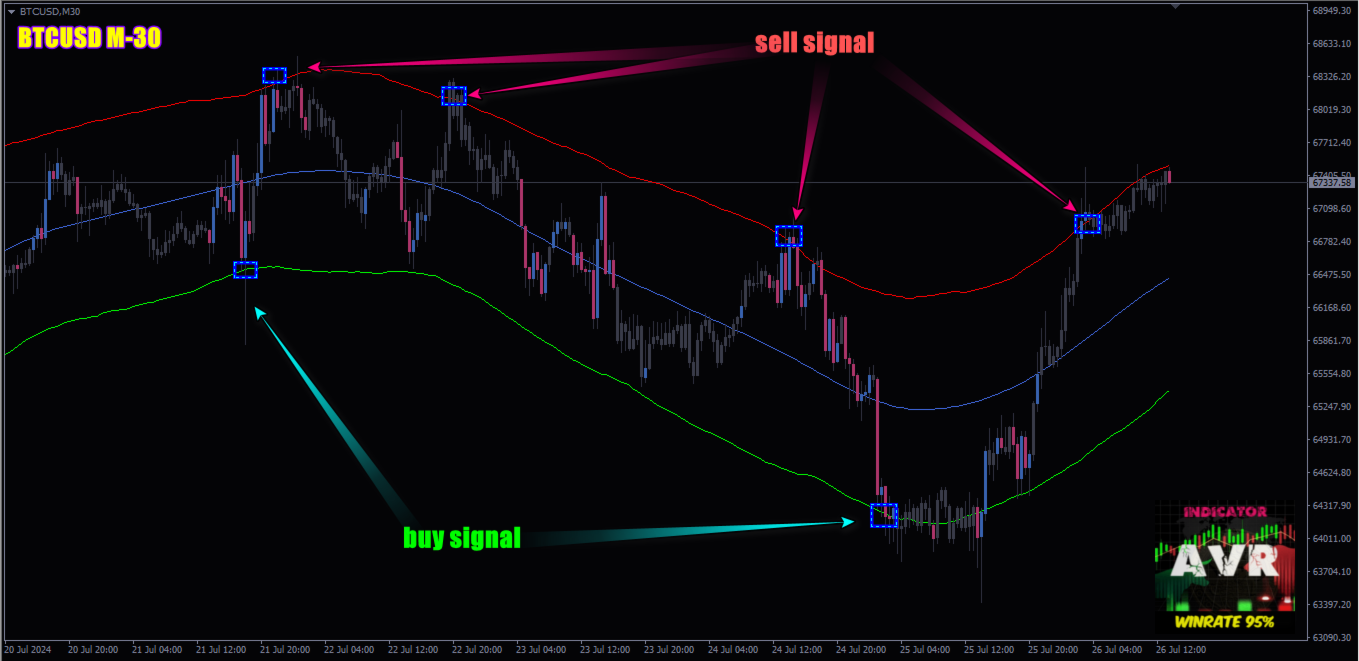
- Algorithm 1 (Classic) – a signal is generated when the price breaks through the channel boundary and then returns inside.
- Algorithm 2 (Smart Algorithm) – a unique development that enables intelligent signal filtering to improve input accuracy and eliminate false alarms.
- Switching is accomplished using the ENABLE SMART ALGORITHM = true/false parameter.
✅ Suitable for both beginners and experienced traders.
📢 Alerts and Notifications
AVR supports all types of notifications:
🔔 Pop-up notifications
🔔 Email alerts
🔔 Push notifications
Recommendations:
-
Place Take Profit inside the range at the volume-weighted average price level, and set Stop Loss outside the levels of volatility excellence.
-
Use the ATR Multiplier greater than 3.0 on M1, M5, and M15 timeframes for maximum precision.
Trading Strategies:
-
Trend-following strategy: Used to determine the direction of the trend.
-
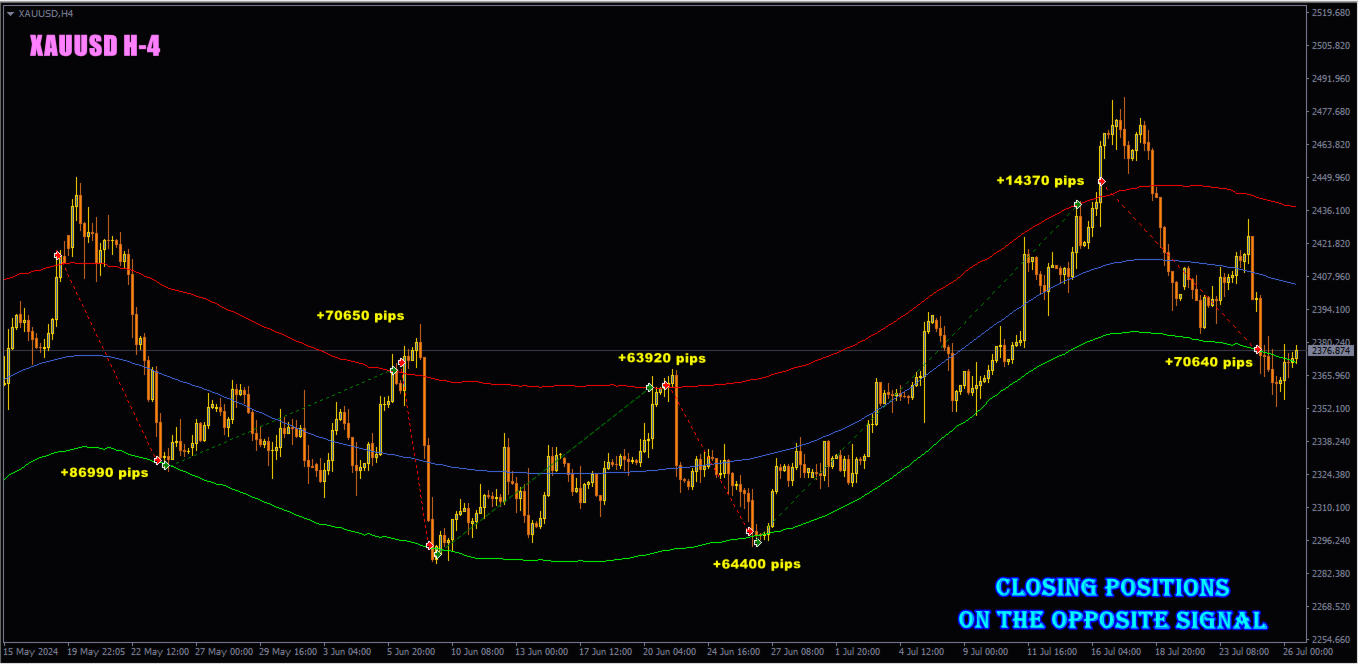
Reversal strategy: AVR is best suited for reversal strategies. When the volatility of the traded instrument exceeds the average volatility over a certain period, there is a high probability of price returning to the mean.
Based on AVR-EA it is possible to build a successful trading system with a positive mathematical expectation, which is the ultimate goal of forex trading.
----- Please contact me after purchase to receive great bonuses ------
1.👉 AVR-EA Advisor
2.👉 A separate version of the indicator used by the advisor
Рекомендую всем данный индикатор, кто строит свою торговлю на основе волатильности, среднего хода и объемах. На основании данного индикатора я могу строить свои прогнозы на текущий день и неделю, в зависимости от тайм фрейма, индикатор имеет режим MTF. Индикатор очень "легкий", никак не влияет на скорость терминала. Автор индикатора оказывает максимальную поддержку и предоставляет подробную информацию.