Di Napoli Squat MT4
- インディケータ
- バージョン: 1.0
- アクティベーション: 15

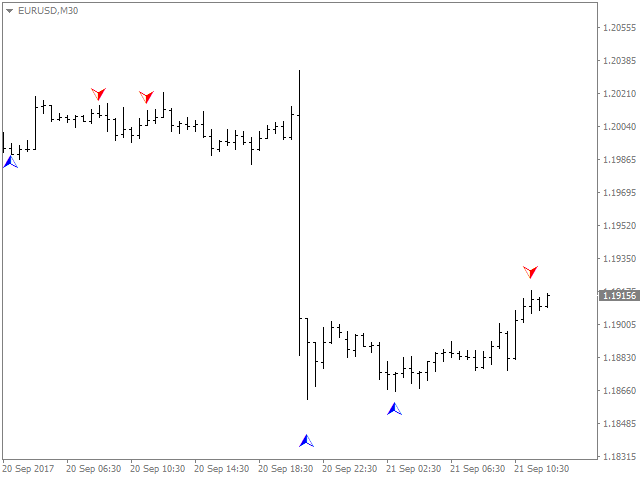
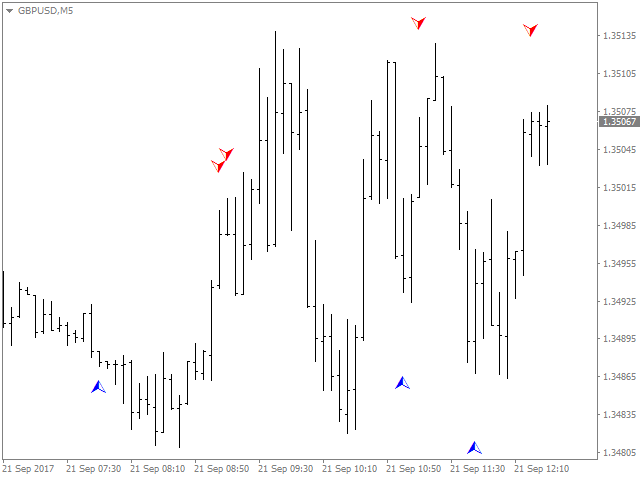
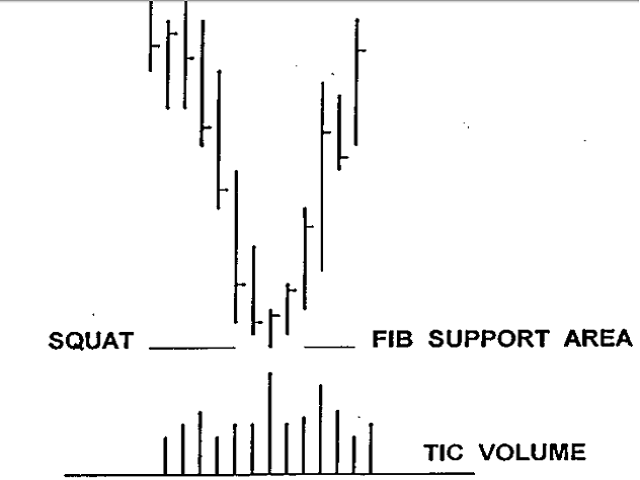
The Squat is a function of the range of a given price bar and the volume, or TIC volume, that occurs while that range is being created. The basic idea is that high volume and little price movement indicate substantial support or resistance. The idea behind the approach to this indicator is to first look for likely Fibonacci support and resistance and then see if Squat manifests when that point is reached. The indicator determines one of the high probability patterns of DiNapoli. It does not repaint.
SQUAT - greater volume and a smaller MFI than the previous bar has.
- MFI: rb/v
- rb: Range of the bar in tics or points
- v: Volume
Market Entry/Exit Techniques after the signal
- Entry: First shallow retracement on lower timeframes then Squat signal timeframe (up to trader)
- Stop: Bottom of bar which Squat signal occured (up to trader)
- Take Profit: Up to trader depending of money management techniques (up to trader)
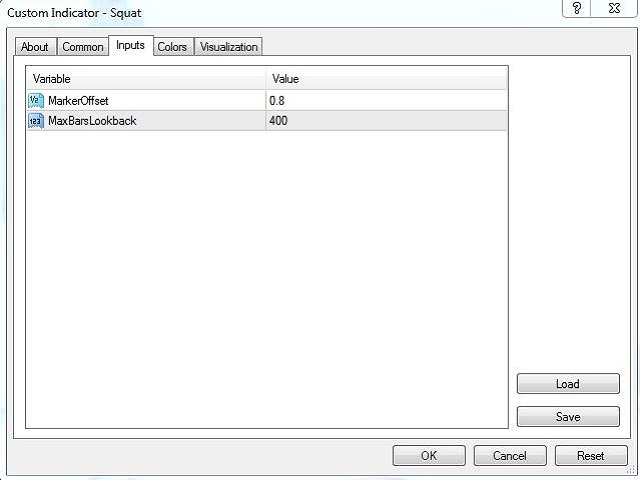
Parameters
- Marker Offset: Adjust display location of signal on a chart
- Max Bars Lookback: Adjust number of bars for the indicator to look back.
For MT5 version, please visit ► https://www.mql5.com/en/market/product/52778
ユーザーは評価に対して何もコメントを残しませんでした