Scalper Inside Volume Pro

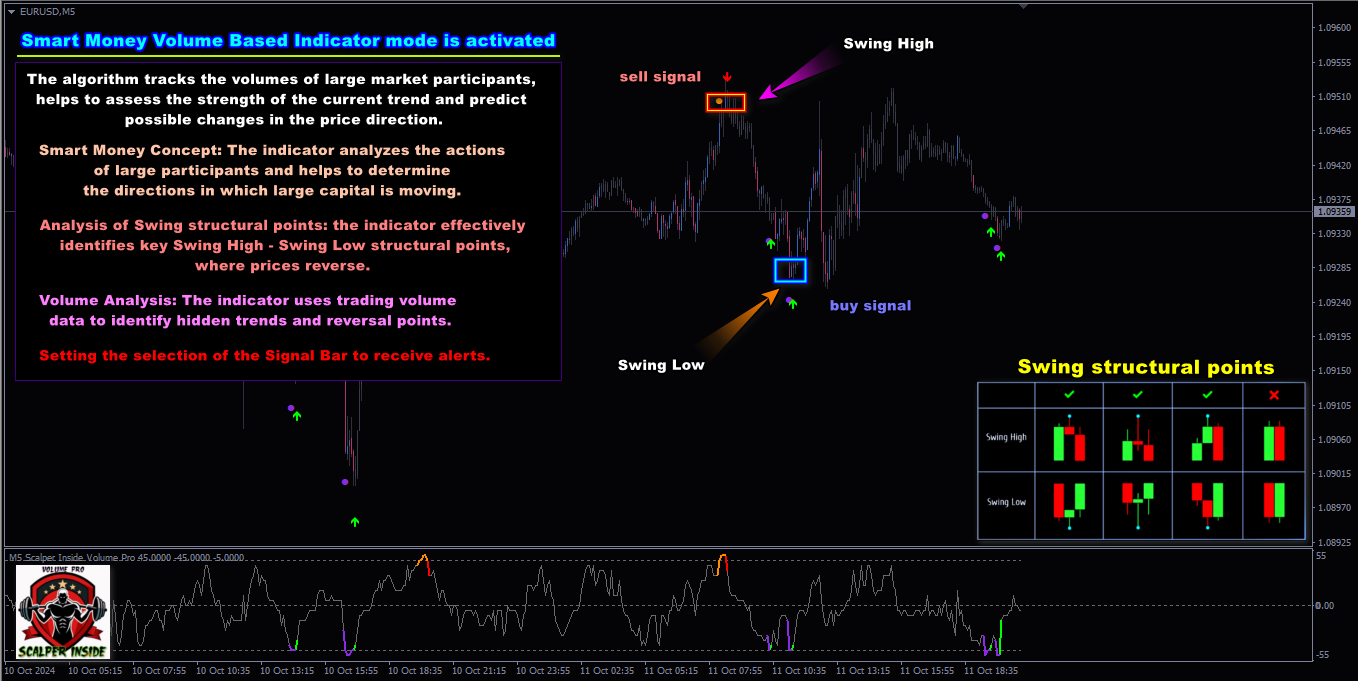
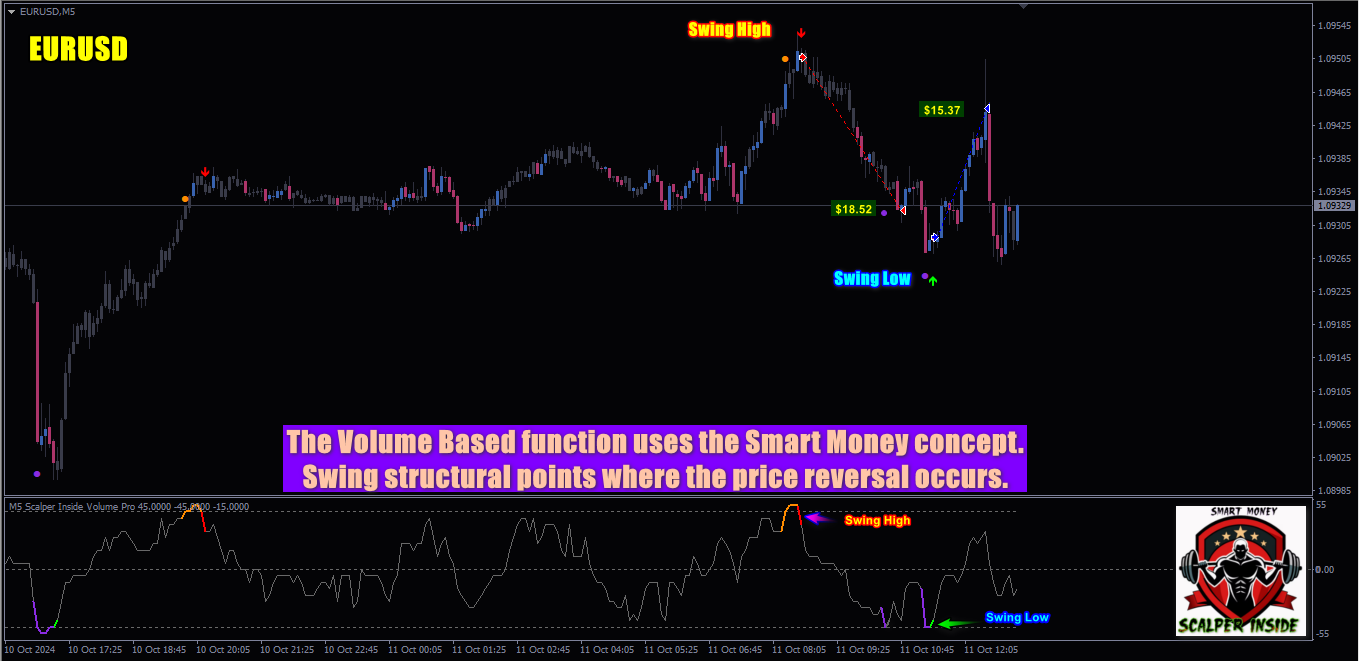
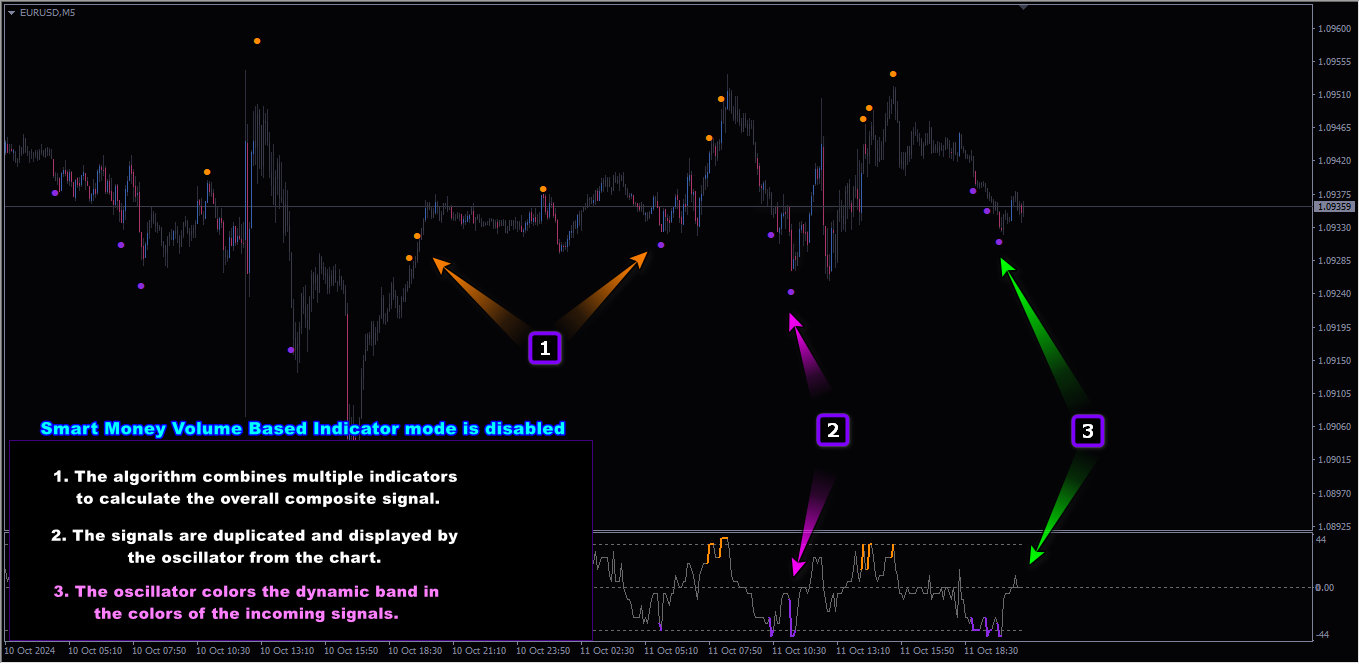
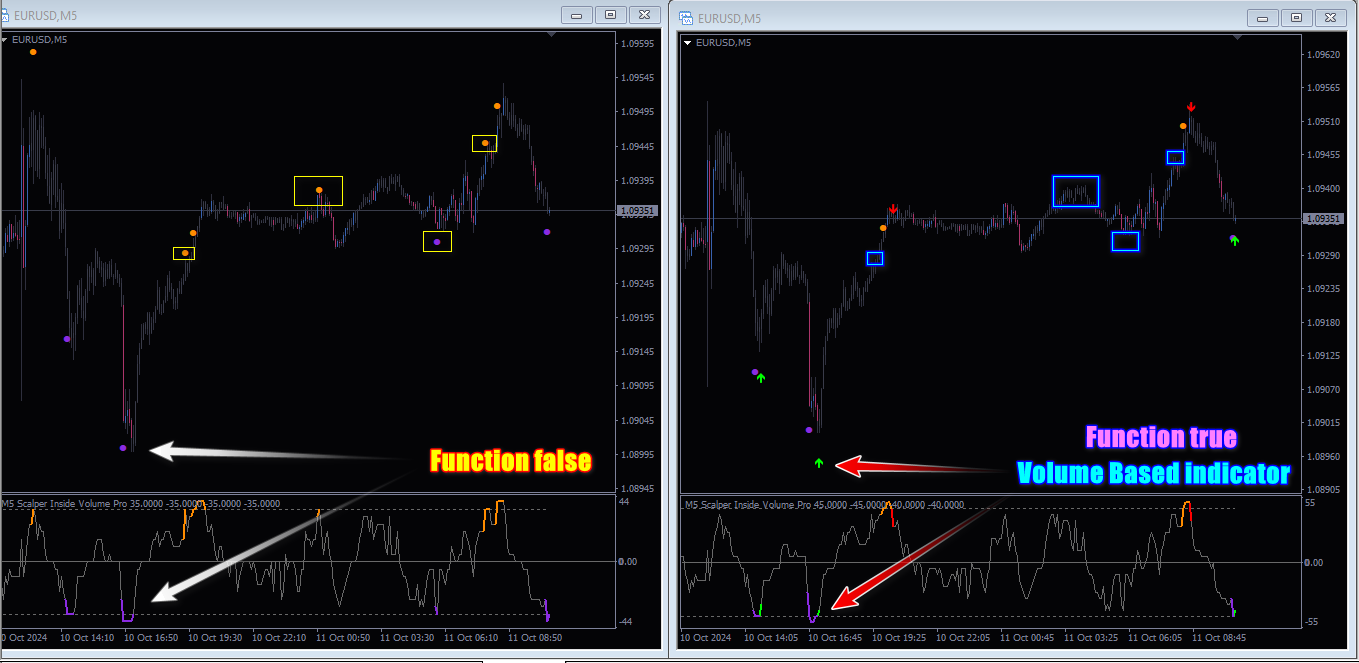
Scalper Inside Volume Pro is a professional trading system that combines multiple indicators to calculate an overall composite signal. It is based on an algorithm focused on volume, the Money Flow Index, and the Smart Money concept. The indicator takes into account structural Swing points where price reversals occur.

Scalper Inside Volume Pro provides all the necessary tools for successful scalping. This comprehensive trading system is suitable for traders in the Forex market as well as for use in binary options. With its help, you can make informed decisions and enhance the effectiveness of your trading.

Key Features:

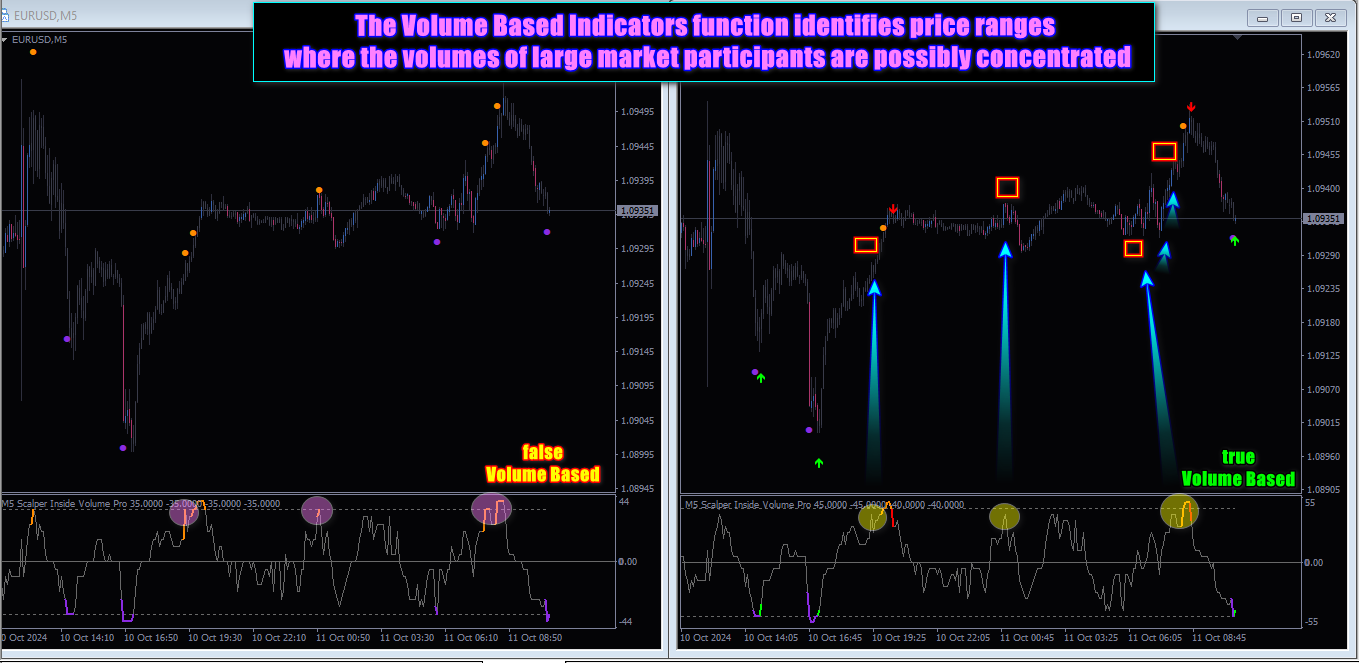
  • Volume Analysis: The indicator uses trading volume data to identify hidden trends and reversal points, helping traders make informed decisions.

  • Money Flow Index: The inclusion of the Money Flow Index allows for assessing the strength of the current trend and predicting its further development.

  • Smart Money Concept: Scalper Inside Volume Pro is based on smart management principles, enabling traders to better understand the behavior of "smart money" in the market. The indicator analyzes the actions of major participants and helps identify the directions in which large capital is moving, leading to more informed trading decisions.

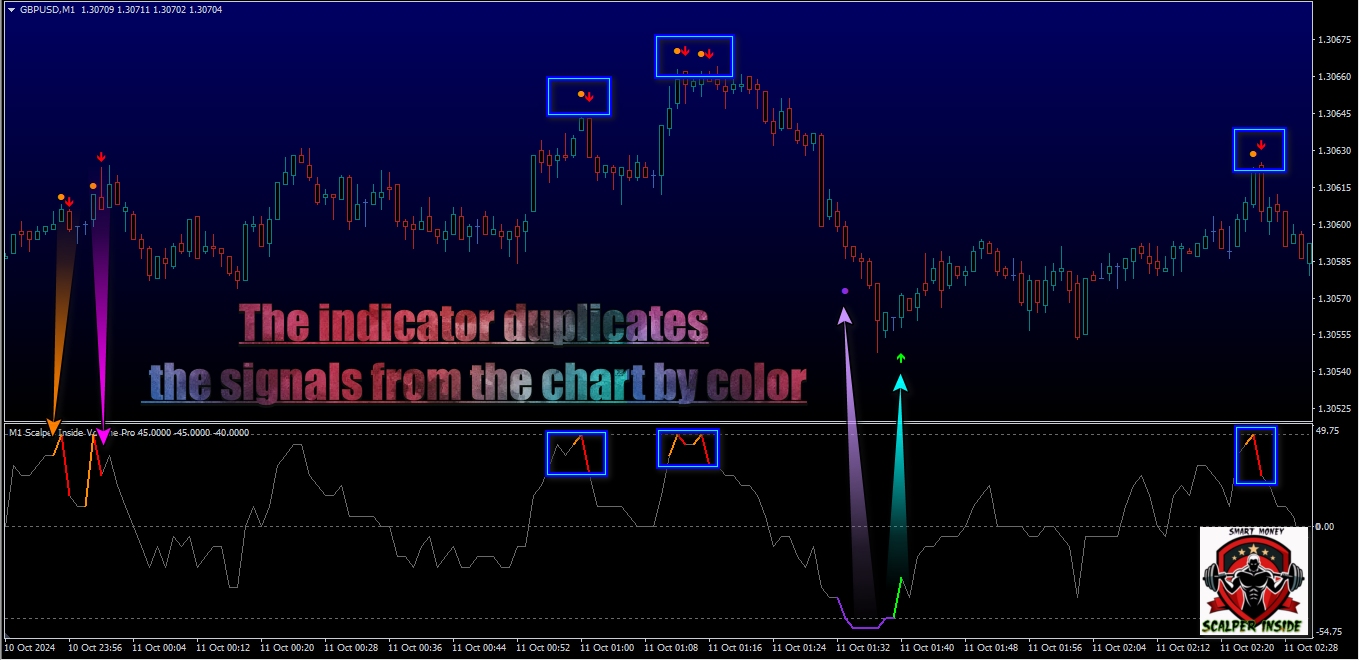
  • Swing Structural Point Analysis: The indicator effectively identifies key structural Swing High and Swing Low points where price reversals occur. This allows traders to lock in profits at the most advantageous levels and minimize losses using data on potential reversal points.

Advantages:

  • Wide Applicability: Scalper Inside Volume Pro is suitable for both Forex trading and binary options, providing versatility across various trading strategies.

  • Comprehensive Approach: The indicator offers traders all the necessary tools for analysis and decision-making, significantly simplifying the trading process.

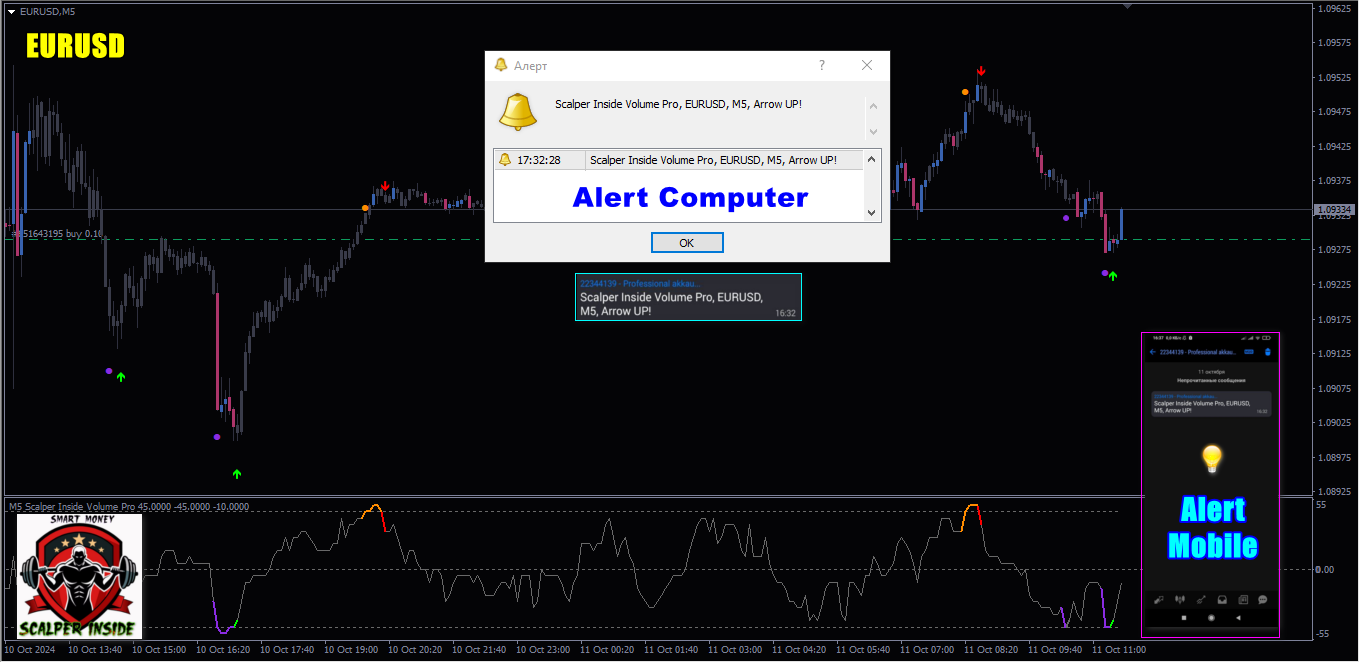
  • Instant Notifications: The indicator supports all types of alerts, including PUSH notifications to your phone, keeping you updated on important signals and allowing for quick market responses.

  • Customizable Signals: The ability to select a Signal Bar for alerts allows you to tailor the indicator to your individual preferences.

Recommendations

For more precise signals, use the level settings.

  • Time frame: M-1  in the range Level Overbought  from 50 to 55, Level Oversold from -50 to -55
  • Time frame:   M-5   in the Level Overbought range from 45 to 50,   Level Oversold   from -45 to -50
  • Time frame:   M-15   in the Level Overbought range from 40 to 45,   Level Oversold   from -40 to -45

Conclusion:

Scalper Inside Volume Pro is the ideal tool for traders looking to enhance their efficiency and profitability. Discover new horizons in scalping and improve your trading results with this reliable indicator that combines volume analysis, the Smart Money concept, and Swing structural points.


おすすめのプロダクト
Reversal Pattern AI is a groundbreaking advancement in indicator development, combining artificial intelligence algorithms, multi-level market analysis, and classical technical analysis methods. It not only detects reversal patterns but also evaluates market inefficiencies, generating highly accurate trading signals.Thanks to its hybrid model, which utilizes price action analysis, volume, volatility, VWAP, and Volume AVG %, the indicator easily adapts to any market conditions. Reversal Pattern A
Was: $249  Now: $99   Market Profile defines a number of day types that can help the trader to determine market behaviour. A key feature is the Value Area, representing the range of price action where 70% of trading took place. Understanding the Value Area can give traders valuable insight into market direction and establish the higher odds trade. It is an excellent addition to any system you may be using. Blahtech Limited presents their Market Profile indicator for the MetaTrader community. Ins
SMC Venom Model BPR インジケーターは、スマート マネー (SMC) コンセプトで取引するトレーダー向けのプロフェッショナル ツールです。価格チャート上の 2 つの主要なパターンを自動的に識別します。 FVG   (フェアバリューギャップ) は、3 本のローソク足の組み合わせで、最初のローソク足と 3 番目のローソク足の間にギャップがあります。ボリュームサポートのないレベル間のゾーンを形成し、価格修正につながることがよくあります。 BPR   (バランス価格範囲) は、2 つの FVG パターンの組み合わせで、「ブリッジ」を形成します。これは、価格がボリュームアクティビティの少ない動きで動くときに、ブレイクアウトしてレベルに戻るゾーンで、ローソク足の間にギャップを作成します。 これらのパターンは、大規模な市場プレーヤーと一般参加者の相互作用が発生するチャート上のボリュームと価格動向の分析に基づいて、トレーダーが主要なサポート/レジスタンス レベル、ブレイクアウト ゾーン、エントリ ポイントを識別するのに役立ちます。 インジケーターは、長方形と矢印の形でパターンを視
Mean Reversion Supply Demand Indicator Mean Reversion Supply Demand is the indicator to detect the important supply demand zone in your chart. The concept of supply demand trading relies on the quantity mismatching between buying and selling volumes in the financial market. Typically, supply demand zone serves to predict the turning point. The wave pattern, for any supply demand zone to work as an successful trade, looks like the price must touch the base zone, move away and then return to zone
プロトレーダーおよび評価型アカウント(Prop)向けリスク管理・制限監視インジケーター 本ツールは、リスク管理と各種リミットに関する情報をチャート上に表示するのみで、より集中した意思決定をサポートします。インジケーターはポジションの新規/決済/変更を行わず、エキスパートアドバイザー(EA)と干渉しません. 機能 日次および累計ドローダウンの監視 残高(Balance)または有効証拠金(Equity)を基準に日次/累計DDを計算・表示(設定可能)。 設定したリミットまでの残り割合を表示。 チャート上のクリーンでプロフェッショナルなパネル サマリー表:Balance、Equity、現在のP/L、日次/累計DD、アラート閾値。 判断に集中できる読みやすいUI。 リスクに基づくポジションサイズ パーセンテージ/固定金額のリスクと設定したストップロスに基づき概算ロットを算出。 R:R(リスクリワード)比とエントリー、SL、TPをチャートに表示。 アラートと通知 日次/累計DDの閾値に近づいた際にアラート(閾値は設定可能)。 価格がSL/TPに到達、またはその他の定義済みイベント発生時に通知。
A technical indicator that calculates its readings on trading volumes. In the form of a histogram, it shows the accumulation of the strength of the movement of the trading instrument. It has independent calculation systems for bullish and bearish directions. Works on any trading instruments and time frames. Can complement any trading system. The indicator does not redraw its values, the signals appear on the current candle. It is easy to use and does not load the chart, does not require addition
インディケータは現在のクオートを作成し、これを過去のものと比較して、これに基づいて価格変動予測を行います。インジケータには、目的の日付にすばやく移動するためのテキスト フィールドがあります。 オプション: シンボル - インジケーターが表示するシンボルの選択; SymbolPeriod - 指標がデータを取る期間の選択; IndicatorColor - インジケータの色; HorisontalShift - 指定されたバー数だけインディケータによって描画されたクオートのシフト; Inverse - true は引用符を逆にします。false - 元のビュー。 ChartVerticalShiftStep - チャートを垂直方向にシフトします (キーボードの上下矢印)。 次は日付を入力できるテキストフィールドの設定で、「Enter」を押すとすぐにジャンプできます。
M & W Pattern Pro is an advanced scanner for M and W patters , it uses extra filters to ensure scanned patterns are profitable. The indicator can be used with all symbols and time frames. The indicator is a non repaint indicator with accurate statistics calculations. To use , simply scan the most profitable pair using the statistics dashboard accuracy , then enter trades on signal arrow and exit at the TP and SL levels. STATISTICS : Accuracy 1 : This is the percentage of the times price hits TP
QuantumEdge Trader v1.0 AI-Powered Precision Signals for Serious Traders QuantumEdge Trader is a smart and reliable indicator that delivers accurate BUY and SELL signals using advanced market analysis and trend detection. Designed for M1 to M60 timeframes, it's ideal for scalping and intraday strategies. --- Key Features: No Repaint – Signals never change after appearing Smart trend filters to reduce noise Adjustable sensitivity and alerts Perfect for XAUUSD, EURUSD, and m
This is a new strategy for SUPPLY DEMAND areas It is based on a calculation using the tick volume to detect the big price action in market for both bear /bull actions this smart volume action candles are used to determine the supply and demand areas prices in between main supply and demand lines indicate sideway market  up arrows will be shown when prices moves above the main supply and the secondary supply lines Down arrows will be shown when prices moves below the main demand and the secondary
AWキャンドルパターンインジケーターは、強力なキャンドルパターンスキャナーと組み合わせた高度なトレンドインジケーターの組み合わせです。これは、最も信頼性の高い30のローソク足パターンを認識して強調表示するための便利なツールです。さらに、それは色付きのバーに基づく現在の傾向分析器です。     サイズ変更と配置が可能なプラグインマルチタイムフレームトレンドパネル。トレンドフィルタリングに応じてパターンの表示を調整する独自の機能。 利点: キャンドルパターンを簡単に識別 結果を再描画しません 内蔵のマルチタイムトレンドパネル 無効なパターンタイプ(1、2、3キャンドル) パターン表示時のトレンドフィルタリングの調整 MT5 version - >   HERE   / Instructions and description  -> HERE 表示されるパターンのリスト: ハンマーパターン ピンアップ/ピンダウン 弱気なハラミ/強気なハラミ 弱気のハラミクロス/強気のハラミクロス ピボットポイント反転アップ/ピボットポイント反転ダウン ダブルバーローとハイクローズ/ダブルバーローとロークロ
MT4 バージョン: https://www.mql5.com/ja/market/product/166784 MT5 バージョン: https://www.mql5.com/ja/market/product/166785 流動性プロファイル 流動性プロファイルは、動的なヒートマップ形式のプロファイルを用いて、チャート上に潜在的な流動性ゾーンをマッピングする、視覚的な市場構造ツールです。 このインジケーターは、過去の価格変動とティックボリュームを分析し、流動性が集中している可能性のある価格帯を強調表示します。描画内容は以下のとおりです。 流動性ライン(潜在的な反応/スイープレベル) ヒートマッププロファイルボックス(流動性集中ゾーン) POC/最大流動性レベル(検出された最高集中度) この結果、トレーダーが以下の点を特定しやすくなる、分かりやすい視覚的なプロファイルが作成されます。 潜在的なマグネットレベル 可能性のあるスイープゾーン 現在の価格の上下の反応エリア エントリー、エグジット、リスク管理のコンテキスト 主な機能 動的な流動性ヒートマッププロファイル
Volume Profile Sniper v11.1は、包括的な市場分析ツールです 取引への専門的なアプローチ ボリュームプロファイルスナイパー v11.1は、市場状況の包括的な評価に基づいて明確な信号を提供し、一つの指標に15以上の主要なフィルタを組み合わせ 主な特長 ボリューム不均衡分析-アルゴリズムは、各キャンドルの買い手と売り手のシェアを計算し、当事者の1つの優位性を通知します(50%から90%までの設定可能なしきい値)。 マルチレベル信号フィルタリング-インジケータは考慮されます: トレンド指標(9/21) 買われ過ぎ/売られ過ぎゾーンを除くRSI キャンドルパターン(ピンバー、吸収、ハンマー) サポート/抵抗レベル(自動検出) 主要なプレーヤーの活動を識別するためのボリュームスパイク クラシックと増幅されたRSIの相違 ボラティリティ評価のためのATR 傾向の強さを決定するためのADX 価格アクション(内部バーと外部バー) 複数の時間枠の確認 市場構造(高値/安値) セッションフィルタ(アジア、ロンドン、ニューヨークセッション) ニュースの
This unique multi-currency strategy simultaneously determines the strength of trends and market entry points, visualizing this using histograms on the chart. The indicator is optimally adapted for trading on the timeframes М5, М15, М30, Н1. For the convenience of users, the indicator renders the entry point (in the form of an arrow), recommended take profit levels (TP1, TP2 with text labels) and the recommended Stop Loss level. The take profit levels (TP1, TP2) are automatically calculated for
This indicator is another variant of the famous powerful indicator Fibonacci-SS https://www.mql5.com/en/market/product/10136 but has different behaviour in placing Pending Order and TP Line. Automatically places Fibonacci retracement lines from the last highest and lowest visible bars on the chart with: An auto Pending Order (Buy/Sell). Taking Profit 1, Taking Profit 2 is pivot point and Taking Profit 3 for extended reward opportunity. The best risk and reward ratio. Simple and powerful indicat
The   Quantitative Qualitative Estimation   (QQE) indicator is derived from Wilder’s famous Relative Strength Index (RSI). In essence, the QQE is a heavily smoothed RSI. Modification of this version: (   converted from tradingview   script by Mihkell00, original from Glaz, 100% identical output) So there are Two QQEs. One that is shown on the chart as columns, and the other "hidden" in the background which also has a 50 MA   bollinger band   acting as a zero line. When both of them agree - y
フラットとトレンドを決定するための指標。 価格が2つのヒストグラムと2つの線(赤と青)のいずれかを下回っている場合、これは売りゾーンです。 このバージョンのインジケーターを購入するときは、1つの実際のアカウントと1つのデモアカウント用のMT4バージョン-ギフトとして(受け取るには、プライベートメッセージを書いてください)! 価格が2つのヒストグラムと2つの線(赤と青)のいずれかを上回っている場合、これは購入ゾーンです。 MT4バージョン: https//www.mql5.com/en/market/product/3793 価格が2つの線の間、またはいずれかのヒストグラムのゾーンにある場合、市場に明確な傾向はありません。簡単に言えば、市場は横ばいです。 インジケーターの動作は、スクリーンショットでより明確に示されています。
El indicador "MR BEAST ALERTAS DE LIQUIDEZ" es una herramienta avanzada diseñada para proporcionar señales y alertas sobre la liquidez del mercado basándose en una serie de indicadores técnicos y análisis de tendencias. Ideal para traders que buscan oportunidades de trading en función de la dinámica de precios y los niveles de volatilidad, este indicador ofrece una visualización clara y detallada en la ventana del gráfico de MetaTrader. Características Principales: Canal ATR Adaptativo: Calcula
F ully automated Expert Advisor using the  advanced   algorithm for trading the EURUSD Designed for profit in a short period of time and big profit in a long run. Prefers EURUSD 1H. Principle of operation The SELL and BUY orders are opened (depending on the parameters set), guided by signals and the market situation.     Recommended parameter: Use an ECN broker account. minimum deposit of 100$ USD. use it in H1 time frame recommended symbol is EURUSD input parameter: TrendType                 
Gioteen Volatility Index (GVI)   - your ultimate solution to overcoming market unpredictability and maximizing trading opportunities. This revolutionary indicator helps you in lowering your losing trades due to choppy market movements. The GVI is designed to measure market volatility, providing you with valuable insights to identify the most favorable trading prospects. Its intuitive interface consists of a dynamic red line representing the volatility index, accompanied by blue line that indicat
Koala Supply Demand
Ashkan Hazegh Nikrou
5 (3)
Koala Supply Demand のご紹介 ( 他のトレーダーがあなたの経験から学べるよう、良いレビューでも悪いレビューでも、ぜひフィードバックを共有してください。)  Koala Supply Demand インジケーターへようこそ。このインジケーターは、異なる時間足における 未ブレイクの供給・需要ゾーン を識別するために設計されています。このインジケーターは、トレーダーが市場をゾーンエリアとして視覚的に把握するのに役立ちます。価格が強力なゾーンをどのように尊重しているかを見ることができ、またゾーン内部で形成された場合にはプライスアクションシグナルも表示します。 MSB コンセプトと Supply and Demand を組み合わせた 最も関連性の高い製品 はこちらで利用可能です :   ダウンロード また、取引管理用として Trade Board をダウンロードできます :   ダウンロード Supply Demand コンセプト についてさらに学ぶ : 記事 さらに多くの無料製品を入手 するために私の MQL5 チャンネルへ参加してください : 参加 Koala Suppl
FREE
これは、キャンドルの終値を予測する指標です。 このインジケータは、主にD1チャートでの使用を目的としていますが. この指標は、従来の外国為替取引とバイナリオプション取引の両方に適しています。 インジケーターは、スタンドアロンのトレーディングシステムとして使用することも、既存のトレーディングシステムへの追加として機能させることもできます。 このインジケーターは、現在のキャンドルを分析し、キャンドル自体の内部の特定の強度係数と、前のキャンドルのパラメーターを計算します。 したがって、この指標は、市場の動きのさらなる方向性と現在のキャンドルの終値を予測します。 この方法のおかげで、この指標は、短期の日中取引だけでなく、中期および長期の取引にも適しています。 インジケーターを使用すると、市場の状況の分析中にインジケーターが生成する潜在的な信号の数を設定できます。 インジケーターの設定には、このための特別なパラメーターがあります。 また、インジケーターは、チャート上のメッセージの形式で、電子メールで、およびPUSH通知の形式で、新しい信号について通知することができます。 購入後は必ず私に書いて
TWO PAIRS SQUARE HEDGE METER INDICATOR Try this brilliant 2 pairs square indicator It draws a square wave of the relation between your two inputs symbols when square wave indicates -1 then it is very great opportunity to SELL pair1 and BUY Pair2 when square wave indicates +1 then it is very great opportunity to BUY pair1 and SELL Pair2 the inputs are : 2 pairs of symbols         then index value : i use 20 for M30 charts ( you can try other values : 40/50 for M15 , : 30 for M30 , : 10 for H1 ,
このインジケータは、横ばいを検出し、検出された領域を色の付いた四角形で塗りつぶします。 このインディケータの主なアイデアは、価格がチャート上の特定の領域を埋 めたときにフラットを検出することです。 入力パラメータ Color rectangle - 影を付ける矩形の色。 Bars in rectangle - 長方形内のバーの最小許容数。 Density in % - 平坦の密度。矩形の面積に対するパーセンテージで設定。 __________________________________________________________________ __________________________________________________________________
The Th3Eng PipFinite indicator is based on a very excellent analysis of the right trend direction with perfect custom algorithms. It show the true direction and the best point to start trading. With StopLoss point and Three Take Profit points. Also it show the right pivot of the price and small points to order to replace the dynamic support and resistance channel, Which surrounds the price. And Finally it draws a very helpful Box on the left side on the chart includes (take profits and Stop loss
The trading statistics indicator notifies the trader of the aggregate income of the trading account for different time intervals. The indicator has wide display settings on the graph. There is a choice of one of the two display languages on the chart- English and Russian. Settings Indicator language (ENG, RUS) - Select the language to display on the chart; To control the magic (-1: any magic) - Entering the Magic for control (-1: any Magic); Angle of indicator tie - Selecting the angle of the c
トレンドトレーディング は、タイミングのプルバックとブレイクアウトにより、市場で起こっているトレンドから可能な限り利益を得るように設計された指標です。確立されたトレンドの中で価格が何をしているかを分析することにより、取引の機会を見つけます。 [ インストールガイド | 更新ガイド | トラブルシューティング | よくある質問 | すべての製品 ] 自信を持って効率的に金融市場を取引する むち打ちにならずに確立されたトレンドから利益を得る 収益性の高いプルバック、ブレイクアウト、早期の逆転を認識する この指標は、独自の品質とパフォーマンスを分析します 複数時間枠のダッシュボードを実装します インジケーターは再描画されていません 電子メール/音声/視覚アラートを実装します 確立されたトレンドは多くの取引機会を提供しますが、ほとんどのトレンド指標はそれらを完全に無視しています。インジケーターの解釈はかなり簡単です: (1) トレンドの変化 (2) トレンドの方向への後退 (3) トレンドの方向へのブレイクアウト 赤いダッシュ は下降トレンド中の修正です 青いダッシュ は上昇トレンド中
The indicator allows you to trade binary options. The recommended time frame is М1 and the expiration time is 1,2,3 minutes. The indicator suitable for auto and manual trading. A possible signal is specified as a arrows above/under a candle. You should wait until the candle closes! Arrows are not re-painted Trade sessions: TOKYO section (Half-end) Currency pairs: USD/JPY Working time frame: M1 Expiration time: 1,2,3 minutes. The indicator also shows good results when using the martingale strateg
FREE
これはほぼ間違いなく、MetaTraderプラットフォームで見つけることができる最も完全な調和価格形成自動認識インジケーターです。 19種類のパターンを検出し、フィボナッチプロジェクションをあなたと同じように真剣に受け止め、潜在的逆転ゾーン(PRZ)を表示し、適切なストップロスとテイクプロフィットレベルを見つけます。 [ インストールガイド | 更新ガイド | トラブルシューティング | よくある質問 | すべての製品 ] 19の異なる調和価格形成を検出します プライマリ、派生および補完フィボナッチ投影(PRZ)をプロットします 過去の価格行動を評価し、過去のすべてのパターンを表示します この指標は、独自の品質とパフォーマンスを分析します 適切なストップロスとテイクプロフィットのレベルを表示します ブレイクアウトを使用して適切な取引を通知します すべてのパターン比をグラフにプロットします 電子メール/音声/視覚アラートを実装します スコット・M・カーニーの本に着想を得て、この指標は最も純粋で急を要するトレーダーのニーズを満たすように設計されています。ただし、トレードを容易にする
"Supply / Demand Zones" The concepts of supply and demand zones   are undoubtedly two of the most highly discussed attributes of technical analysis. Part of analysing chart of pattern , these terms are used by traders   to refer to price levels i n charts that tend to act as barriers, preventing the price of an asset from getting pushed in a certain direction. At first, the explanation and idea behind identifying these levels seems easy, but as you'll find out, supply and demand zones can come
このプロダクトを購入した人は以下も購入しています
Gann Made Easy は、ミスター・ギャンの理論を使用した取引の最良の原則に基づいた、プロフェッショナルで使いやすい外国為替取引システムです。 W・D・ガン。このインジケーターは、ストップロスとテイクプロフィットレベルを含む正確な買いと売りのシグナルを提供します。 PUSH通知を利用して外出先でも取引可能です。 ご購入後、取引方法の説明と優れた追加インジケーターを無料で入手するには、私にご連絡ください! おそらく、ギャンの取引手法についてはすでに何度も聞いたことがあるでしょう。通常、ギャンの理論は初心者のトレーダーだけでなく、すでにある程度の取引経験がある人にとっても非常に複雑なものです。なぜなら、ギャンの取引手法は理論的にはそれほど簡単に適用できるものではないからです。私はその知識を磨き、最良の原則を私の外国為替インジケーターに組み込むために数年を費やしました。 このインジケーターは非常に簡単に適用できます。必要なのは、それをチャートに添付し、簡単な取引推奨事項に従うだけです。このインジケーターは常に市場分析の仕事を行い、取引の機会を探します。適切なエントリーポイントを検出す
M1 SNIPER は使いやすいトレーディングインジケーターシステムです。M1時間足向けに設計された矢印インジケーターです。M1時間足でのスキャルピングのためのスタンドアロンシステムとして、また既存のトレーディングシステムの一部としても使用できます。このトレーディングシステムはM1時間足での取引に特化して設計されていますが、他の時間足でも使用できます。元々、この手法はXAUUSDとBTCUSDの取引用に設計しましたが、他の市場においても役立つと考えています。 インジケーターのシグナルは、トレンドの方向と逆方向に取引できます。インジケーターのシグナルを利用して両方向に取引するのに役立つ特別な取引テクニックをご紹介します。この手法は、特別な動的なサポートとレジスタンスの価格帯を利用することに基づいています。 ご購入後、M1 SNIPER矢印インジケーターをすぐにダウンロードできます。さらに、M1 SNIPERツールのすべてのユーザーに、以下のスクリーンショットに表示されているApollo Dynamic SRインジケーターを無料で提供しています。この2つのインジケーターを組み合わせることで
Scalper Inside PRO – Since 2020. An exclusive indicator that utilizes an innovative algorithm to swiftly and accurately determine the market trend. The indicator automatically calculates opening, closing, and profit levels, providing detailed trading statistics. With these features, you can choose the most appropriate trading instrument for the current market conditions. Additionally, you can easily integrate your own arrow indicators into Scalper Inside Pro to quickly evaluate their statistics
PRO Renko Systemは、特別にRENKOチャートを取引するために設計された高精度の取引システムです。 これは、様々な取引商品に適用することができる普遍的なシステムです。 システムは効果的に正確な逆転信号へのアクセスを与えるいわゆる市場の騒音を中和する。 表示器は非常に使いやすく、信号の生成に責任がある1つの変数だけがあります。 あなたは簡単にお好みの任意の取引ツールとレンコバーのサイズにツールを適応させることができます。 私はいつもあなたが私のソフトウェアで収益性の高い取引を支援するために余分なサポートを提供する準備ができています! 私はあなたに幸せで収益性の高い取引をしたいです! ご購入後にご連絡ください! 私はあなたに私のレンコチャートジェネレータを送信します。 私はまた、私の個人的な推奨事項やシステムの他のモジュールを無料で共有します!
Auto Optimized Parabolic RSI: 高度な3Dモメンタムエンジン ほとんどのリテール向けインジケーターは、市場のボラティリティが変化した瞬間に破綻する静的な入力値に依存しているため、失敗に終わります。Auto Optimized Parabolic RSIは、自らの数学的優位性を継続的に再計算することで「インジケーターの陳腐化」問題を解決し、機関投資家レベルの定量的適応力をMT5ターミナルに直接もたらします。 最大の強み: カスタムインメモリ3D最適化   標準的な自動最適化ツールは、インジケーターの呼び出しで端末に過負荷をかけるため、頻繁にMT5プラットフォームをフリーズさせます。本ツールは、このボトルネックを完全に回避しています。RAMベースのカスタムネイティブ計算機を内蔵した内部エンジンは、チャートを読み込んだりタイムフレームを変更したりするたびに、超高速の3Dグリッド探索を実行します。RSI期間(頻度)、SARステップ(加速度)、SAR最大値(制限速度)を同時にスイープし、プラットフォームを遅延させることなく、数万通りものパラメーターの組み合わせを絶対的
ご紹介     Quantum Breakout PRO は 、ブレイクアウト ゾーンの取引方法を変革する画期的な MQL5 インジケーターです。 13年以上の取引経験を持つ経験豊富なトレーダーのチームによって開発された Quantum Breakout PROは 、革新的でダイナミックなブレイクアウトゾーン戦略により、あなたの取引の旅を新たな高みに押し上げるように設計されています。 クォンタム ブレイクアウト インジケーターは、5 つの利益ターゲット ゾーンを備えたブレイクアウト ゾーン上のシグナル矢印と、ブレイクアウト ボックスに基づいたストップロスの提案を提供します。 初心者トレーダーにもプロのトレーダーにも適しています。 量子EAチャネル:       ここをクリック MT5バージョン:   ここをクリック 重要!購入後、インストールマニュアルを受け取るためにプライベートメッセージを送ってください。 推奨事項: 時間枠: M15 通貨ペア: GBPJPY、EURJPY、USDJPY、NZDUSD、XAUUSD アカウントの種類: ECN、Raw、またはスプレッドが非
After purchase, contact me privately to receive 1 month of free testing with EA Forex Proton! This advanced MT4 trading robot automatically executes signals from any MT4 indicator, including Market Makers. The latest version also includes AI integration, allowing each trade signal to be analyzed using Artificial Intelligence. Live Signal with EA Forex Proton: Click here Market Makers is a powerful price action trading system designed to identify high-probability Buy and Sell opportunities based
Apex Edge No Repaint MT4対応、プロ仕様のリペイントしないトレーディングインジケーター Apex Edge No Repaintは、リペイントする矢印の煩わしさから解放され、明確なシグナルを求める真剣なFXおよび仮想通貨トレーダー向けに設計された、高品質でクリーンかつ信頼性の高いトレーディングツールです。 主な機能: 100% リペイントなし – チャートに表示されたシグナルは固定されたままです デュアルシグナルシステム:早期のチャンスを提供するRAWシグナルと、高確率で確定したエントリーを提供するCONFシグナル シンプルなワンクリック切り替えボタン:RAW ON/OFFとCONF ON/OFF トレンド、強度パーセンテージ、シグナルステータスを表示するプロフェッショナルなリアルタイムダッシュボード インスタントアラート:ポップアップ、サウンド、メール通知 すべてのCONFシグナルにTP1、TP2、ストップロスレベルを自動描画 視覚的に分かりやすい、色分けされた矢印: ライムグリーン → CONF買い 赤 → CONF売り ドジャーブルー → RAW買
このインジケーターを購入すると、プロ仕様のトレードマネージャーを無料で差し上げます。 まず第一に、このトレーディングシステムがノンリペイント、ノンリドロー、ノンラグのインジケーターであることを強調する価値がある。これにより、手動取引とロボット取引の両方に理想的なものになっています。 オンラインコース、マニュアル、プリセットのダウンロード。 「スマートトレンドトレーディングシステム MT5」は、新規および経験豊富なトレーダー向けにカスタマイズされた包括的なトレーディングソリューションです。10以上のプレミアムインジケーターを組み合わせ、7つ以上の堅実なトレーディング戦略を備えており、多様な市場状況に対応する多目的な選択肢となっています。 トレンドフォロー戦略:トレンドを効果的に乗り越えるための正確なエントリーとストップロス管理を提供します。 リバーサル戦略:潜在的なトレンドの反転を特定し、トレーダーがレンジ相場を活用できるようにします。 スキャルピング戦略:高速で正確なデイトレードおよび短期取引のために設計されています。 安定性:すべてのインジケーターはノンリペイント、ノンリドロー、ノ
このインジケーターは、エリオット波動理論と組み合わせて作動し、2つの方法で使用されます: 自動モード: このモードでは、インジケーターがチャート上の全ての5つのモーティブ波を自動的に検出し、予測とポテンシャルな逆転ゾーンを提供します。また、アラートやプッシュメッセージを生成する能力も備えています。この自動機能により、エリオット波動パターンの識別と分析のプロセスが効率化されます。 手動モード: このオプションは、エリオット波動理論を手動で扱いたいトレーダー向けです。9つの段階を使用して波を描画することができます。各段階は、表示された後に描画されたラインを調整して個別に定義できます。この機能により、手動で波を描画するプロセスがより効率的になります。重要な点として、すべての描画データが将来の参照のためにプラットフォームのデータフォルダに保存されることに注意してください。 パラメータ: Name: インジケーターの名前。 Use_System_Visuals: インジケーターのテーマを有効または無効にして、取引プラットフォーム全体の外観に合わせます。 Explain_Comment: 波の番号
Please send me Direct message on MQL5 CHAT after purchasing the Indicator for Training and Installation Support There are some additional files that is important to use with the Indicator . So be sure to contact me after purchasing the Indicator So that I can add you for training and support . If you find any difficulty with installation then send me Direct message here So that I can connect with you via Anydesk or Teamview for the product installation. " Smart Order Block Indicator " to find m
ゴールドラッシュ・トレンド・アロー・シグナル ゴールドラッシュ・トレンド・アロー・シグナル 指標は、XAU/USDにおける高速・短期スキャルパー向けに最適化された、正確でリアルタイムのトレンド分析を提供します。 1分足専用に設計されたこのツールは、明確なエントリーポイントを示す方向矢印を表示し、スキャルパーが変動の激しい市場状況でも自信を持って取引できるよう支援します。 この指標は、PRIMARY(主要)とSECONDARY(補助)のアラート矢印で構成されています。PRIMARYシグナルは、トレンドの方向転換を示す白と黒の方向矢印であり、SECONDARYシグナルは、PRIMARY矢印が示す方向を確認し、潜在的なエントリーポイントを示す青と赤の矢印です。 注意:トレンド方向の変化後にPRIMARYアラート矢印が1つだけ表示される場合、複数のSECONDARY青/赤矢印が表示される点に注意が必要です。SECONDARYシグナルは、シグナル基準を満たす任意のローソク足後に表示されます。したがって、長期的なトレンド移動の場合、画面に多くのSECONDARY矢印が表示されます(添付の
「 Dynamic Scalper System 」インジケーターは、トレンド波の中でスキャルピング取引を行う手法のために設計されています。 主要通貨ペアと金でテスト済みで、他の取引商品との互換性があります。 トレンドに沿った短期的なポジションオープンのシグナルを提供し、追加の価格変動サポートも提供します。 インジケーターの原理 大きな矢印はトレンドの方向を決定します。 トレンド波の中では、小さな矢印の形でスキャルピングシグナルを生成するアルゴリズムが機能します。 赤い矢印は強気方向、青い矢印は弱気方向です。 トレンドの方向には敏感な価格変動ラインが描かれ、小さな矢印のシグナルと連動します。 シグナルは次のように機能します。適切なタイミングでラインが現れるとエントリーシグナルが形成され、ラインが開いている間はポジションが保持され、完了すると取引が終了します。 推奨される動作時間枠はM1~H4です。 矢印は現在のローソク足に形成され、次のローソク足が開いている場合は、前のローソク足の矢印は再描画されません。 入力パラメータ Trend Wave Period - トレンド方向
GOLD Impulse with Alert
Bernhard Schweigert
4.67 (12)
このインディケータは、当社の2つの製品 Advanced Currency IMPULSE with ALERT  +   Currency Strength Exotics . のスーパーコンビネーションです。 このインジケーターは全ての時間枠で作動し、8つの主要通貨と1つのシンボルの強弱のインパルスをグラフで表示します。 このインジケータは、金、エキゾチックペア、商品、インデックス、先物など、あらゆるシンボルの通貨強度の加速度を表示することに特化されています。金、銀、原油、DAX、US30、MXN、TRY、CNHなどの通貨強度の加速度(インパルスまたは速度)を表示するために、任意のシンボルを9行目に追加できる、この種の最初のものです。 新しいアルゴリズムに基づいて構築され、潜在的な取引の特定と確認がさらに容易になりました。これは、通貨の強さや弱さが加速しているかどうかをグラフィカルに表示し、その加速の速度を測定するためです。加速すると物事は明らかに速く進みますが、これはFX市場でも同じです。つまり、反対方向に加速している通貨をペアリングすれば、潜在的に利益を生む取引を特定
Advanced Supply Demand
Bernhard Schweigert
4.91 (300)
現在40%オフ 初心者にもエキスパートトレーダーにも最適なソリューション このインジケーターは独自の機能と新しい公式を多数内蔵しており、ユニークで高品質かつ手頃な取引ツールです。このアップデートでは、2つの時間枠ゾーンを表示できるようになります。より長いTFだけでなく、チャートTFとより長いTF(ネストゾーンを表示)の両方を表示できます。すべてのSupply Demandトレーダーの皆さんのお気に召すはずです。:) 重要情報の公開 Advanced Supply Demandの可能性を最大化するには、 https://www.mql5.com/ja/blogs/post/720245 にアクセスしてください。   エントリーまたはターゲットの正確なトリガーポイントを正確に特定できれば取引がどのように改善されるか想像してみてください。新しい基盤となるアルゴリズムに基づいて構築されているため、買い手と売り手の間の潜在的な不均衡をさらに簡単に特定できます。これは、最も強い需要と供給のゾーンと、過去のパフォーマンス(古いゾーンを表示)がグラフィカルに表現されるためです。これらの機能は、最適な
Gold Scalper Super is an easy-to-use trading system. The indicator can be used as a standalone scalping system on the M1 time frame, as well as part of your existing trading system. Bonus: when purchasing an indicator, Trend Arrow Super is provided free of charge, write to us after purchase. The indicator 100% does not repaint!!! If a signal appears, it does not disappear! Unlike indicators with redrawing, which lead to the loss of a deposit, because they can show a signal and then remove it.
このインディケータは、異なる期間のフラクタルの価格構造を調べて、市場で起こり得る反転ポイントを決定し、すでに基本的または技術的な評価モデルを持っているポジショントレーダーにタイミングを提供します。弟の リバーサルフラクタル とは異なり、このインジケーターは選択された期間のためにリバーサルを逃すことはなく、ジグザグ形式でリバーサルフラクタルを見つけます。 [ インストールガイド | 更新ガイド | トラブルシューティング | よくある質問 | すべての製品 ] ターニングポイントは長いトレンドを開始できます インジケーターは再描画されていません あらゆる種類のアラートを実装します カスタマイズ可能な色とサイズ フラクタルは奇数番目のバーのフォーメーションであり、フォーメーションの最上位または最下位の中間バーであり、フラクタル内のすべてのバーが閉じるとインディケーターが描画されるため、このインジケーターはリアクティブまたは遅れ信号です。ただし、既存の方向バイアスを持つトレーダーは、この指標が非常に有用であり、早期のエントリポイントを取得します。 このインディケーターは、ボイルダウンされた
サポート線と抵抗線のプロットにうんざりしていませんか? サポートレジスタンス は、非常に興味深いひねりを加えてチャート内のサポートとレジスタンスラインを自動検出およびプロットするマルチタイムフレームインジケーターです。価格レベルは時間とともにテストされ、その重要性が高まるにつれて、ラインは太くなり、暗くなります。 [ インストールガイド | 更新ガイド | トラブルシューティング | よくある質問 | すべての製品 ] 一晩でテクニカル分析を強化 チャートを閲覧せずに重要な価格レベルを検出 一目ですべての価格レベルの相対的な強さを認識する すべての取引で最大30時間のプロットラインを節約 インジケーターは、すべての価格レベルの年齢を表示します インジケーターは再描画されていません 過去および現在の価格レベルは近接によって崩壊し、現在の市場行動に合わせて調整されます。動作は、必ずしもピークではない場所に線が引かれます。 価格レベルは、時間とともに拒否されるにつれて、より暗く、より広くなります ノイズを避けるために、重要でない価格レベルは定期的にクリアされます カスタマイズ可能な時間枠の
They say history repeats itself. What if you could prove it in real-time? The Propfolio Ghost Pattern is an advanced algorithmic pattern-matching engine. It empowers you to select any current price action structure on your chart and instantly scan thousands of historical candles to find the exact moment in the past where the market did the exact same thing. Once it finds the highest probability match, it projects the historical outcome into the future as "Ghost Candles"—giving you a highly calcu
現在26%OFF! このインディケータは、当社のメインインディケータ( Advanced Currency Strength 28   &  Advanced Currency IMPULSE with ALERT )の両方のスーパーコンビネーションです。28の外国為替ペアのTICK-UNITSとアラートシグナルの通貨強度の値を示しています。11種類のTick-Unitが使用可能です。1、2、3、4、5、6、10、12、15、20、30秒の11種類です。サブウィンドウのTick-Unitバーは、秒単位のタイマーに1ティック以上含まれる場合に表示され、左側にシフトされます。 たった1枚のチャートで、28のFXペアをスキャルピングできます。スキャルピングのチャンスとなるトリガーポイントを正確に把握することで、スキャルピングが上達することを想像してみてください。 1分足よりも短い期間で動作する市場初の通貨強度インジケーターです! このインジケータは、素早いインとアウトを行い、小さなピップを切り取ることを望む高速スキャルパーのためのものです。 ユーザーマニュアル: ここをクリック h
まず第一に、この取引インジケーターは再描画されず、再描画されず、遅延しないことを強調する価値があります。これにより、手動取引とロボット取引の両方に理想的なものになります。 ユーザーマニュアル:設定、入力、戦略。 アトミックアナリストは、価格の強さとモメンタムを利用して市場でより良いエッジを見つけるためのPA価格アクションインジケーターです。ノイズや誤ったシグナルを除去し、取引ポテンシャルを高めるための高度なフィルターを備えています。複雑なインジケーターの複数のレイヤーを使用して、アトミックアナリストはチャートをスキャンし、複雑な数学的計算をシンプルなシグナルと色に変換します。これにより、どのような初心者トレーダーでも理解して使用し、一貫した取引の決定を行うことができます。 「アトミックアナリスト」は、新規および経験豊富なトレーダー向けにカスタマイズされた包括的な取引ソリューションです。プレミアムインジケーターとトップノッチの機能を1つの取引戦略に組み合わせ、すべてのタイプのトレーダーにとって汎用性のある選択肢にします。 デイリートレーディングとスキャルピング戦略:高速で正確な
購入後、このインジケーターに基づいたボーナスEAを受け取るためにご連絡ください。 Self Optimizing Double MA Strategyは、パラメータ推測の必要性を排除するために設計されたプロフェッショナルグレードの取引ツールです。組み込みの自動最適化エンジンを搭載し、バックグラウンドで何千ものパラメータの組み合わせをシミュレートすることで、変化する市場状況に継続的に適応し、統計的な優位性を維持します。 静的で時代遅れの設定に依存するのではなく、インジケーターは自身のロジックを動的に更新し、現在の時間枠と取引商品にとって最も収益性の高い構成を見つけ出します。 主な機能 組み込みの自動最適化: 選択した更新頻度に基づいて、システムはFast MA、Slow MA、およびRSIの期間を定期的に再計算し、設定が常に現在の市場のリズムと一致するようにします。 MAダイバージェンスフィルター: 移動平均線が明確に乖離している(広がっている)場合にのみシグナルを検証する、トレンド強度のコア指標です。これにより、移動平均線が収束している相場や平坦なレンジ相場での誤ったエントリーを防ぎ
現在40%オフ 初心者やエキスパートトレーダーに最適なソリューション! このインジケーターは、独自の機能と新しい計算式を取り入れた、ユニークで高品質、かつ手頃な価格のトレーディングツールです。たった1枚のチャートで28の為替ペアの通貨強度を読み取ることができます。新しいトレンドやスキャルピングチャンスの引き金となるポイントを正確に特定することができるので、あなたのトレードがどのように改善されるか想像してみてください。 ユーザーマニュアルはこちら  https://www.mql5.com/en/blogs/post/697384 これが最初の1本、オリジナルだ! 価値のないクローンを買わないでください。 特別な サブウィンドウの矢印で強い通貨の勢いを表示 GAPがあなたのトレードを導く! 基準通貨や気配値が売られすぎ・買われすぎのゾーン(外相フィボナッチレベル)にあるとき、個別チャートのメインウィンドウに警告表示。 通貨がレンジの外側から反落した場合、プルバック/リバーサルのアラート。 クロスパターンの特別なアラート 複数の時間枠を選択可能で、トレンドを素早く確認できます
チャートを構成し、周期的な価格変動を識別するテクニカル指標。 どのチャートでも動作します。 いくつかの種類の通知。 グラフ自体に追加の矢印があります。 履歴を再描画せずに、キャンドルのクローズに取り組みます。 M5以上のTFを推奨します。 パラメータの使用と設定が簡単です。 異なるパラメータを持つ 2 つのインジケーターを使用する場合、他のインジケーターなしで使用できます。 入力パラメータは2つあります 周期性と信号持続時間 これら 2 つのパラメータは、チャート構造の処理を扱います。 Cyclicity - 反転サイクルが変化する頻度を調整し、サイクルを滑らかにします。 Signal duration - 最小数では価格変動の衝動を検出し、最大数では長期的なトレンドの動きを検出します。
The indicator is built on a non-standard Zig Zag, it draws accumulations after which if the price leaves this zone and a test of this zone occurs, then a sound signal is given and an arrow appears - after the test candle closes.The indicator does not redraw its signals, it is very easy to use, there are only three settings 1- this is the zig zag parameter 2- this is the minimum price exit from the zone 3- this is the maximum price exit from the zone. The lower the parameter for Zig Zag, the more
デイトレーダーマスターは、デイトレーダーのための完全なトレーディングシステムです。システムは2つのインジケーターで構成されています。 1つの指標は売買する矢印信号です。それはあなたが得る矢印インジケーターです。 2つ目のインジケーターを無料で提供します。 2番目のインジケーターは、これらの矢印と組み合わせて使用​​するために特別に設計されたトレンドインジケーターです。 インジケーターは繰り返さず、遅れないでください! このシステムの使用は非常に簡単です。 2色の線で表示されている現在のトレンドの方向に矢印信号をたどる必要があります。青は買いの傾向です。赤い色は売りの傾向です。青い矢印は買いシグナルです。赤い矢印は売りの合図です。トレンドラインの色と一致するように、矢印の色と信号の方向が必要です。 矢印インジケーターは、主に時間間隔M5とM15での日中取引のために作成されました。ただし、技術的には、システムは他の時間間隔で使用できます。 インジケータには、PUSHメッセージ機能を備えたポップアップアラートが装備されています。 購入後、必ず私に書いてください!私はあなたにシステムとの取引の
Trend Screener
STE S.S.COMPANY
4.79 (95)
トレンドインジケーター、1つのツールに組み込まれたすべての重要なトレンド機能を備えたトレンドトレーディングとフィルタリングのための画期的なユニークなソリューション! これは、すべてのシンボル/商品(外国為替、商品、暗号通貨、インデックス、株式)で使用できる100%再描画されていないマルチタイムフレームおよびマルチ通貨インジケーターです。 期間限定オファー: サポートおよびレジスタンス スクリーナー インジケーターは、たった 65 ドルで永久的にご利用いただけます。(元の価格 250 ドル) (オファー延長) トレンドスクリーナーは、チャート内のドットで矢印トレンドシグナルを提供するインジケーターに続く効率的なインジケーターです。 トレンド分析インジケーターで使用できる機能: 1.トレンドスキャナー。 2.最大利益分析を備えたトレンドライン。 3.トレンド通貨強度メーター。 4.アラート付きのトレンド反転ドット。 5.アラート付きの強いトレンドドット。 6.トレンド矢印 毎日の分析例、毎日のシグナルパフォーマンス...など、トレンドスクリーナーインジケーターを使用して、ここで見つけること
Delta Fusion Pro – 日中取引のための高度なオーダーフロー分析 Delta Fusion Pro は MetaTrader 4 用のプロフェッショナル指標で、アグレッシブな注文フローを明らかにし、機関投資家の圧力の強度と方向をリアルタイムで表示します。従来のボリューム指標とは異なり、Ask と Bid のボリューム差(デルタ)を分析し、反転の予測、トレンドの確認、プロフェッショナルな関心ゾーンの特定を可能にします。 主な特徴 インテリジェント自動調整システム 以下に基づき、すべてのパラメータを自動調整: 銘柄タイプ(FX、暗号資産、指数、コモディティ、株式) 運用タイムフレーム 市場のボラティリティ(ATR) 最近の平均ボリューム 初心者トレーダー向けに手動設定不要 — インジケーターが自動でキャリブレーション! 機能概要 NetDelta と累積デルタ Ask/Bid のアグレッシブボリューム差を計算、カスタマイズ可能な EMA スムージング リアルタイムで方向性圧力を表示 ヒストグラムの色をカスタマイズ(買い/売り) 価格/ボリュームのダイバージェンス 通常お
現在40%オフ! 初心者やエキスパートトレーダーに最適なソリューション! このインジケータは、独自の機能と秘密の数式を組み込んだ、ユニークで高品質かつ手頃な価格のトレーディングツールです。たった1枚のチャートで28の通貨ペアのアラートを表示します。新しいトレンドやスキャルピングチャンスの引き金となるポイントを正確に把握することができるので、あなたのトレードがどのように改善されるか想像してみてください! 新しい基本的なアルゴリズムに基づいて構築されているため、潜在的な取引の特定と確認がより簡単になります。これは、通貨の強さや弱さが加速しているかどうかをグラフィカルに表示し、その加速のスピードを測定するためです。加速すると物事は明らかに速く進みますが、これはFX市場でも同じです。つまり、反対方向に加速している通貨をペアにすれば、利益を生む可能性のある取引を特定することができるのです。 通貨の勢いを示す縦の線と矢印は、あなたの取引の指針となるでしょう。 ダイナミックマーケットフィボナッチ23レベルはアラートトリガーとして使用され、市場の動きに適応します。もしインパルスが黄色のトリガ
Apollo SR Master は、サポート/レジスタンスゾーンを利用した取引をより容易かつ確実にする特別な機能を備えたサポート/レジスタンスインジケーターです。このインジケーターは、ローカル価格の高値と安値を検出することで、タイムラグなしでリアルタイムにサポート/レジスタンスゾーンを計算します。そして、新たに形成されたSRゾーンを確認するために、インジケーターは特別なシグナルを表示します。このシグナルは、SRゾーンを実際の売りまたは買いシグナルとして考慮して使用できることを示します。この場合、SRゾーンの強度が高まり、SRエリアからの取引が成功する確率も高まります。これがこのインジケーターの基本的な考え方です。 SRゾーンは、ストップロスとテイクプロフィットの設定を容易にします。シグナルの方向に応じて、SRゾーンの上または下のスペースをストップロスとして設定できます。さらに、反対側のSRゾーンは、潜在的なテイクプロフィットエリアとして設定できます。 また、Apollo SRマスターインジケーターをご利用のすべてのユーザーには、「Apollo Price Action System」
作者のその他のプロダクト
Advanced Market Footprint Profiles is a specialized market analysis tool, representing a customized volume distribution profile enhanced with Delta and Bid/Ask profiles. The indicator builds fixed horizontal profiles (Fixed Range), displaying the distribution of Volume, Delta, and Bid/Ask at each price level with high precision. Unlike standard horizontal volume profiles, which only show overall volume distribution, this indicator combines Volume, Delta, and Bid/Ask within the selected range a
Cumulative Delta Pro is a professional indicator that takes market order flow analysis to a fundamentally new level. Cumulative Delta is the difference between buying and selling volumes, presented as a continuous cumulative sum over a specific period of time starting from the initial calculation point. This metric allows traders to see in real time who controls the market: if the positive delta increases, it indicates the dominance of active buyers; if the negative delta decreases, sellers are
Gold Scalper System  is a multifunctional trading system that combines a breakout strategy for key liquidity levels with confirmation and a built-in Smart DOM Pro module for market depth analysis. The system identifies zones of limit order accumulation, tracks activity at support and resistance levels, and generates signals at the moment of their breakout. Smart DOM Pro visualizes Bid/Ask volumes, identifies liquidity clusters, and helps determine the intentions of major market participants. G
Gold Prop Firm   is a professional indicator specifically designed for trading gold (XAUUSD). It automatically identifies price consolidation ranges—key liquidity accumulation zones where potential breakouts are most likely to occur. The algorithm creates a   Breakout Box   around these areas, analyzes volume distribution, and determines   trigger strength . When the boundaries of the range are breached, the indicator generates clear trading signals in the form of arrows. Gold Prop Firm   is su
Adaptive Volatility Range [AVR] is a powerful tool for identifying key trend reversal points. AVR accurately reflects the Average True Range (ATR) of volatility, taking into account the Volume-Weighted Average Price (VWAP). The indicator adapts to any market volatility by calculating the average volatility over a specific period, ensuring a stable rate of profitable trades. You receive not just an indicator but a professional automated trading system , AVR-EA . Advantages: 100% No Repaint –
Reversal Zones Pro is an indicator specifically designed to accurately identify key trend reversal zones. It calculates the average true range of price movement from the lower to upper boundaries and visually displays potential zones directly on the chart, helping traders effectively identify important trend reversal points. Key Features: Reversal Zone Identification: The indicator visually displays potential reversal zones directly on the chart. This helps traders effectively identify importan
Adaptive Volatility Range (AVR) is a powerful tool for identifying key trend reversals. AVR accurately reflects the Average True Range (ATR) of volatility, taking into account the Volume-Weighted Average Price (VWAP). The indicator adapts to any market volatility by calculating the average volatility over a specified period. This ensures a stable performance with a positive trade outcome. Advantages of the AVR Indicator: 100% No Repaint –  All lines and signal arrows are formed in real time
Sniper Delta Imbalance   is a professional tool for deep delta analysis — the difference between buyer and seller volumes. It takes volume analysis to the next level, allowing traders to see in real time who controls the price — buyers or sellers — and to find precise entry points based on the actions of major market participants. This tool represents a unique style of analysis based on the ratio of demand and supply volumes and can be used to detect who holds control over price. At the core of
Sniper Delta Imbalance is a professional tool for deep delta analysis — the difference between buyer and seller volumes. It takes volume analysis to the next level, allowing traders to see in real time who controls the price — buyers or sellers — and to find precise entry points based on the actions of major market participants. This tool represents a unique style of analysis based on the ratio of demand and supply volumes and can be used to detect who holds control over price. At the core o
Reversal Pattern AI — an absolute breakthrough in the world of indicator development, combining artificial intelligence algorithms, multi-level market analysis, and classical methods of technical analysis. It not only detects reversal patterns but also evaluates market inefficiencies, generating highly accurate trading signals. Thanks to a hybrid model that uses price action analysis, Volumes, Volatility, VWAP, and Volume AVG %, the indicator easily adapts to any market conditions.              
Cumulative Delta Pro   is a professional indicator that takes market order flow analysis to a fundamentally new level. Cumulative Delta   is the difference between buying and selling volumes, presented as a continuous cumulative sum over a specific period of time starting from the initial calculation point. This metric allows traders to see in real time who controls the market: if the positive delta increases, it indicates the dominance of active buyers; if the negative delta decreases, sellers
Quantum Profile System is a fully-fledged professional trading system with advanced algorithms, combining everything needed for confident and stable trading. This indicator merges trend direction analysis, volume concentration at key levels, dynamic adaptation to market volatility, and generation of trading signals with no delay or repainting. Quantum Profile System integrates a Linear Regression Volume Profile with an adaptive ATR-based trend channel. It includes an extended Volume Profile modu
Please contact me after your full purchase for great bonuses.                                     Adaptive Reversal Star Expert Advisor and an additional indicator as a gift Info Panel are waiting for you. Adaptive Reversal Star is a new generation indicator with an advanced Adaptive algorithm , which additionally tracks potential reversal points and compares the values of the current market volatility when forming the main signals
Reversal Pattern AI is a groundbreaking advancement in indicator development, combining artificial intelligence algorithms, multi-level market analysis, and classical technical analysis methods. It not only detects reversal patterns but also evaluates market inefficiencies, generating highly accurate trading signals.Thanks to its hybrid model, which utilizes price action analysis, volume, volatility, VWAP, and Volume AVG %, the indicator easily adapts to any market conditions. Reversal Pattern A
Ultimate Volatility Insight is a highly professional tool for analyzing and fully understanding market activity based on an advanced ATR with improved algorithms and calculation formulas. The indicator helps traders accurately assess market dynamics, identify key support and resistance levels, and effectively manage risks. Ultimate Volatility Insight works only with real data using live statistics. The indicator has been developed for over two years, and its effectiveness has been proven through
Reversal Zones Pro – an indicator specifically designed for accurately identifying key trend reversal zones. It calculates the average true range of price movement from lower to upper boundaries and visually displays potential reversal zones directly on the chart, helping traders efficiently pinpoint crucial turning points in the market. Key Features: Reversal Zone Identification: The indicator visually highlights potential reversal zones directly on the chart, enabling traders to effectively id
Patriot EA is an advanced mesh system with improved performance. Patriot EA uses sophisticated technology to effectively manage unprofitable positions. When a losing series of orders occurs, an algorithm for closing unprofitable positions is activated. The Expert Advisor divides orders into several independent grids, closing the long-range (unprofitable) order by sequentially averaging part of the orders with a given Take Profit. A series of orders can be divided into several mixed series with
Volume PRO is an innovative and modernized indicator for analyzing trading volumes, which is an advanced version of traditional analysis tools. This high-tech indicator allows traders to effectively monitor trading activity without the need for complex calculations. It displays ticks for the selected time interval corresponding to the selected time frame in the form of a dynamic cumulative histogram, which is updated in real time as new trades are received. Key features: Innovative volume analys
The Block Master Pro indicator is designed to visually identify areas on the chart where significant volumes from major market participants are likely concentrated. These areas, known as order blocks, represent price ranges where large players place their orders, potentially signaling a price reversal and movement in the opposite direction. Key Features: Order Block Identification: Block Master Pro effectively identifies order blocks by pinpointing price ranges where large orders are placed. Th
Advanced Reversal Hunter Pro (ARH) is a powerful, innovative volatility-based momentum indicator designed to accurately identify key trend reversals. Developed using a special algorithm that provides a clear construction of the average volatility range, without redrawing its values ​​and does not change them. The indicator adapts to any market volatility and dynamically adjusts the width of the band range, depending on current market conditions. Indicator advantages: Advanced Reversal Hunter Pro
The Bull and Bear Zones indicator is specifically designed for the automatic identification and visual display of support and resistance zones directly on the chart. Its unique algorithm allows it to display not only the zones already tested by the market but also potential target zones that have yet to be tested. The indicator tracks ranges where an imbalance between supply and demand is observed. Key Features: Automatic identification of support and resistance zones : The indicator calculates
Golden Trend Pulse — trend indicator developed specifically for Gold, also applicable to the Cryptocurrency and Stock markets. The indicator is designed for precise determination of market trends using advanced analytical methods. The tool combines multifactor analysis of price dynamics and adaptive filtering of market noise, ensuring high accuracy in identifying key entry and exit points. Thanks to its intelligent system, the indicator effectively handles market variability, minimizing false s
Adaptive Reversal Star   is a new generation indicator with an   advanced Adaptive algorithm , which additionally tracks potential reversal points and compares the values of the current market volatility when forming the main signals of the indicator.It provides accurate signals in real time without delays and redraws.Adaptive Reversal Star does not require any complex settings and additional calculations, just set it to the desired timeframe and select the parameter - Signal Filter. Why choose
Golden Trend Pulse   — trend indicator developed specifically for Gold, also applicable to the Cryptocurrency and Stock markets. The indicator is designed for precise determination of market trends using advanced analytical methods. The tool combines multifactor analysis of price dynamics and adaptive filtering of market noise, ensuring high accuracy in identifying key entry and exit points. Thanks to its intelligent system, the indicator effectively handles market variability, minimizing false
フィルタ:
レビューなし
レビューに返信