
オブジェクトを使用して複雑な指標を簡単に

1.はじめに
複雑な指標を作成または変更しようとしたことがある方は、バッファの量を増やすときに発生する問題をいくつかご存じかもしれません。バッファに対して大量のdouble配列を宣言し、それらをバッファとして設定し、それらすべてを構成する必要があります。...
次に、プロットが来ます。使用しているプロットのタイプを宣言し、そのすべてのプロパティを構成し、すべてが正しく適合し、正しい量のバッファとプロットを宣言したことを確認する必要があります(少ない場合は、気付くまで、ArrayOutOfRangeエラーまたはプロットが非表示になります)。
最後に来るのは、バッファのデータの処理です。大量のバッファからのデータを結合する場合(たとえば、10個のバッファの平均/最大/最小を別のバッファに取得する場合)、非常に長い、各バッファを1つずつ比較/結合するコードの繰り返しを記述する必要があります。マクロや関数を使用した巧妙なトリックに依存してスペースを節約しようとしても、結果はおそらく同じです。多数の行と繰り返される機能を持ち合わせた、バグが発生しやすい非常に複雑な混乱状態です。どこかでタイプミスを1つ犯したならば、それを検出して修正するのは悪夢です。
このような状況は、機能的または視覚的に複雑な指標を作成するときに、初心者(そして経験豊かなプログラマーでさえも)を躊躇させることがあります。ただし、指標のコーディングをより速く簡単にすることができる、誰にも明らかではない小さなトリックがあります。
オブジェクト内に含まれるバッファ配列として設定することです。
この記事では、このトリックが提供するオプションを探り、オブジェクト指向プログラミングを使用して他の状況でこのトリックを適用できるようにする解決策を提供します。
2.最初の例
指標の作成を開始する前に、バッファ配列を含むオブジェクトの最も基本的な形式がどのようなものかを見てみましょう。
class CIndicatorPlot
{
public:
   double            array[];
};
あるのはpublic配列1つだけです。今のところ、それをpublicにすることが重要です。これにより、バッファとして設定したり、(他の指標と同様に)データを設定/アクセスしたりするときに使用できるようになります。
指標を見てみましょう。概念のいくつかを適用するために、異なる期間とその平均で10のRSIを表示する指標を作成します。プロパティ、入力、およびOnInit関数から始めます。
#property indicator_buffers 11
#property indicator_plots 11

input int firstPeriod = 6;
input int increment = 2;

CIndicatorPlot indicators[];
int handles[];
//+------------------------------------------------------------------+
//| Custom indicator initialization function                         |
//+------------------------------------------------------------------+
int OnInit()
{

   ArrayResize(indicators, 11);
//--- indicator buffers mapping

   for (int i=0; i<11; i++)
   {
      SetIndexBuffer(i, indicators[i].array, INDICATOR_DATA);
      PlotIndexSetInteger(i, PLOT_DRAW_TYPE, DRAW_LINE);
   }

   for (int i=0; i<10; i++)
      PlotIndexSetInteger(i, PLOT_LINE_COLOR, clrRed);


   PlotIndexSetInteger(10, PLOT_LINE_COLOR, clrCyan);
   PlotIndexSetInteger(10, PLOT_LINE_STYLE, STYLE_DASH);
   PlotIndexSetInteger(10, PLOT_LINE_WIDTH, 2);

   ArrayResize(handles, 10);
   for (int i=0; i<10; i++)
      handles[i] = iRSI(NULL, PERIOD_CURRENT, firstPeriod+i*increment, PRICE_CLOSE);


//---
   return(INIT_SUCCEEDED);
}
indicator_buffersとindicator_plotsの2つのプロパティしか使用していないことに注意してください。一般的なもの(著作権、リンク、バージョン、別ウィンドウ/チャートウィンドウなど)とは別に、これら2つは常に必要になります。他のプロパティ(線の色、描画タイプなど)はオプションですが、コードをよりコンパクトにするために、ループでPlotIndexSetIntegerを使用して構成します。
この指標では、異なる期間のRSIごとに10個のバッファと、それらの平均用にもう1個のバッファが必要です。それらすべてを配列の中に入れます。また、OnInitで指標ハンドルを作成します。
次に、いくつかの計算をしてデータをコピーします。
//+------------------------------------------------------------------+
//| Custom indicator iteration function                              |
//+------------------------------------------------------------------+
int OnCalculate(const int rates_total,
                const int prev_calculated,
                const datetime &time[],
                const double &open[],
                const double &high[],
                const double &low[],
                const double &close[],
                const long &tick_volume[],
                const long &volume[],
                const int &spread[])
{
//---
   int limit = MathMax(0, prev_calculated-1);

   for (int i=0; i<10; i++)
   {
      if (limit==0)
         CopyBuffer(handles[i], 0, 0, rates_total-limit, indicators[i].array);
      else
      {
         double newValues[];
         CopyBuffer(handles[i], 0, 0, rates_total-limit, newValues);

         for (int k=0; k<rates_total-limit; k++)
         {
            indicators[i].array[limit+k] = newValues[k];
         }
      }
   }

   for (int i=limit; i<rates_total; i++)
   {
      indicators[10].array[i] = 0.0;
      for (int j=0; j<10; j++)
         indicators[10].array[i] +=indicators[j].array[i];

      indicators[10].array[i]/=10.0;
   }


//--- return value of prev_calculated for next call
   return(rates_total);
}
すべてのバッファから平均を計算することは、ループを実行するのと同じくらい簡単です。すべてのバッファがグローバルスコープで(通常のように)double配列として宣言されている場合、それらを加算することは簡単ではなく、数行でおこなうこともできません。
最後に、忘れずにハンドルを解放します。
//+------------------------------------------------------------------+
//| Custom indicator deinitialization function                       |
//+------------------------------------------------------------------+
void OnDeinit(const int reason)
{
   for (int i=0; i<10; i++)
      IndicatorRelease(handles[i]);
}
//+------------------------------------------------------------------+
次が最終結果です。
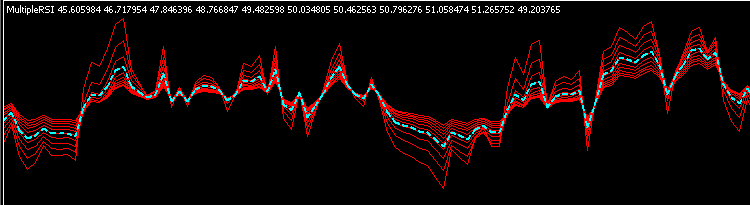
コードの長さはそれほど悪くありませんが、次のセクションで説明するように、改善の余地があります。
3.オプションの追加
このクラスを使用してスペースを節約し、(#propertyの代わりに)初期化時にプロパティを構成しましたが、バッファとプロットを手動で構成する必要があり、毎回簡単になるわけではありませんでした。これをおこなうより効果的な方法はないのでしょうか。答えは「ある」です。クラスに機能を委譲することでそれを実現します。
まず、後で必要になるいくつかの関数をクラスに追加します。
class CIndicatorPlot
{
private:
   int               indicator_plot;

public:
   double            array[];

   void              SetBuffer(int &buffer, int &plot);
   void              SetLineWidth(int width);
   void              SetLineStyle(ENUM_LINE_STYLE style);
   void              SetLineColor(color line_color);
   void              SetLabel(string label);
};
SetBuffer関数は指標バッファとプロットを設定します。参照によって渡される2つの変数を使用すると、1つのオブジェクトが変数に対しておこなう変更は、他のオブジェクトによる次の呼び出しに反映されます。プロットインデックスは、他のプロパティを設定するために保存されます。
set関数の残りの部分は、単純なプロットプロパティセッターです。
//+------------------------------------------------------------------+
void CIndicatorPlot::SetBuffer(int &buffer,int &plot)
{
   indicator_plot = plot;

   SetIndexBuffer(buffer, array, INDICATOR_DATA);
   PlotIndexSetInteger(indicator_plot, PLOT_DRAW_TYPE, DRAW_LINE);

   buffer++; //Increment for other steps (One buffer in this case)
   plot++;   //Increment one plot in any case
}

//+------------------------------------------------------------------+
void CIndicatorPlot::SetLineWidth(int width)
{
   PlotIndexSetInteger(indicator_plot, PLOT_LINE_WIDTH, width);
}

//---
//...
指標に視覚的な関心を追加するために、後で使用する色を補間する関数も作成します。
//+------------------------------------------------------------------+
//| Function to linearly interpolate 2 colors                        |
//+------------------------------------------------------------------+
color InterpolateColors(color colorA, color colorB, double factor)
{
   if (factor<=0.0) return colorA;
   if (factor>=1.0) return colorB;

   int result = 0;

   for (int i=0; i<3; i++) //R-G-B
   {
      int subcolor = int(
                        ((colorA>>(8*i))&(0xFF))*(1.0-factor) +
                        ((colorB>>(8*i))&(0xFF))*factor
                     );

      subcolor = subcolor>0xFF?0xFF:(
                    subcolor<0x00?0x00:
                    subcolor);

      result |= subcolor<<(8*i);
   }
   return (color)result;
}
OnInit関数は次のようになります。
CIndicatorPlot* indicators[];
CIndicatorPlot average;
int handles[];
//+------------------------------------------------------------------+
//| Custom indicator initialization function                         |
//+------------------------------------------------------------------+
int OnInit()
{
//--- indicator buffers mapping
   ArrayResize(indicators, 10);
   ArrayResize(handles, 10);


   int index=0, plot=0;

   for (int i=0; i<10; i++)
   {
        indicators[i] = new CIndicatorPlot();

      indicators[i].SetBuffer(index, plot);
      indicators[i].SetLineColor(InterpolateColors(clrYellow, clrRed, i/9.0));
      indicators[i].SetLabel("RSI ("+IntegerToString(firstPeriod+i*increment)+")");

      handles[i] = iRSI(NULL, PERIOD_CURRENT, firstPeriod+i*increment, PRICE_CLOSE);
   }

   average.SetBuffer(index, plot);
   average.SetLineColor(clrBlue);
   average.SetLineStyle(STYLE_DASH);
   average.SetLineWidth(2);
   average.SetLabel("Average");

//---
   return(INIT_SUCCEEDED);
}
バッファやプロットを番号で参照していないことに注意してください。クラスがその問題を処理しました。インデックスの代わりにオブジェクトを使用してバッファを参照できるようになったため、プロットプロパティを正しく設定したり、バッファの順序を変更したりすることが簡単になりました。また、プロットにいくつかの色とラベルを追加する機会もありました。
この例では、RSIのポインタの配列を使用して指標構造も変更し(動的に作成されたオブジェクトを使用することも可能であることを証明するため)、配列から平均を分離しました。そのため、OnCalculateの平均参照を変更し、OnDeInitのポインタ配列の指標を削除する必要があります。
void OnDeinit(const int reason)
{
   for (int i=0; i<10; i++)
      IndicatorRelease(handles[i]);
   for (int i=0; i<10; i++)
        delete indicators[i];
}
これで次のようになります。
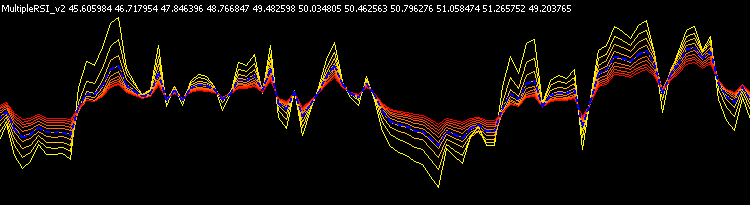
視覚的な変化は、色(およびデータウィンドウのラベル)だけです。内部的には、プロットとバッファをより簡単に処理できるようにすることでワークフローを改善しましたが、内部の構成を改善する余地はまだあります。
よく見ると、各ハンドルがバッファの1つだけで使用されていることがわかります。各RSIバッファは個別に計算できるため、(OnCalculateで直接計算するのではなく)内部でクラスに実行させることができます。平均は残りのバッファにアクセスする必要がありますが、それらの計算もクラスに委任できます。関数を変更したり、基本クラスに条件を追加したりすることなく、継承を使用して特定の機能を追加できます。
まず、空の仮想イベントハンドラを基本クラスに追加します。
class CIndicatorPlot
{
   //...

public:

   //...

   virtual void      Init() { }
   virtual void      DeInit() { }
   virtual void      Update(const int start, const int rates_total) { }
};
この例で前に見たように、Updateは計算を実行するためにstartとrates_totalのみを必要とするため、残りの値は省略されます。
次に、個別のRSIクラスを作成します。必要なハンドルを作成および削除できます。また、そのハンドルの期間を設定する関数を含めましたが、そのパラメータをInit()に含めることも可能です。
class CRSIIndividual : public CIndicatorPlot
{
private:
   int               handle;
   int               rsi_period;

public:

   void              SetPeriodRSI(int period);

   virtual void      Init();
   virtual void      DeInit();
   virtual void      Update(const int start, const int rates_total);
};

//+------------------------------------------------------------------+
void CRSIIndividual::SetPeriodRSI(int period)
{
   rsi_period = period;
}

//+------------------------------------------------------------------+
void CRSIIndividual::Init(void)
{
   handle = iRSI(NULL, PERIOD_CURRENT, rsi_period, PRICE_CLOSE);
}

//+------------------------------------------------------------------+
void CRSIIndividual::Update(const int start,const int rates_total)
{
   if (start==0)
      CopyBuffer(handle, 0, 0, rates_total-start, array);
   else
   {
      double newValues[];
      CopyBuffer(handle, 0, 0, rates_total-start, newValues);

      for (int k=0; k<rates_total-start; k++)
      {
         array[start+k] = newValues[k];
      }
   }
}

//+------------------------------------------------------------------+
void CRSIIndividual::DeInit(void)
{
   IndicatorRelease(handle);
}
Averageクラスでは、残りの指標プロットオブジェクト(個々のRSI)にアクセスするためのポインタを格納する必要があります。この場合、Init()とDeInit()は必要ありません。
class CRSIAverage : public CIndicatorPlot
{
private:
   CRSIIndividual*   rsi_indicators[];

public:
   void              SetRSIPointers(const CRSIIndividual &rsi_objects[]);

   virtual void      Update(const int start, const int rates_total);
};

//+------------------------------------------------------------------+
void CRSIAverage::SetRSIPointers(const CRSIIndividual &rsi_objects[])
{
   int total = ArraySize(rsi_objects);
   ArrayResize(rsi_indicators, total);

   for (int i=0; i<total; i++)
      rsi_indicators[i] = (CRSIIndividual*)GetPointer(rsi_objects[i]);
}

//+------------------------------------------------------------------+
void CRSIAverage::Update(const int start,const int rates_total)
{
   for (int i=start; i<rates_total; i++)
   {
      array[i] = 0.0;
      for (int j=0; j<10; j++)
         array[i] +=rsi_indicators[j].array[i];

      array[i]/=10.0;
   }
}
グローバルスコープからオブジェクトに直接アクセスできる場合、ポインタの配列を作成すると問題が複雑になりすぎるように感じるかもしれませんが、これにより、変更を加えることなく他の指標でクラスを再利用することが容易になります。また、この例では、RSI指標のポインタの代わりにオブジェクトの配列を再び使用するため、それらからポインタを取得する必要があります。
最終的に、OnInit関数(および上記のオブジェクト宣言)は次のようになります。
CRSIIndividual indicators[];
CRSIAverage average;
//+------------------------------------------------------------------+
//| Custom indicator initialization function                         |
//+------------------------------------------------------------------+
int OnInit()
{
//--- indicator buffers mapping
   ArrayResize(indicators, 10);


   int index=0, plot=0;

   for (int i=0; i<10; i++)
   {
      indicators[i].SetBuffer(index, plot);
      indicators[i].SetLineColor(InterpolateColors(clrYellow, clrRed, i/9.0));
      indicators[i].SetLabel("RSI ("+IntegerToString(firstPeriod+i*increment)+")");

      indicators[i].SetPeriodRSI(firstPeriod+i*increment);
      indicators[i].Init();
   }

   average.SetBuffer(index, plot);
   average.SetLineColor(clrBlue);
   average.SetLineStyle(STYLE_DASH);
   average.SetLineWidth(2);
   average.SetLabel("Average");

   average.SetRSIPointers(indicators);

//---
   return(INIT_SUCCEEDED);
}
そして、他のイベント処理関数をよりきれいにすることができます。
//+------------------------------------------------------------------+
//| Custom indicator iteration function                              |
//+------------------------------------------------------------------+
int OnCalculate(const int rates_total,
                const int prev_calculated,
                const datetime &time[],
                const double &open[],
                const double &high[],
                const double &low[],
                const double &close[],
                const long &tick_volume[],
                const long &volume[],
                const int &spread[])
{
//---
   int limit = MathMax(0, prev_calculated-1);

   for (int i=0; i<10; i++)
      indicators[i].Update(limit, rates_total);

   average.Update(limit, rates_total);

//--- return value of prev_calculated for next call
   return(rates_total);
}
//+------------------------------------------------------------------+
//| Custom indicator deinitialization function                       |
//+------------------------------------------------------------------+
void OnDeinit(const int reason)
{
   for (int i=0; i<10; i++)
      indicators[i].DeInit();
}
//+------------------------------------------------------------------+
視覚的には、指標は2番目の例とまったく同じに見えます。
4.クラスの拡大
今のところ、これらのクラスはすべてうまく機能していますが、扱ってきた指標のタイプに非常に固有です。いくつかのプロットプロパティと線画のみを使用しましたが、カラーバッファ、ヒストグラム、ジグザグなどを持つプロットを使用したい場合はどうすればよいでしょうか。おこなったことを再利用できるようにするには、クラスを一般化する必要があります。そのためには、次の3つの条件を満たす必要があります。
- クラスの外に出たり、バッファ/プロットインデックスの詳細を知らなくても、任意のタイプのプロット/バッファを作成したり、プロットプロパティを変更したりできる
- それぞれが持っているバッファの量とタイプを気にすることなく、任意の描画スタイル(線、ヒストグラム、ローソク足など)でプロットを追加できる(ただし、それらの配列に配置したデータには常に責任があります)
- 継承を使用して、特定の機能をクラスに簡単に追加できる(オプション)
それを念頭に置いて、まず、クラスがどのように実装され、継承がどのように構造化されているかを説明します。
まず、クラスは次のように構成されています。
- CIndicatorBufferBase
- CIndicatorCalculations
- CIndicatorPlotBase
- CIndicator_1Data
- CIndicatorPlotLine
- CIndicatorPlotHistogram
- ...
- CIndicator_1Data1Color
- CIndicatorPlotColorLine
- ...
- CIndicator_2Data
- CIndicatorPlotHistogram2
- ...
- CIndicator_2Data1Color
- CIndicatorPlotColorHistogram2
- ...
- CIndicator_4Data
- CIndicatorPlotCandles
- ...
- CIndicator_4Data1Color
- CIndicatorPlotColorCandles
- ...
次はいくつかの重要点です。
- 3つの点は、上記と同じものを継承するクラスが他にもあることを表しています(これらは、各クラスに暗黙的に適用される描画スタイルのみが異なります)。
- 赤色のクラスはインスタンス化できない抽象クラスですが、それらから派生した他のクラスのポインタを格納できます(ポリモーフィズム)。
- 残りのクラスは、対応する量のデータ/カラーバッファを持つ基本クラスから継承します。これにより、ライン、ヒストグラムなどとは関係なく、1つのデータバッファを持つクラスにアクセスする必要がある指標を使用できるため、ポリモーフィズムも可能になります。
- カラークラスは、上記のポイントと同じ理由でデータバッファから継承します。
- CIndicatorCalculationsは、プロットのない補助計算バッファに使用されます。
要約すると、実装は次のようになります。
//+------------------------------------------------------------------+
//| Base class for plots and calculation buffers                     |
//+------------------------------------------------------------------+
class CIndicatorBufferBase
{
public:
   virtual void      SetBuffer(int &buffer, int &plot)=NULL;
   virtual void      SetAsSeries(bool set)=NULL;

   virtual void      Init() { }
   virtual void      DeInit() { }
   virtual void      Update(const int rates_total,
                            const int prev_calculated,
                            const datetime &time[],
                            const double &open[],
                            const double &high[],
                            const double &low[],
                            const double &close[],
                            const long &tick_volume[],
                            const long &volume[],
                            const int &spread[]) { }
};

//+------------------------------------------------------------------+
//| Calculations Buffer (with no plot)                               |
//+------------------------------------------------------------------+
class CIndicatorCalculations : public CIndicatorBufferBase
{
public:
   double            array[];

   virtual void      SetBuffer(int &buffer, int &plot);
   virtual void      SetAsSeries(bool set);
};

//+------------------------------------------------------------------+
void CIndicatorCalculations::SetBuffer(int &index, int &plot)
{
   SetIndexBuffer(index, array, INDICATOR_CALCULATIONS);

   index++;
//No plot is used
}

//+------------------------------------------------------------------+
void CIndicatorCalculations::SetAsSeries(bool set)
{
   ArraySetAsSeries(array, set);
}

//+------------------------------------------------------------------+
//| Base indicator plot class                                        |
//+------------------------------------------------------------------+
class CIndicatorPlotBase : public CIndicatorBufferBase
{
protected:

   int               indicator_plot;

   virtual void      SetDrawType()=NULL; //Implicit in each class

public:

   void              SetArrow(uchar arrow);
   void              SetArrowShift(int shift);
   void              SetDrawBegin(int begin);
   void              SetShowData(bool show);
   void              SetShift(int shift);
   void              SetLineStyle(ENUM_LINE_STYLE style);
   void              SetLineWidth(int width);
   void              SetColorIndexes(color &color_array[]);
   void              SetLineColor(color line_color);
   void              SetLineColor(color line_color, int index);
   void              SetEmptyValue(double empty);
   void              SetLabel(string label);

   int               GetInteger(ENUM_PLOT_PROPERTY_INTEGER property_id, int property_modifier=0);
};

//...

//...

//+------------------------------------------------------------------+
//| Base for indicators with 1 Data Buffer                           |
//+------------------------------------------------------------------+
class CIndicator_1Data : public CIndicatorPlotBase
{
public:

   double            array[];

   virtual void      SetBuffer(int &buffer, int &plot);
   virtual void      SetAsSeries(bool set);
};

//+------------------------------------------------------------------+
void CIndicator_1Data::SetBuffer(int &buffer,int &plot)
{
   indicator_plot = plot;

   SetIndexBuffer(buffer, array, INDICATOR_DATA);
   SetDrawType();

   buffer++;
   plot++;
}

//...

//+------------------------------------------------------------------+
//| Plot Line (1 data buffer)                                        |
//+------------------------------------------------------------------+
class CIndicatorPlotLine : public CIndicator_1Data
{
protected:

   virtual void      SetDrawType() final;
};

//+------------------------------------------------------------------+
void CIndicatorPlotLine::SetDrawType(void)
{
   PlotIndexSetInteger(indicator_plot, PLOT_DRAW_TYPE, DRAW_LINE);
}

//...

//...

//+------------------------------------------------------------------+
//| Base for indicators with 2 Data Buffers                          |
//+------------------------------------------------------------------+
class CIndicator_2Data : public CIndicatorPlotBase
{
public:

   double            first_array[];
   double            second_array[];

   virtual void      SetBuffer(int &buffer, int &plot);
   virtual void      SetAsSeries(bool set);
};


//+------------------------------------------------------------------+
void CIndicator_2Data::SetBuffer(int &buffer, int &plot)
{
   indicator_plot = plot;

   SetIndexBuffer(buffer, first_array, INDICATOR_DATA);
   SetIndexBuffer(buffer+1, second_array, INDICATOR_DATA);
   SetDrawType();

   buffer+=2;
   plot++;
}

//...

//...

//+------------------------------------------------------------------+
//| Base for indicators with 1 Data Buffer & 1 Color Buffer          |
//+------------------------------------------------------------------+
class CIndicator_1Data1Color : public CIndicator_1Data
{
public:

   double            color_buffer[];

   virtual void      SetBuffer(int &buffer, int &plot);
   virtual void      SetAsSeries(bool set);
};

//+------------------------------------------------------------------+
void CIndicator_1Data1Color::SetBuffer(int &buffer, int &plot)
{
   CIndicator_1Data::SetBuffer(buffer, plot);

   SetIndexBuffer(buffer, color_buffer, INDICATOR_COLOR_INDEX);

   buffer++; //Add color buffer
}

//+------------------------------------------------------------------+
void CIndicator_1Data1Color::SetAsSeries(bool set)
{
   CIndicator_1Data::SetAsSeries(set);
   ArraySetAsSeries(color_buffer, set);
}

//...
各クラスには、必要なバッファの量が含まれています(および設定されています)。CIndicatorBufferBaseには、オプションで任意のタイプのバッファクラスによってオーバーライドできるイベントハンドラがあり、CIndicatorPlotBaseには、すべてのプロットプロパティのセッター(および1つのゲッター)が含まれています。各基本データ(色の有無にかかわらず)クラスには、バッファの配列宣言と設定関数が含まれています。およびすべての特定のクラスが関数SetDrawType()をオーバーライドし、それをfinalとして宣言するため、再度オーバーライドすることはできません(未定義の描画タイプのクラスが必要な場合は、対応する基本データクラスから継承してその関数をオーバーライドできます)。
注意として、この実装では、UpdateはOnCalculateイベントで使用されるすべての値を持ちますが、ポリモーフィズムを使用する必要がない場合は、より少ないパラメータでオーバーライドできます。
ArraySetAsSeriesも含まれています。これは非常に一般的な関数であり、ほとんどの場合、すべてのバッファを同じ方法で設定する必要があるためです。
クラスができたので、指標を作成できます。いくつかのことを例にまとめます。
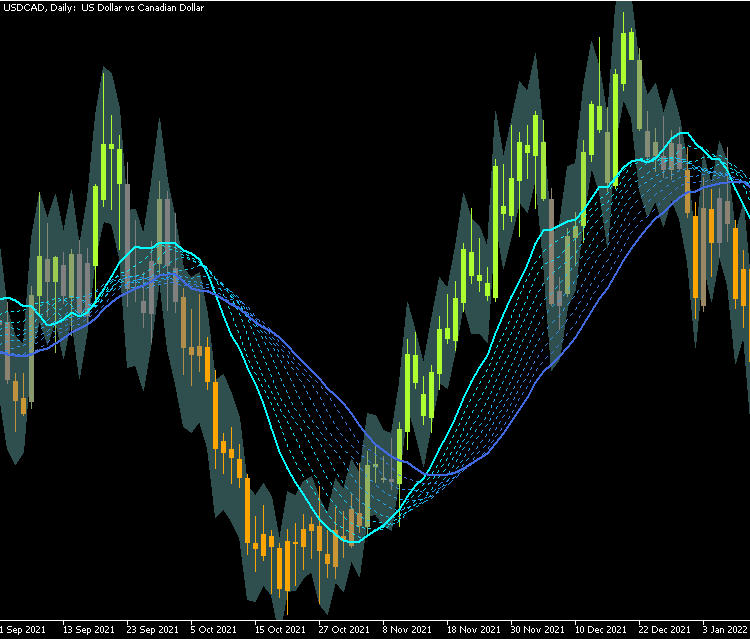
- まず、ATR指標に基づいてバンドを作成し、塗りつぶしプロットとして表示します。
- 次に、期間の異なる10個の移動平均を作成し、それらを折れ線グラフとしてチャートに表示します。
- 最後に、色付きローソク足プロットを使用して、バンドの上/下にあるMAの数に応じてローソク足の色を変更します。
まず、入力を宣言し、指標クラスとセクション3でおこなった色補間のファイルをインクルードします。
#property indicator_buffers 19
#property indicator_plots 13

#include <OOPIndicators/IndicatorClass.mqh>
#include <OOPIndicators/ColorLerp.mqh>

input int atr_period = 10; //ATR Period
input double atr_band_multiplier = 0.8; //ATR Multiplier for bands
input bool show_bands = true; //Show Bands
input bool show_data = false; //Show Extra Data

input int ma_faster_period = 14; //MA Faster Period
input int ma_step = 2; //MA Step
input ENUM_MA_METHOD ma_method = MODE_SMA; //MA Method
必要なバッファとプロットの量は既に定義されています。それぞれの必要な数を最初から知る必要はありません。以下で説明するように、値を見つける方が簡単です(OnInit()内)。
次に、指標の各部分のクラスを作成します。
ATRバンドから始めます。
//+------------------------------------------------------------------+
//| ATR Bands class (inherit from Filling Plot)                      |
//+------------------------------------------------------------------+
class CATRBand : public CIndicatorPlotFilling
{
private:

   int               handle;

public:

   virtual void      Init();
   virtual void      DeInit();
   virtual void      Update(const int limit, const int rates_total, const double &close[]);
};

//+------------------------------------------------------------------+
void CATRBand::Init(void)
{
   handle = iATR(NULL, PERIOD_CURRENT, atr_period);
}

//+------------------------------------------------------------------+
void CATRBand::Update(const int limit,const int rates_total,const double &close[])
{
   double atr[];
   CopyBuffer(handle, 0, 0, rates_total-limit, atr);

   for (int i=limit; i<rates_total; i++)
   {
      first_array[i] = close[i]+atr[i-limit]*atr_band_multiplier;
      second_array[i] = close[i]-atr[i-limit]*atr_band_multiplier;
   }
}

//+------------------------------------------------------------------+
void CATRBand::DeInit(void)
{
   IndicatorRelease(handle);
}
次は、Init()に期間とメソッドのパラメータを持つMAクラスです。
//+------------------------------------------------------------------+
//| Moving Averages class (inherit from Line Plot)                   |
//+------------------------------------------------------------------+
class CMA : public CIndicatorPlotLine
{
private:

   int               handle;

public:
   virtual void      Init(int period, ENUM_MA_METHOD mode);
   virtual void      DeInit();
   virtual void      Update(const int limit, const int rates_total);
};

//+------------------------------------------------------------------+
void CMA::Init(int period, ENUM_MA_METHOD mode)
{
   handle = iMA(NULL, PERIOD_CURRENT, period, 0, mode, PRICE_CLOSE);
}

//+------------------------------------------------------------------+
void CMA::Update(const int limit,const int rates_total)
{
   if (limit==0) CopyBuffer(handle, 0, 0, rates_total, array);
   else
   {
      double newVals[];
      CopyBuffer(handle, 0, 0, rates_total-limit, newVals);

      for (int i=limit; i<rates_total; i++)
         array[i] = newVals[i-limit];
   }
}

//+------------------------------------------------------------------+
void CMA::DeInit(void)
{
   IndicatorRelease(handle);
}
そしてローソク足クラスです。この場合、例がさらに複雑になるのを避けるために、グローバルスコープからオブジェクトにアクセスします。ただし、クラスを再利用する予定がある場合、これはお勧めできません。
また、以下で宣言するマクロも含まれています。 注意:関数はコード内のマクロの下にありますが、関数はここに表示されるように並べ替えられています。
//+------------------------------------------------------------------+
//| Color Candles class (inherit from Color Candles Plot)            |
//+------------------------------------------------------------------+
class CColorCandles : public CIndicatorPlotColorCandles
{
public:
   virtual void      Update(const int limit,
                            const int rates_total,
                            const double &open[],
                            const double &high[],
                            const double &low[],
                            const double &close[]);
};

//+------------------------------------------------------------------+
void CColorCandles::Update(const int limit,
                           const int rates_total,
                           const double &open[],
                           const double &high[],
                           const double &low[],
                           const double &close[])
{
   for (int i=limit; i<rates_total; i++)
   {
      open_array[i] = open[i];
      high_array[i] = high[i];
      low_array[i] = low[i];
      close_array[i] = close[i];

      int count_ma = TOTAL_MA;

      for (int m=0; m<TOTAL_MA; m++)
      {
         if (maIndicators[m].array[i] > bands.first_array[i]) count_ma++;
         if (maIndicators[m].array[i] < bands.second_array[i]) count_ma--;
      }

      color_buffer[i] = count_ma;

      //Update inside of this other object (to avoid making an extra inheritance, or an external loop)
      showIndex.array[i] = TOTAL_MA - count_ma;
   }
}
次に、オブジェクトを宣言し、バッファとプロットのビジュアルを構成する必要があります。
#define TOTAL_MA 10

CMA maIndicators[TOTAL_MA];
CATRBand bands;
CColorCandles candles;
CIndicatorPlotNone showIndex; //To show MAs above/below

//+------------------------------------------------------------------+
//| Custom indicator initialization function                         |
//+------------------------------------------------------------------+
int OnInit()
{
//--- indicator buffers mapping
   int buffer=0, plot=0;

   bands.SetBuffer(buffer, plot);
   candles.SetBuffer(buffer, plot);
   for (int i=0; i<TOTAL_MA; i++)
      maIndicators[i].SetBuffer(buffer, plot);
   showIndex.SetBuffer(buffer, plot);

//Print("Buffers: ", buffer, "  Plots: ", plot);

//--- plot settings
   if (show_bands) bands.SetLineColor(clrDarkSlateGray);
   else bands.SetLineColor(clrNONE);
   bands.SetShowData(show_data);
   if (show_data)
      bands.SetLabel("Close + ATR;Close - ATR");


   for (int i=0; i<TOTAL_MA; i++)
   {
      maIndicators[i].SetLineColor(InterpolateColors(clrAqua, clrRoyalBlue, i/(TOTAL_MA-1.0)));
      maIndicators[i].SetLabel("MA("+IntegerToString(ma_faster_period+i*ma_step)+")");
      maIndicators[i].SetShowData(show_data);
      if (i>0 && i <TOTAL_MA-1) maIndicators[i].SetLineStyle(STYLE_DOT);
      else maIndicators[i].SetLineWidth(2);
   }

   color arrow_colors[TOTAL_MA*2+1];

   for (int i=0; i<TOTAL_MA; i++)
      arrow_colors[i] = InterpolateColors(clrGreenYellow, clrGray, i/double(TOTAL_MA));
   arrow_colors[TOTAL_MA] = clrGray;
   for (int i=TOTAL_MA+1; i<TOTAL_MA*2+1; i++)
      arrow_colors[i] = InterpolateColors(clrGray, clrOrange, (i-TOTAL_MA)/double(TOTAL_MA));

   candles.SetColorIndexes(arrow_colors);
   candles.SetLabel("Open;High;Low;Close");
   candles.SetShowData(false);

   showIndex.SetLabel("MAs above/below");
   showIndex.SetShowData(true);

//--- initialize classes
   bands.Init();
   for (int i=0; i<TOTAL_MA; i++)
      maIndicators[i].Init(ma_faster_period+i*ma_step, ma_method);

   return(INIT_SUCCEEDED);
}
順番に、最初にバッファが構成され、次にプロットプロパティ、次にサブ指標が初期化されます(クラスで指定されているとおり)。
前に述べたように、変数bufferとplotの値を出力することで、必要なバッファとプロットの量を簡単に知ることができます。その後、プロパティを正しく設定できます(最初は、エラーを回避するために必要な数よりも大きな値を設定することもできます)。
Plot Noneクラスのインスタンスが含まれていることにも注意してください。そのオブジェクトは、candlesオブジェクトによって更新されるため、特定のイベントハンドラは必要ありません。データウィンドウのバンドの上または下にあるMAの量が表示されます。
最後に、すべてがオブジェクトの内部にあるため、他のイベントハンドラには多くの機能がありません。必要なのは、オブジェクトから関数を正しい順序で呼び出すことだけです。
//+------------------------------------------------------------------+
//| Custom indicator iteration function                              |
//+------------------------------------------------------------------+
int OnCalculate(const int rates_total,
                const int prev_calculated,
                const datetime &time[],
                const double &open[],
                const double &high[],
                const double &low[],
                const double &close[],
                const long &tick_volume[],
                const long &volume[],
                const int &spread[])
{
//---
   int limit = MathMax(0, prev_calculated-1);

   bands.Update(limit, rates_total, close);

   for (int i=0; i<TOTAL_MA; i++)
      maIndicators[i].Update(limit, rates_total);

   candles.Update(limit, rates_total, open, high, low, close);

//--- return value of prev_calculated for next call
   return(rates_total);
}

//+------------------------------------------------------------------+
//| Custom indicator deinitialization function                       |
//+------------------------------------------------------------------+
void OnDeinit(const int reason)
{
   bands.DeInit();
   for (int i=0; i<TOTAL_MA; i++)
      maIndicators[i].DeInit();
}
指標の最終結果は次のようになります。
5.この方法の制限
より便利ですが、プロパティの代わりに関数を使用すると、いくつかの欠点があります。最も顕著なのは、プロットの色/スタイルを変更するときの干渉であり、初期化によって残ったり、書き直されたりすることがあります。
この問題は、([色]タブで色を変更する代わりに)色の入力を使用するか、デフォルトの黒(0x000000)以外の色があるかどうかを確認することで回避できます。ただし、これは黒では機能しません。
if (obj.GetInteger(PLOT_LINE_COLOR)==clrBlack)
   obj.SetLineColor(clrYellow);
また、この記事では、これらのクラスを使用した場合のパフォーマンスへの影響を分析していません。理論的には、プロパティを直接使用して関数を少なくすると高速になりますが、ほとんどの場合、それほど変わりはありません。
最後に、お気付きかもしれませんが、クラスにはチャートイベントのハンドラとOnTimerは含まれていません。その理由は、(イベントが発生するたびにすべての指標のハンドラを呼び出し、すべてのイベントを複数回処理するよりも)チャートイベントがOnChartEventで直接処理され、その後に特定の関数を呼び出す方が適切だということです。タイマーの場合、指標が複数の時間枠または複数の通貨である場合は、Updateハンドラを別の方法で使用できます(OnCalculate配列に直接アクセスすることはできません)。一部の人が同意しないかもしれないその他の設計上の決定は、使用される配列をpublic可視性を持つバッファとして宣言することでした。protected可視性を持つ配列を設定することは可能であり、指標は引き続き機能しますが、外部でアクセスできるようにゲッターを追加する必要がある場合があります。
6.結論
この記事では、複雑な指標をより簡単に、より少ない行数で作成する方法を考え、開発しました。特定のケースのための小さな組織化トリックから始め、機能の再利用とカスタマイズを可能にするクラス構造を実装し、最後に、記事で説明されているほとんどの機能を使用するサンプル指標にすべてをまとめました。
MetaQuotes Ltdにより英語から翻訳されました。
元の記事: https://www.mql5.com/en/articles/11233
警告: これらの資料についてのすべての権利はMetaQuotes Ltd.が保有しています。これらの資料の全部または一部の複製や再プリントは禁じられています。
この記事はサイトのユーザーによって執筆されたものであり、著者の個人的な見解を反映しています。MetaQuotes Ltdは、提示された情報の正確性や、記載されているソリューション、戦略、または推奨事項の使用によって生じたいかなる結果についても責任を負いません。

 勢力指数による取引システムの設計方法を学ぶ
 一からの取引エキスパートアドバイザーの開発(第26部):未来に向かって(I)
 一からの取引エキスパートアドバイザーの開発(第27部):未来に向かって(II)
- 無料取引アプリ
- 8千を超えるシグナルをコピー
- 金融ニュースで金融マーケットを探索
グラフィカル・オブジェクトのことだと思ったんだ。そして何が新しいのか?
この記事の実装に対する良いアプローチであるだけで、目新しいことは何もない。
あなたの記事はとても良かった😁.でも、おっしゃる通り、パフォーマンスの問題にはちょっとした問題が絡んでいます。ほとんどの場合、何の影響もありませんし、何の問題もなく生活できます。しかし、変動が大きい時には、OnCalculateが受ける呼び出しの数のために、システムがクラッシュしたり、非常に遅くなったりすることがあります。しかし、問題は関数にあるのではなく、関数内で行われる相互作用にあります。なぜなら、呼び出されるたびに、MetaTraderはインジケータのバッファを読み込むことを余儀なくされ、その数が多い場合は問題が発生する可能性があるからです。これを解決する1つの方法は、OnTimeへのコールを使用することで、計算イベントごとではなく、あらかじめ定義された期間にわたってコールが実行されるため、負荷が少し軽くなります。手動または半自動で操作するのであれば、各計算は例えば200ミリ秒以内に実行されるから問題ないだろう。しかし、OnTimeイベントが計算スレッドに影響を与える可能性があるため、インジケーターでOnTimeイベントを使用するのはあまり適していません。これを実現する一つの方法は、OnCalculate自体で計算を強制し、CopyBufferコールを行う必要がないようにすることです。もうひとつ、OnCalculate関数の 次の行を修正することで、プロセッサーの消費サイクルを数マシンサイクル減らすことができる:
という行を修正することです:
たいしたことではないと思われるかもしれないが、この場合に三項演算子を使うと、関数を呼び出すよりも効率が良くなる。このような些細なことが、ボラティリティの高い時には大きな違いを生む.😁👍