Multi oscillator divergence MT5
- Indicatori
-
Jan Flodin
 Hello, my name is Jan and I have been developing automated trading tools for the last 9 years. I am originally from Sweden but have lived in the Czech Republic since 2003.
PRODUCTS - Versione: 3.7
- Aggiornato: 23 aprile 2026
- Attivazioni: 10
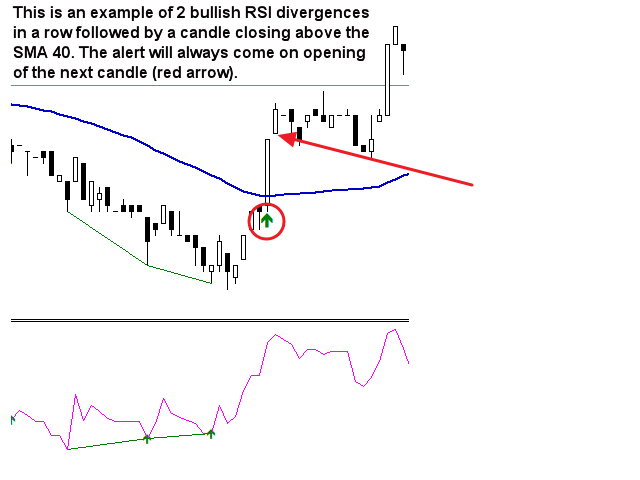
L'indicatore identifica quando si verifica una divergenza tra il prezzo e un oscillatore/indicatore. Identifica divergenze regolari e nascoste. Ha un'opzione di filtro RSI che consente di filtrare solo le configurazioni più potenti. L'indicatore offre anche opzioni per attendere una formazione Engulfing, un breakout del canale Donchian o che il prezzo superi una media mobile (vedi screenshot n. 3) per confermare la divergenza prima di segnalare l'opportunità commerciale. Combinato con le tue regole e tecniche, questo indicatore ti consentirà di creare (o migliorare) il tuo potente sistema.
Caratteristiche
- Alla fine di blog del prodotto sarai in grado di scaricare il codice sorgente di un esempio di Expert Advisor (EA) che utilizza la funzione iCustom() per recuperare i segnali commerciali dall'indicatore. Anche se EA è completamente funzionante, lo scopo principale è utilizzare il codice e incollarlo nel tuo EA sviluppato. Dato il mio tempo limitato Tuttavia, non sarò in grado di fornire alcun supporto per la programmazione. Le mie scuse
- Può rilevare divergenze per i seguenti oscillatori/indicatori: MACD, OsMA, Stochastics, RSI, CCI, RVI, Awesome, ADX, Composite index, ATR, OBV, MFI, Momentum, Accumulation/Distribution e Accelerator. È possibile selezionare un solo oscillatore/indicatore.
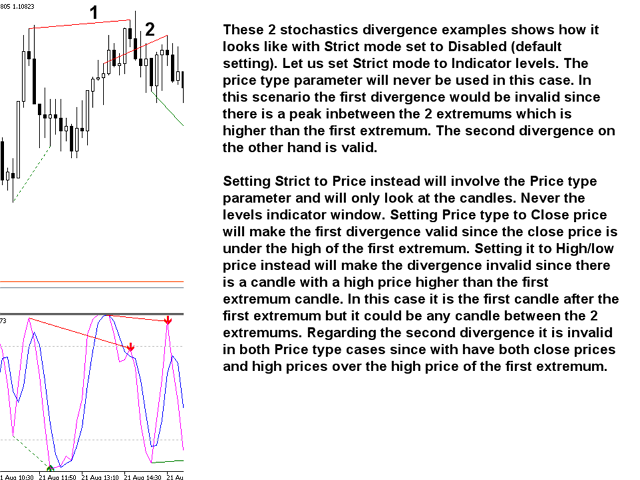
- Disegna linee continue per divergenze regolari/classiche (potenziale inversione) e linee tratteggiate per divergenze nascoste (continuazione del trend). Le linee vengono tracciate sia sul grafico che nella finestra dell'indicatore.
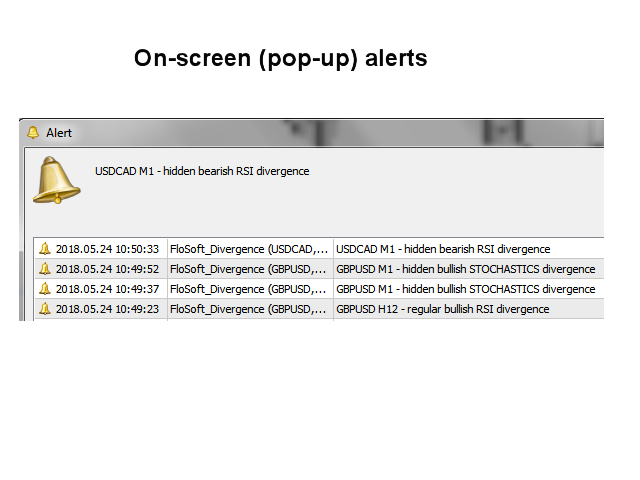
- Invia un avviso quando viene rilevata una divergenza o un breakout/cross. Sono supportati tutti i tipi di avvisi nativi Metatrader.
Parametri di input
Si prega di trovare la descrizione e la spiegazione dei parametri di input qui .


A very good indicator. Lots of settings for displaying signals, MA, Donchian, etc. This alone filters out many false signals. A few years ago, I used MT4, but I returned to this indicator in MT5. Of course, no indicator always displays 100% correct signals, so it is always necessary to check whether the divergence is correctly plotted, because sometimes the divergence is marked strangely. In any case, despite this, it is the best divergence indicator I have known since 2020.