Supply Demand levels
- Indicatori
-
Jan Flodin
 Hello, my name is Jan and I have been developing automated trading tools for the last 9 years. I am originally from Sweden but have lived in the Czech Republic since 2003.
PRODUCTS - Versione: 1.2
- Aggiornato: 13 maggio 2025
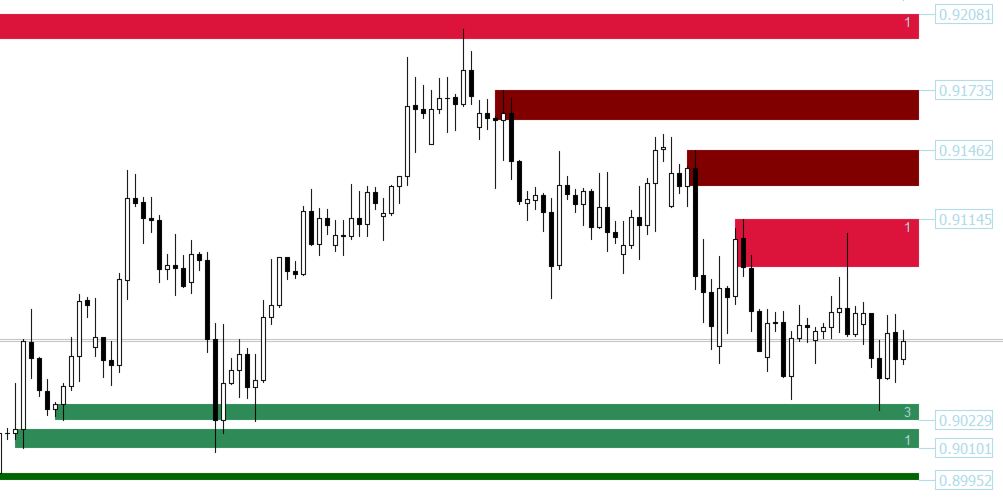
Questo indicatore traccia zone di domanda e offerta sul grafico. In combinazione con le tue regole e tecniche, questo indicatore ti consentirà di creare (o migliorare) il tuo potente sistema. Dai un'occhiata anche alla versione a pagamento che offre molto di più. Il mio consiglio è di cercare opportunità di trading in cui il primo test di zona si verifica dopo almeno 25 barre.
Caratteristiche
- Le zone hanno 3 colori (regolabili tramite input). Colore scuro per la zona non testata, medio per la zona testata e chiaro per la zona rotta .
- Per ogni zona vengono indicati il prezzo del confine esterno della zona e l'importo del test di zona.
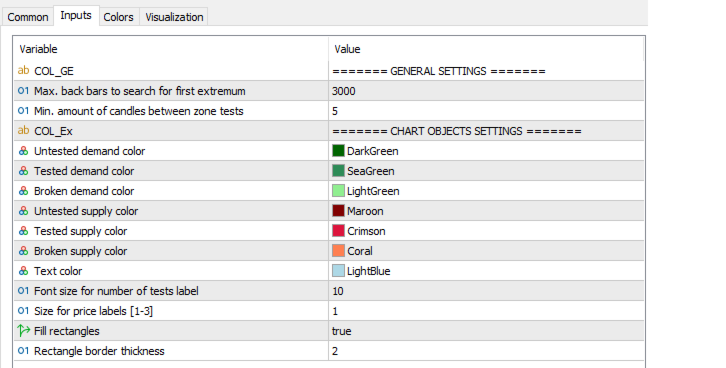
Parametri di input
- Max. barre posteriori per ricercare il primo estremo - Il valore predefinito è 3000. Cercherà le prime barre estreme xx indietro nel tempo. Più alto è il valore, più risorse di sistema saranno necessarie . Per computer più lenti, un valore di 500-1000 può essere più adatto.
- Quantità minima di candele tra i test di zona
- Colore della domanda non testato
- Colore di domanda testato
- Colore domanda interrotta
- Colore di fornitura non testato
- Colore di fornitura testato
- Colore di fornitura rotto
- Colore del testo
- Dimensione del carattere per l'etichetta del numero di test
- Dimensioni per etichette prezzo [1-3]


отлично