• Panoramica
  • Recensioni (10)
  • Commenti (127)
  • Novità

Multi oscillator divergence scanner

5

I recommend you to read the product's blog (manual) from start to end so that it is clear from the beginning what the indicator offers.

This multi oscillator, multi time frame and multi symbol indicator identifies when a divergence occurs between price and an oscillator/indicator. It identifies both regular/classical (trend reversal) and hidden (trend continuation) divergences. It has moving average, RSI/Bollinger, ADX, pin bar and engulfing filter options which makes it possible to filter out only the strongest setups. Combined with your own rules and techniques, this indicator will allow you to create (or enhance) your own powerful system.

Features

  • Can detect divergences for the following oscillators/indicators: MACD (signal line or main line (histogram)), Stochastics, OsMA, RSI, CCI, RVI, Awesome (AO), OBV, ADX, ATR, MFI, Momentum and Composite Index. Only one oscillator can be selected.
  • Can monitor all symbols visible in your Market Watch window at the same time. Apply the indicator to just one chart and instantly monitor the entire market.
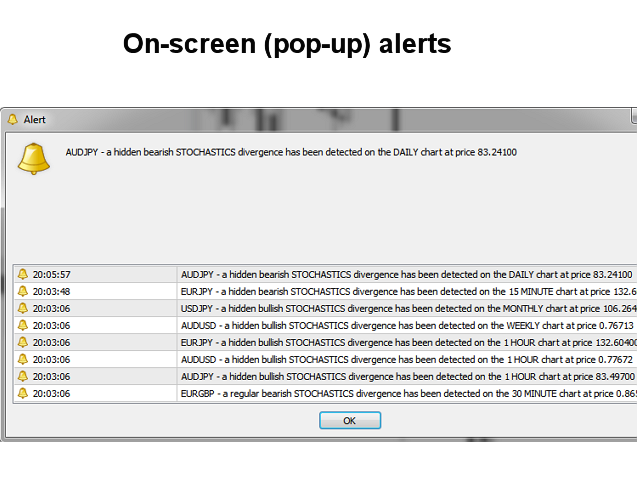
  • Can monitor every time frame, from M1 to MN, and sends you a real-time alert when a divergence has been identified. All Metatrader native alert types are supported.
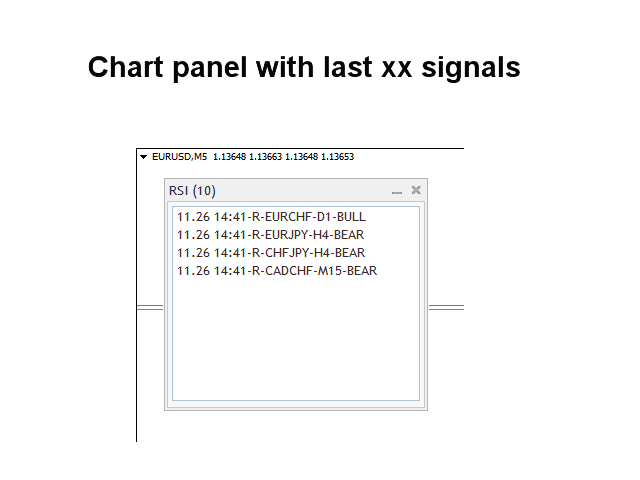
  • The indicator includes an interactive panel. Please see the blog for explanation.
  • The indicator can write the signals to a file which can be used by an Expert Advisor for auto trading.

Input parameters 

Please find the description and explanation of the input parameters here.

Important

Please note that due to the multi-time frame functionality, this indicator will not draw lines and arrows or sell and buy advice on the chart where the indicator has been installed. For this purpose you need to create a chart template with my free divergence indicator. It is highly advisable to put the indicator on a clean (empty) chart without any other indicators or Expert Advisors on it which could interfere with the scanner.


Recensioni 10
FiBiGoal
20
FiBiGoal 2020.08.02 10:46 
 

Excellent product, works as described, very good contact with a friendly creator, thank you Jan. Imho one of the best developers here.

Jorge
36
Jorge 2020.04.13 21:12 
 

Excellent indicator. Purchased in october 2.019. Works perfect, lots of filters. Very happy with it.

Ke Huang
691
Ke Huang 2019.10.16 11:09 
 

I purchased the indicator today,when I use it for a while, I will evaluate its effect again, but it is worth mentioning that the author's technical support is very powerful, and I will give five stars to this point.

Prodotti consigliati
Noize Absorption Index MT4
Ekaterina Saltykova
5 (1)
Noize Absorption Index - is the manual trading system that measures the difference of pressure between bears forces and bulls forces. Green line - is a noize free index that showing curent situation. Zero value of index shows totally choppy/flat market.Values above zero level shows how powerfull bullish wave is and values below zero measures bearish forces.Up arrow appears on bearish market when it's ready to reverse, dn arrow appears on weak bullish market, as a result of reverse expectation. S
Indicator for binary options arrow is easy to use and does not require configuration works on all currency pairs, cryptocurrencies buy signal blue up arrow sell signal red down arrow tips do not trade during news and 15-30 minutes before their release, as the market is too volatile and there is a lot of noise it is worth entering trades one or two candles from the current period (recommended for 1 candle) timeframe up to m 15 recommended money management fixed lot or fixed percentage of the depo
Wolfe Wave Scanner MT4
Reza Aghajanpour
4.56 (9)
**  All Symbols  x  All Timeframes  scan just by pressing scanner button ** *** Contact me after the purchase to send you instructions and add you in "Wolfe Wave Scanner group" for sharing or seeing experiences with other users. Introduction: A Wolfe Wave is created with five-wave patterns in price. It shows supply and demand and a fight towards a balance price. T hese waves of price actions can help traders identify the boundaries of   the trend . Also  It helps forecast how the price will move
Master Scalping M1 è un indicatore innovativo che utilizza un algoritmo per determinare il trend in modo rapido e preciso. L'indicatore calcola il tempo di apertura e chiusura delle posizioni, gli algoritmi dell'indicatore consentono di trovare i momenti ideali per entrare in un trade (acquistare o vendere un asset), il che aumenta il successo delle transazioni per la maggior parte dei trader. Vantaggi dell'indicatore: Facile da usare, non sovraccarica il grafico con informazioni inutili. Può es
The Th3Eng PipFinite indicator is based on a very excellent analysis of the right trend direction with perfect custom algorithms. It show the true direction and the best point to start trading. With StopLoss point and Three Take Profit points. Also it show the right pivot of the price and small points to order to replace the dynamic support and resistance channel, Which surrounds the price. And Finally it draws a very helpful Box on the left side on the chart includes (take profits and Stop loss
Awesome Oscillator by Bill Williams with the ability to fine-tune and replace the averaging algorithms of the indicator, which significantly expands the possibilities of using this oscillator in algorithmic trading and brings it closer in its properties to such an indicator as the MACD. To reduce price noise, the final indicator is processed with an additional Smooth averaging. The indicator has the ability to give alerts, send mail messages and push signals when the direction of movement of th
Strong Retracement Points Pro demo edition! SRP (Strong Retracement/Reversal Points) is a powerful and unique support and resistance indicator. It displays the closest important levels which we expect the price retracement/reversal! If all level are broken from one side, it recalculates and draws new support and resistance levels, so the levels might be valid for several days depending on the market! If you are still hesitating to start using this wonderful tool, you can check this link to see h
VR Cub
Vladimir Pastushak
VR Cub è un indicatore per ottenere punti di ingresso di alta qualità. L'indicatore è stato sviluppato per facilitare i calcoli matematici e semplificare la ricerca dei punti di ingresso in una posizione. La strategia di trading per la quale è stato scritto l'indicatore ha dimostrato la sua efficacia per molti anni. La semplicità della strategia di trading è il suo grande vantaggio, che consente anche ai trader alle prime armi di commerciare con successo con essa. VR Cub calcola i punti di apert
Owl smart levels
Sergey Ermolov
4.63 (54)
Versione MT5  |  FAQ L' indicatore Owl Smart Levels   è un sistema di trading completo all'interno dell'unico indicatore che include strumenti di analisi di mercato popolari come i   frattali avanzati di Bill Williams , Valable ZigZag che costruisce   la corretta struttura a onde   del mercato, e i   livelli di Fibonacci che segnano i livelli esatti di entrata nel mercato e luoghi per prendere profitti. Descrizione dettagliata della strategia Istruzioni per lavorare con l'indicatore Consulente-
MACDivergence MTF
Pavel Zamoshnikov
4.29 (7)
Advanced ideas of the popular MACD indicator: It detects and displays classic and reverse divergences (three methods of detecting divergences). It uses different color to highlight an uptrend and a downtrend. Two methods of determining a trend: а) MACD crosses the 0 level (classic signal); б) MACD crosses its own average (early signal). This is a multi-timeframe indicator: it can display MACD data from other timeframes. Two methods of drawing: classic histogram and line. It generates sound and v
Forex Indicator "MACD with Trend ZigZag" for MT4 MACD   indicator itself is one of the most popular tool for trend trading "MACD with Trend ZigZag" is excellent for using   with Price Action entries or in combination with other indicators Use this indicator to select most accurate entry signals: - If MACD is above 0 (green color) and ZigZag line is upward - search only for Buy Price Action patterns -  If MACD is below 0 (pink color) and ZigZag line is downward - search only for Sell Price Action
TWO PAIRS SQUARE HEDGE METER INDICATOR Try this brilliant 2 pairs square indicator It draws a square wave of the relation between your two inputs symbols when square wave indicates -1 then it is very great opportunity to SELL pair1 and BUY Pair2 when square wave indicates +1 then it is very great opportunity to BUY pair1 and SELL Pair2 the inputs are : 2 pairs of symbols         then index value : i use 20 for M30 charts ( you can try other values : 40/50 for M15 , : 30 for M30 , : 10 for H1 ,
Fibonacci retracement and extension line drawing tool Fibonacci retracement and extended line drawing tool for MT4 platform is suitable for traders who use  golden section trading Advantages: There is no extra line, no too long line, and it is easy to observe and find trading opportunities Trial version: https://www.mql5.com/zh/market/product/35884 Main functions: 1. Multiple groups of Fibonacci turns can be drawn directly, and the relationship between important turning points
Gioteen Volatility Index (GVI)   - your ultimate solution to overcoming market unpredictability and maximizing trading opportunities. This revolutionary indicator helps you in lowering your losing trades due to choppy market movements. The GVI is designed to measure market volatility, providing you with valuable insights to identify the most favorable trading prospects. Its intuitive interface consists of a dynamic red line representing the volatility index, accompanied by blue line that indicat
Advanced Stochastic Scalper
Evgeny Belyaev
4.61 (18)
Advanced Stochastic Scalper - is a professional indicator based on the popular Stochastic Oscillator. Advanced Stochastic Scalper is an oscillator with dynamic overbought and oversold levels, while in the standard Stochastic Oscillator, these levels are static and do not change. This allows Advanced Stochastic Scalper to adapt to the ever-changing market. When a buy or a sell signal appears, an arrow is drawn on the chart and an alert is triggered allowing you to open a position in a timely mann
PipFinite Energy Beam
Karlo Wilson Vendiola
3.94 (17)
Pipfinite creates unique, high quality and affordable trading tools. Our tools may or may not work for you, so we strongly suggest to try the Demo Version for MT4 first. Please test the indicator prior to purchasing to determine if it works for you. We want your good reviews, so hurry up and test it for free...we hope you will find it useful. Combo Energy Beam with Swing Control Strategy: Confirm swing pullback signals Watch Video: (Click Here) Energy Beam with Trend Laser Strategy: Confirm Tr
Title : Market Bias Indicator - Oscillator-Based Trading Tool Introduction : Discover the potential of the "Market Bias Indicator," a revolutionary oscillator-based trading tool designed for precise market analysis. If you're in search of a robust alternative to traditional bias indicators, your quest ends here. Market Bias Indicator offers unparalleled accuracy in identifying market sentiment and is your gateway to confident trading decisions. Recommended Trading Pairs : Market Bias Indicator i
Buy and sell zones
Evgeniy Zhdan
5 (3)
Indicator for determining flat and trend. If the price is below any of the two histograms and two lines (red and blue), this is a sell zone. When purchasing this version of the indicator, MT5 version for one real and one demo account - as a gift (to receive, write me a private message)! If the price is above any of the two histograms and two lines (red and blue), this is a buy zone. MT5 version:  https://www.mql5.com/en/market/product/70409 If the price is between two lines or in the zone
Gartley Projection D
Oleksandr Medviediev
3.71 (7)
The indicator identifies the harmonic patterns (XABCD) according to developments of H.M.Gartley ( "Profits in the Stock Market" , 1935г). It projects D-point as a point in the perspective projection (specify ProjectionD_Mode = true in the settings). Does not redraw. When a bar of the working timeframe closes, if the identified pattern point has not moved during Patterns_Fractal_Bars bars, an arrow appears on the chart (in the direction of the expected price movement). From this moment on, the ar
Chart Patterns Detect 15 patterns (Ascending Triangle, Descending Triangle, Rising Wedge, Falling Wedge, Bullish Flag, Bearish Flag, Bullish Rectangle, Bearish Rectangle Symmetrical triangle, Head and Shoulders, Inverted Head and Shoulders, Triple top, Triple Bottom, Double Top, Double Bottom) Use historical data to calculate the probability of each pattern to succeed (possibility to filter notification according to the chance of success) gives graphic indication about the invalidation level and
Sto Signal AM
Andriy Matviyevs'kyy
This indicator displays Stochastic osc signals on the price chart and allows the user to receive notifications of such signals. The Stochastic indicator is a classic and proven indicator of the technical analysis of the markets. Despite its age, it is still relevant today. Depending on the settings, the indicator allows you to work effectively on various TFs and any markets. Signals are given on fully formed bars and are not redrawn. Custom Parameters: Stochastic_Price (0-1) - The applied pric
Quantum Heiken Ashi PRO MT4
Bogdan Ion Puscasu
4.43 (7)
Presentazione del       Grafici   Quantum Heiken Ashi PRO Progettate per fornire informazioni chiare sulle tendenze del mercato, le candele Heiken Ashi sono rinomate per la loro capacità di filtrare il rumore ed eliminare i falsi segnali. Dì addio alle confuse fluttuazioni dei prezzi e dai il benvenuto a una rappresentazione grafica più fluida e affidabile. Ciò che rende il Quantum Heiken Ashi PRO davvero unico è la sua formula innovativa, che trasforma i dati tradizionali delle candele in barre
TREND HARMONY MT4 –  Multi Timeframe Trend and Phase and Pullback Level Visualizer indicator for Metatrader4 The TREND HARMONY indicator automates deep trend analysis and generates visualizations for you. Take control of your trades by eliminating uncertainty! Revolutionize your trading experience with precision and insight through the TREND HARMONY Multi Timeframe Trend Indicator – your ultimate MT4 trend visualization indicator. Are you tired of missing trading opportunities or consistently e
Candle GAP
Thushara Dissanayake
L'indicatore   Candle GAP   è uno strumento essenziale per i trader che utilizzano   le strategie di Gap Trading   in quanto identifica automaticamente i gap delle candele per ogni giorno della settimana. Un gap si riferisce a una differenza di livello di prezzo tra la chiusura e l'apertura di due giorni consecutivi. Questo indicatore riconosce quattro tipi di modelli di gap: comune, fuga, continuazione ed esaurimento. Incorporando questo indicatore in qualsiasi grafico, i trader possono convali
True SnD
Indra Lukmana
5 (1)
This Supply & Demand indicator uses a unique price action detection to calculate and measures the supply & demand area. The indicator will ensure the area are fresh and have a significant low risk zone. Our Supply Demand indicator delivers functionality previously unavailable on any trading platform. Trading idea You may set pending orders along the supply & demand area. You may enter a trade directly upon price hit the specific area (after a rejection confirmed). Input parameters Signal - S
Cosmic Diviner X Planet
Olena Kondratenko
4 (2)
This unique multi-currency strategy simultaneously determines the strength of trends and market entry points, visualizing this using histograms on the chart. The indicator is optimally adapted for trading on the timeframes М5, М15, М30, Н1. For the convenience of users, the indicator renders the entry point (in the form of an arrow), recommended take profit levels (TP1, TP2 with text labels) and the recommended Stop Loss level. The take profit levels (TP1, TP2) are automatically calculated for
HMA Trend Professional MT4
Pavel Zamoshnikov
4.63 (8)
Improved version of the free HMA Trend indicator (for MetaTrader 4) with statistical analysis. HMA Trend is a trend indicator based on the Hull Moving Average (HMA) with two periods. HMA with a slow period identifies the trend, while HMA with a fast period determines the short-term movements and signals in the trend direction. The main differences from the free version: Ability to predict the probability of a trend reversal using analysis of history data. Plotting statistical charts for analyz
Blahtech Market Profile
Blahtech Limited
4.61 (18)
Was: $249  Now: $99   Market Profile defines a number of day types that can help the trader to determine market behaviour. A key feature is the Value Area, representing the range of price action where 70% of trading took place. Understanding the Value Area can give traders valuable insight into market direction and establish the higher odds trade. It is an excellent addition to any system you may be using. Blahtech Limited presents their Market Profile indicator for the MetaTrader community. Ins
ZhiBiCCI MT4
Qiuyang Zheng
5 (1)
[ZhiBiCCI] indicators are suitable for all cycle use, and are also suitable for all market varieties. [ZhiBiCCI] Green solid line is a reversal of bullish divergence. The green dotted line is a classic bullish divergence. [ZhiBiCCI] The solid line to the red is a reverse bearish divergence. The red dotted line is a classical bearish divergence. [ZhiBiCCI] can be set in the parameters (Alert, Send mail, Send notification), set to (true) to send instant signals to the alarm window, email, in
Una delle sequenze numeriche è chiamata "Sequenza di incendi boschivi". È stata riconosciuta come una delle nuove sequenze più belle. La sua caratteristica principale è che questa sequenza evita andamenti lineari, anche quelli più brevi. È questa proprietà che ha costituito la base di questo indicatore. Quando si analizza una serie temporale finanziaria, questo indicatore cerca di rifiutare tutte le possibili opzioni di tendenza. E solo se fallisce, riconosce la presenza di una tendenza e dà il
Gli utenti di questo prodotto hanno anche acquistato
Gann Made Easy
Oleg Rodin
4.96 (45)
Gann Made Easy è un sistema di trading Forex professionale e facile da usare che si basa sui migliori principi del trading utilizzando la teoria di mr. WD Gann. L'indicatore fornisce segnali ACQUISTA e VENDI accurati, inclusi i livelli di Stop Loss e Take Profit. Puoi fare trading anche in movimento utilizzando le notifiche PUSH. Vi prego di contattarmi dopo l'acquisto! Condividerò i miei consigli di trading con te e fantastici indicatori bonus gratuitamente! Probabilmente hai già sentito parlar
Atomic Analyst
Issam Kassas
5 (1)
Innanzitutto, vale la pena sottolineare che questo indicatore di trading non è repaint, non è ridisegno e non presenta ritardi, il che lo rende ideale sia per il trading manuale che per quello automatico. L'Analista Atomico è un indicatore di azione del prezzo PA che utilizza la forza e il momentum del prezzo per trovare un miglior vantaggio sul mercato. Dotato di filtri avanzati che aiutano a rimuovere rumori e segnali falsi, e aumentare il potenziale di trading. Utilizzando più strati di in
Scalper Vault
Oleg Rodin
5 (27)
Scalper Vault è un sistema di scalping professionale che ti fornisce tutto il necessario per scalping di successo. Questo indicatore è un sistema di trading completo che può essere utilizzato dai trader di forex e opzioni binarie. L'intervallo di tempo consigliato è M5. Il sistema fornisce segnali di freccia accurati nella direzione della tendenza. Ti fornisce anche i segnali più alti e più bassi e i livelli di mercato di Gann. Gli indicatori forniscono tutti i tipi di avvisi, comprese le notifi
TPSproTREND PrO
Roman Podpora
5 (15)
TPSpro TRENDPRO  - is a trend indicator that automatically analyzes the market and provides information about the trend and each of its changes, as well as giving signals for entering trades without redrawing! The indicator uses each candle, analyzing them separately. referring to different impulses - up or down impulse. Exact entry points into transactions for currencies, crypto, metals, stocks, indices!  -  Version MT5               DETAILED DESCRIPTION        /       TRADING SETUPS           
Trend Screener
STE S.S.COMPANY
4.83 (86)
Indicatore di tendenza, soluzione unica rivoluzionaria per il trading di tendenze e il filtraggio con tutte le importanti funzionalità di tendenza integrate in un unico strumento! È un indicatore multi-timeframe e multi-valuta al 100% non ridipingibile che può essere utilizzato su tutti i simboli/strumenti: forex, materie prime, criptovalute, indici e azioni. Trend Screener è un indicatore di tendenza che segue un indicatore efficiente che fornisce segnali di tendenza a freccia con punti nel gra
Presentazione       Quantum Trend Sniper Indicator   , l'innovativo indicatore MQL5 che sta trasformando il modo in cui identifichi e scambi le inversioni di tendenza! Sviluppato da un team di trader esperti con un'esperienza di trading di oltre 13 anni,       Indicatore Quantum Trend Sniper       è progettato per spingere il tuo viaggio di trading verso nuove vette con il suo modo innovativo di identificare le inversioni di tendenza con una precisione estremamente elevata. *** Acquista Quant
Innanzitutto, vale la pena sottolineare che questo Strumento di Trading è un Indicatore Non-Ridipingente, Non-Ridisegnante e Non-Laggante, il che lo rende ideale per il trading professionale. L'Indicatore Smart Price Action Concepts è uno strumento molto potente sia per i nuovi che per i trader esperti. Racchiude più di 20 utili indicatori in uno solo, combinando idee di trading avanzate come l'Analisi del Trader del Circolo Interno e le Strategie di Trading dei Concetti del Denaro Intelligen
ATTUALMENTE SCONTATO DEL 26% La soluzione migliore per ogni principiante o trader esperto! Questo indicatore è uno strumento di trading unico, di alta qualità e conveniente perché abbiamo incorporato una serie di caratteristiche proprietarie e una nuova formula. Con un solo grafico è possibile leggere la forza delle valute per 28 coppie Forex! Immaginate come migliorerà il vostro trading perché sarete in grado di individuare l'esatto punto di innesco di una nuova tendenza o di un'opportunit
TPSpro RFI Levels
Roman Podpora
5 (13)
A key element in trading is zones or levels from which decisions to buy or sell a trading instrument are made. Despite attempts by major players to conceal their presence in the market, they inevitably leave traces. Our task was to learn how to identify these traces and interpret them correctly. Reversal First Impulse levels (RFI)   -  Version MT5                INSTRUCTIONS                 RUS                 ENG                                       R ecommended to use with an indicator   -  
Advanced Supply Demand
Bernhard Schweigert
4.92 (310)
CURRENTLY 26% OFF !! Best Solution for any Newbie or Expert Trader! This indicator is a unique, high quality and affordable trading tool because we have incorporated a number of proprietary features and a new formula. With this update, you will be able to show double timeframe zones. You will not only be able to show a higher TF but to show both, the chart TF, PLUS the higher TF: SHOWING NESTED ZONES. All Supply Demand traders will love it. :) Important Information Revealed Maximize the potenti
Entry Points Pro
Yury Orlov
4.7 (224)
Indicatore top per MT5 che fornisce segnali accurati per entrare in un trade senza riverniciare! Può essere applicato a qualsiasi attività finanziaria: forex, criptovalute, metalli, azioni, indici.  La versione MT5 è qui Fornirà segnali di trading piuttosto precisi e ti dirà quando è meglio aprire un trade e chiuderlo. Guarda il video (6:22) con un esempio di elaborazione di un solo segnale che ha ripagato l'indicatore! La maggior parte dei trader migliora i propri risultati di trading
Scalper Inside PRO
Alexey Minkov
4.75 (55)
SALE NOW! Limited Time Offer! An exclusive indicator that utilizes an innovative algorithm to swiftly and accurately determine the market trend. The indicator automatically calculates opening, closing, and profit levels, providing detailed trading statistics. With these features, you can choose the most appropriate trading instrument for the current market conditions. Additionally, you can easily integrate your own arrow indicators into Scalper Inside Pro to quickly evaluate their statistics and
Scopri il segreto per il trading Forex di successo con il nostro indicatore MT4 personalizzato! Ti sei mai chiesto come raggiungere il successo nel mercato Forex, guadagnando costantemente profitti minimizzando il rischio? Ecco la risposta che hai cercato! Permettici di presentare il nostro indicatore MT4 proprietario che rivoluzionerà il tuo approccio al trading. Versatilità unica Il nostro indicatore è appositamente progettato per gli utenti che preferiscono le formazioni di candele Ren
TrendMaestro
Stefano Frisetti
5 (2)
nota: questo indicatore e' per METATRADER4, se vuoi la versione per  METATRADER5 questo e' il link:  https://www.mql5.com/it/market/product/108123 TRENDMAESTRO riconosce un nuovo TREND sul nascere, non sbaglia mai. La sicurezza di identificare un nuovo TREND non ha prezzo. DESCRIZIONE TRENDMAESTRO identifica un nuovo TREND sul nascere, questo indicatore prende in esame la volatilita' i volumi ed il momentum per identificare il momento in cui c'e' un'esplosione di uno  opiu' di questi dati
Attualmente 20% di sconto! La soluzione migliore per ogni principiante o trader esperto! Questo software per cruscotti funziona su 28 coppie di valute. Si basa su 2 dei nostri indicatori principali (Advanced Currency Strength 28 e Advanced Currency Impulse). Offre un'ottima panoramica dell'intero mercato Forex. Mostra i valori di forza delle valute avanzate, la velocità di movimento delle valute e i segnali per 28 coppie Forex in tutti i (9) timeframe. Immaginate come migliorerà il vostro t
Presentazione dell'indicatore Miraculous Forex: Libera il potere del trading preciso Sei stanco di cercare il miglior indicatore Forex che fornisca risultati eccezionali su tutti i timeframe? Non cercare oltre! L'indicatore Miraculous Forex è qui per rivoluzionare la tua esperienza di trading e portare i tuoi profitti a nuove vette. Basato su tecnologia all'avanguardia e anni di sviluppo accurato, l'indicatore Miraculous Forex si distingue come l'apice di potenza e precisione nel mercato delle v
Market Reversal Alerts
LEE SAMSON
4.21 (121)
Il profitto dalla struttura del mercato cambia quando il prezzo si inverte e si ritira. L'indicatore di avviso di inversione della struttura del mercato identifica quando una tendenza o un movimento di prezzo si sta avvicinando all'esaurimento e pronto a invertire. Ti avvisa dei cambiamenti nella struttura del mercato che in genere si verificano quando stanno per verificarsi un'inversione o un forte pullback. L'indicatore identifica inizialmente i breakout e lo slancio del prezzo, ogni volta
FX Power MT4 NG
Daniel Stein
5 (8)
Ricevi il tuo aggiornamento quotidiano sul mercato con dettagli e schermate tramite il nostro Morning Briefing qui su mql5 e su Telegram ! FX Power MT4 NG è la nuova generazione del nostro popolare misuratore di forza delle valute, FX Power. Cosa offre questo misuratore di forza di nuova generazione? Tutto ciò che avete amato dell'FX Power originale IN PIÙ Analisi della forza di ORO/XAU Risultati di calcolo ancora più precisi Periodi di analisi configurabili individualmente Limite di calcolo pe
AVVISO DI ACQUISTO E VENDITA MULTIVALUTA e MULTITIMEFRAME. AUTO TAILING STOP E RISCHIO PREMIO TAKEPROFIT! L'INDICATORE SCANSIONA E ANALIZZA IL MERCATO COSÌ NON HAI NULLA DA FARE! SCAMBIA TUTTE LE TUE VALUTE SU 1 TABELLA!   Dopo l'acquisto lascia un commento contattami e ti invierò l'assistente commerciale EA. L'indicatore utilizza diversi oscillatori e filtri allegati per trovare i migliori punti di ingresso CONFERMATI, quindi non devi preoccuparti di questo! Ti avviserà e disegnerà un pu
Quantum Breakout Indicator PRO
Bogdan Ion Puscasu
4.96 (26)
Presentazione       Quantum Breakout PRO   , l'innovativo indicatore MQL5 che sta trasformando il modo in cui scambi le zone di breakout! Sviluppato da un team di trader esperti con un'esperienza di trading di oltre 13 anni,   Quantum Breakout PRO   è progettato per spingere il tuo viaggio di trading a nuovi livelli con la sua strategia innovativa e dinamica della zona di breakout. Quantum Breakout Indicator ti fornirà frecce di segnalazione sulle zone di breakout con 5 zone target di prof
PRO Renko System
Oleg Rodin
5 (24)
PRO Renko System è un sistema di trading altamente accurato appositamente progettato per il trading di grafici RENKO. Questo è un sistema universale che può essere applicato a vari strumenti di trading. Il sistema neutralizza efficacemente il cosiddetto rumore di mercato che consente di accedere a segnali di inversione accurati. L'indicatore è molto facile da usare e ha un solo parametro responsabile della generazione del segnale. Puoi facilmente adattare lo strumento a qualsiasi strumento
TrendDecoder Premium
Christophe, Pa Trouillas
5 (3)
Identificare i range e le prossime mosse probabili   |  Ottenere i primi segnali e la forza delle tendenze   |  Ottenere uscite chiare prima dell'inversione   |  Individuare i livelli di Fibo che il prezzo testerà Indicatore non tracciante e non ritardato - ideale per il trading manuale e automatizzato - adatto a tutti gli asset e a tutte le unità temporali Offerta limitata nel tempo >>   50% OFF Dopo l'acquisto, contattatemi su questo canale  per le impostazioni personalizzate. Versione   MT5 :
Currency Strength Wizard è un indicatore molto potente che ti fornisce una soluzione all-in-one per un trading di successo. L'indicatore calcola la potenza di questa o quella coppia forex utilizzando i dati di tutte le valute su più intervalli di tempo. Questi dati sono rappresentati in una forma di indice di valuta facile da usare e linee elettriche di valuta che puoi utilizzare per vedere il potere di questa o quella valuta. Tutto ciò di cui hai bisogno è collegare l'indicatore al grafico che
Trend Forecasting
Mohamed Hassan
5 (15)
This indicator is unstoppable when combined with our other indicator called Katana. After purchase, send us a message and you could get Katana for FREE as a BONUS After purchase, send us a private message for your instructions.  MT5 version: click here There are limited copies available at $55. Next price is $105. Don't miss this great deal!  The Trend Forecasting indicator is a very unique & easy tool that is able to make prediction about future price movement based on the signal
Advanced Currency IMPULSE with ALERT
Bernhard Schweigert
4.91 (493)
ATTUALMENTE SCONTATO DEL 31%! La soluzione migliore per ogni principiante o trader esperto! Questo indicatore è uno strumento di trading unico, di alta qualità e conveniente perché abbiamo incorporato una serie di caratteristiche proprietarie e una formula segreta. Con un solo grafico fornisce avvisi per tutte le 28 coppie di valute. Immaginate come migliorerà il vostro trading perché sarete in grado di individuare l'esatto punto di innesco di una nuova tendenza o opportunità di scalping!
FX Volume
Daniel Stein
4.6 (35)
Ricevi il tuo aggiornamento quotidiano sul mercato con dettagli e schermate tramite il nostro Morning Briefing qui su mql5 e su Telegram ! FX Volume è il PRIMO e UNICO indicatore di volume che fornisce una visione REALE del sentiment del mercato dal punto di vista del broker. Fornisce informazioni straordinarie su come gli operatori di mercato istituzionali, come i broker, sono posizionati sul mercato Forex, molto più velocemente dei rapporti COT. Vedere queste informazioni direttamente sul vo
Shepherd Harmonic Pattern
Abdullah Alrai
4.68 (59)
Questo indicatore rileverà modelli armonici disegnati sul grafico mediante metodi manuali e automatici. Puoi consultare il manuale dell'utente tramite questo link: Aggiungi la tua recensione e contattaci per ottenerlo. C'è una versione gratuita per provare questo prodotto su MT4. Puoi usarlo per rilevare i modelli di Gartley e Nenstar: https://www.mql5.com/en/market/product/30181 Puoi acquistare la versione completa di MT4 da: https://www.mql5.com/en/market/product/15212 Note L'indicatore ha un
TakePropips Donchian Trend Pro
Eric John Pajarillaga Aldana
4.82 (17)
TakePropips Donchian Trend Pro   (MT4) è uno strumento potente ed efficace che rileva automaticamente la direzione del trend utilizzando il canale Donchian e ti fornisce segnali di trading di entrata e uscita! Questo indicatore multifunzione include uno scanner di tendenza, segnali di trading, pannello statistico, screener, sessioni di trading e dashboard della cronologia degli avvisi. È progettato per fornirti segnali di trading e farti risparmiare ore analizzando i grafici! È possibile scarica
How to use Pair Trading Station Pair Trading Station is recommended for H1 time frame and you can use it for any currency pairs. To generate buy and sell signal, follow few steps below to apply Pair Trading Station to your MetaTrader terminal. When you load Pair Trading Station on your chart, Pair Trading station will assess available historical data in your MetaTrader platforms for each currency pair. On your chart, the amount of historical data available will be displayed for each currency pai
Market Structure Patterns MT4
Samuel Manoel De Souza
5 (15)
Market Structure Patterns   is an indicator based on   smart money concepts   that displays almost all of the   SMC/ICT   elements needed to take your trading decisions to the next level. Take advantage of the   alerts ,   push notifications   and   email messages   to keep informed from when an element is formed on the chart, the price crosses a level and/or enters in a box/zone. Developers can access the values of the elements of the indicator using the   global variables  what allows the aut
Altri dall’autore
Ti consiglio di leggere il       blog del prodotto   (manuale) dall'inizio alla fine in modo che       è chiaro fin dall'inizio cosa offre l'EA. La strategia principale di questo Expert Advisor (EA) è piazzare operazioni quando 3 medie mobili (MA) sono in allineamento consecutivo e ad una certa distanza l'una dall'altra (può essere utilizzata ad esempio per una strategia poco conosciuta utilizzata da alcuni trader istituzionali , che coinvolge le MA 10, 20 e 30 sulla fascia oraria D1). L'EA fun
Questo indicatore multi time frame e multi simbolo identifica formazioni alto/basso doppie o triple o un successivo breakout della scollatura (confermato alto/basso). Offre filtri RSI, pin bar, engulfing, tweezer, stelle del mattino/sera, nonché MACD, Awesome (AO) o filtri divergenza RSI che consentono di filtrare solo le configurazioni più forti.       L'indicatore può essere utilizzato anche in modalità grafico singolo. Si prega di leggere di più su questa opzione nel prodotto   blog .   Combi
I recommend you to read the   product's blog  (manual) from start to end so that it is clear from the beginning what the indicactor offers. This multi time frame and multi symbol indicator can identify the following 5 crosses: when a fast moving average crosses a slow moving average line. when price has reached a single moving average (closed above/below or just bounced). when a triple moving average formation has appeared (all 3 MA:s in consecutive alignment) when the MACD main line crosses th
The indicator identifies when a divergence occurs between price and an indicator or oscillator. It identifies both regular and hidden divergences. Combined with your own rules and techniques, this indicator will allow you to create (or enhance) your own powerful system. Features Can detect divergences for the following oscillators/indicators:   MACD, OsMA, Stochastics, RSI, CCI, RVI, Awesome, ADX, ATR, OBV, Composite index, MFI and Momentum. Only one oscillator/indicator can be selected. Draws
FREE
Questo indicatore del dashboard di divergenza multi time frame e multi simbolo invia un avviso quando una o due divergenze diverse sono state identificate su più time frame e non su singole divergenze. Può essere utilizzato con tutte le fasce orarie da M1 a MN. È possibile visualizzare contemporaneamente nella dashboard un massimo di 9 intervalli di tempo. È possibile abilitare il filtro di tendenza della media mobile, dell'RSI o delle bande di Bollinger per filtrare solo le configurazioni più f
Questo indicatore della zona di domanda e offerta disegna le zone sul grafico e invia avvisi quando il prezzo ha raggiunto o rotto una zona. È anche possibile utilizzarlo per essere avvisati di doppi cime/basse regolari invece che di zone. È possibile utilizzare filtri RSI, volume e divergenza per filtrare solo le configurazioni più potenti. Combinato con le tue regole e tecniche, questo indicatore ti consentirà di creare (o migliorare) il tuo potente sistema. Questo indicatore è per il trader p
Questo indicatore di tendenza multi time frame e multi simbolo invia un avviso quando è stata identificata una forte tendenza o inversione di tendenza. Può farlo selezionando di costruire il cruscotto usando Media mobile (singola o doppia (crossover MA)), RSI, bande di Bollinger, ADX, indice composito (Constance M. Brown), Awesome (Bill Williams), MACD (linea di segnale ), Heiken Ashi livellato, media mobile di Hull, crossover stocastici, attivatore di Gann HiLo e indice dinamico dei trader. Può
This multi time frame and multi symbol indicator scans for pin bars. Combined with your own rules and techniques, this indicator will allow you to create (or enhance) your own powerful system. Features Can monitor all symbols visible in your Market Watch window at the same time. Apply the indicator to just one chart and instantly monitor the entire market. Can monitors every time frame, from M1 to MN, and sends you a real-time alert when a pin bar is identified. All Metatrader native alert types
I  recommend you to read the   product's blog  (manual) from start to end so that it is clear from the beginning what the indicator offers. This multi time frame and multi symbol indicator identifies double top/bottom, head & shoulders, pennant/triangle and flag patterns. It is also possible to setup alerts only when a neckline/triangle/flagpole breakout has occured (neckline breakout = confirmed signal for top/bottoms and head & shoulders).  The indicator can also be used in single chart mode.
I recommend you to read the   product's blog  (manual) from start to end so that it is clear from the beginning what the indicactor offers. This multi time frame and multi symbol supply and demand zone dashboard indicator sends alerts when the price has reached a supply/demand zone. It is also possible to use it to be alerted about regular double tops/bottoms instead of zones. It can be used with all time frames from M1 to MN. It is possible to use RSI, divergence (MACD, OsMA, RSI or Awesome) a
Please if possible consider the  paid version  which I will continue to develop (there will be no future updates for this free version). This Expert Advisor identifies when a divergence occurs between price and an oscillator/indicator. It identifies both regular/classical (trend reversal) and hidden (trend continuation) divergences. It has RSI, bollinger, stochastics, moving average and ADX filter options which makes it possible to filter out only the strongest setups. The default settings ar
FREE
I  recommend you to read the   product's blog  (manual) from start to end so that it is clear from the beginning what the indicator offers. In addition to finding bullish and bearish Three line strike formations this multi symbol and mutli time frame indicator can also scan for the following candlestick patterns (please see screenshots for explanation of the patterns): Three white soldiers (reversal>continuation pattern) Three black crows (reversal>continuation pattern) The formations do not ap
Questo indicatore può inviare avvisi quando si verifica un cambiamento di colore Heiken Ashi Smoothed. Combinato con le tue regole e tecniche, questo indicatore ti permetterà di creare (o migliorare) il tuo potente sistema. Caratteristiche Può inviare tutti i tipi di avvisi. Possibilità di ritardare l'avviso di una o più barre per confermare il cambio colore (tendenza). Parametri di input Spostamento candela per avviso: l'impostazione predefinita è 1. Impostandolo su 0 ti avviserà del cambiament
FREE
Averaging down EA
Jan Flodin
5 (1)
This cost averaging Expert advisor (EA) places additional trades in the same direction as the original (manually opened) order when the price goes against you. It can be used as a grid system or as pure martingale system (exponential increasing of lot size) or smoothed martingale (for instance linear increasing of the lot size). Due to the risk involved, this EA is more suitable for intermediate to advanced traders who are well aware of how to handle risk management and trading an already profit
Ti consiglio di leggere il   blog (manuale) del prodotto   dall'inizio alla fine in modo che sia chiaro fin dall'inizio cosa offre EA. Questo Expert Advisor identifica quando si verifica una divergenza tra il prezzo e un oscillatore/indicatore. Identifica sia le divergenze regolari/classiche (inversione del trend) che quelle nascoste (continuazione del trend). Dispone di zona di domanda/offerta, RSI, bollinger, stocastico, media mobile (MA regolare e MA di Hull), ADX e opzioni di filtro del vol
Questo indicatore multi-time frame e multi-simbolo identifica i modelli doppio alto/basso, testa e spalla, gagliardetto/triangolo e bandiera. È anche possibile impostare avvisi solo quando si è verificato un breakout della scollatura/triangolo/asta della bandiera (breakout della scollatura = segnale confermato per la parte superiore/inferiore e testa e spalle).       L'indicatore può essere utilizzato anche in modalità grafico singolo. Si prega di leggere di più su questa opzione nel prodotto  
Questo indicatore può inviare avvisi quando si verifica un cambiamento di colore Heiken Ashi Smoothed. Combinato con le tue regole e tecniche, questo indicatore ti permetterà di creare (o migliorare) il tuo potente sistema. Caratteristiche Può inviare tutti i tipi di avvisi. Possibilità di ritardare di una barra l'avviso per confermare il cambio colore (tendenza). Parametri di input Attendi la chiusura della candela:       'vero o falso'. Impostandolo su 'true' ritarderà l'avviso all'apertura de
FREE
The indicator identifies when a divergence occurs between price and an indicator or oscillator. It identifies bullish and bearish hidden or regular (classical) divergences. Combined with your own rules and techniques, this indicator will allow you to create (or enhance) your own powerful system. Features Can detect divergences for the following indicators/oscillators: MACD, OsMA (Moving average of Oscillator), Stochastics, RSI, CCI, RVI, Awesome (AO), ADX, ATR, OBV, MFI, Momentum and   Composi
FREE
Questo indicatore multi time frame e multi simbolo identifica formazioni alto/basso doppie o triple o un successivo breakout della scollatura (confermato alto/basso). Offre RSI, pin bar, engulfing, tweezer, filtri a stella del mattino/sera e opzioni di filtro di divergenza che consentono di filtrare solo le configurazioni più forti.       L'indicatore può essere utilizzato anche in modalità grafico singolo. Si prega di leggere di più su questa opzione nel prodotto   blog .   Combinato con le tue
Questo indicatore riconosce un tipo speciale di formazione Inside Bar che è formata da una grande candela Master seguita da 4 candele più piccole (vedi la spiegazione della strategia di seguito). Caratteristiche Traccia le linee di stop di acquisto/vendita sul grafico, nonché i livelli di take profit e stop loss. I livelli TP/SL si basano sull'indicatore ATR (Average True Range). I colori degli oggetti sono modificabili. Ti invia un avviso in tempo reale quando viene identificata una formazione
I recommend you to read the   product's blog  (manual) from start to end so that it is clear from the beginning what the indicactor offers. This multi time frame and multi symbol divergence dashboard indicator sends an alert when one or two different divergences have been identified. It can be used with all time frames from M1 to MN. It is possible to enable moving average or RSI trend filter to filter out only the strongest setups. Combined with your own rules and techniques, this indicator wi
Features This is an indicator that recognizes a special type of Inside Bar formation which is formed by a Master candle followed by 4 smaller candles (please see the strategy explanation below). Plots buy/sell stop lines on the chart as well as well as take profit and stop loss levels. The TP/SL levels are based on the Average True Range (ATR) indicator. Object colors are changeable. Sends you a real-time alert when a Master candle formation is identified - sound / pop-up / email / push notifica
I recommend you to read the  product's blog  (manual) from start to end so that it is clear from the beginning what the indicator offers. This multi time frame and multi symbol supply and demand zone dashboard indicator sends alerts when the price has reached a supply/demand zone. It is also possible to use it to be alerted about regular double tops/bottoms instead of zones. It can be used with all time frames from M1 to MN. Maximum 9 time frames can be shown in the dashboard at the same time. 
L'indicatore identifica quando si verifica una divergenza tra il prezzo e un oscillatore/indicatore. Identifica divergenze regolari e nascoste. Ha un'opzione di filtro RSI che consente di filtrare solo le configurazioni più potenti. L'indicatore offre anche opzioni per attendere una formazione Engulfing, un breakout del canale Donchian o che il prezzo superi una media mobile   (vedi screenshot n. 3)       per confermare la divergenza prima di segnalare l'opportunità commerciale. Combinato con le
Questo indicatore multi time frame e multi simbolo può identificare le seguenti 5 croci: quando una media mobile veloce attraversa una linea di media mobile lenta. quando il prezzo ha raggiunto una singola media mobile (chiusa sopra/sotto o rimbalzata). quando è apparsa una formazione a media mobile tripla (tutti e 3 i MA:s in allineamento consecutivo). quando la linea principale MACD attraversa la linea di segnale. quando la linea del segnale attraversa la linea MACD zero (0). Combinato con le
Per favore, se possibile, considera l'acquisto del       Versione MT5   che continuerò a sviluppare (non ci saranno aggiornamenti futuri per questa versione MT4). Ti consiglio anche di leggere il       blog del prodotto   (manuale) dall'inizio alla fine in modo che sia chiaro fin dall'inizio cosa offre EA. La strategia principale di questo Expert Advisor (EA) è quella di piazzare operazioni quando 3 medie mobili (MA) sono in allineamento consecutivo e ad una certa distanza l'una dall'altra (può
L'indicatore identifica quando si verifica una divergenza tra il prezzo e un oscillatore/indicatore. Identifica divergenze sia rialziste che ribassiste. Ha un'opzione di filtro RSI che consente di filtrare solo le configurazioni più forti. L'indicatore offre anche opzioni per attendere un breakout del canale Donchian o che il prezzo attraversi una media mobile (vedi screenshot n. 3) per confermare la divergenza prima di segnalare l'opportunità commerciale. Combinato con le tue regole e tecniche,
Questo indicatore multi time frame e multi simbolo esegue la scansione di barre pin, stelle del mattino/sera, engulfing, pinzette, colpi a tre linee, barre interne e gagliardetti e triangoli.   L'indicatore può essere utilizzato anche in modalità grafico singolo. Si prega di leggere di più su questa opzione nel prodotto   blog .   Combinato con le tue regole e tecniche, questo indicatore ti consentirà di creare (o migliorare) il tuo potente sistema. Caratteristiche Può monitorare contemporaneam
This multi time frame and multi symbol indicator scans for Pin bars, Morning/Evening stars, Engulfings, Tweezers, Three line strikes, Inside bars and Pennants and Triangles. The indicator can also be used in single chart mode. Please read more about this option in the product's blog . Combined with your own rules and techniques, this indicator will allow you to create (or enhance) your own powerful system. Features Can monitor all symbols visible in your Market Watch window at the same time. Ap
Questo indicatore multi time frame e multi simbolo identifica quando la linea del segnale stocastico attraversa la linea principale stocastica. Come bonus può anche eseguire la scansione delle bande di Bollinger e dei cross RSI ipercomprato/ipervenduto. Combinato con le tue regole e tecniche, questo indicatore ti permetterà di creare (o migliorare) il tuo potente sistema. Caratteristiche Può monitorare contemporaneamente tutti i simboli visibili nella finestra Market Watch. Applica l'indicatore
Filtro:
FiBiGoal
20
FiBiGoal 2020.08.02 10:46 
 

Excellent product, works as described, very good contact with a friendly creator, thank you Jan. Imho one of the best developers here.

Jorge
36
Jorge 2020.04.13 21:12 
 

Excellent indicator. Purchased in october 2.019. Works perfect, lots of filters. Very happy with it.

Ke Huang
691
Ke Huang 2019.10.16 11:09 
 

I purchased the indicator today,when I use it for a while, I will evaluate its effect again, but it is worth mentioning that the author's technical support is very powerful, and I will give five stars to this point.

Dmitry Karagusov
804
Dmitry Karagusov 2019.03.05 07:46 
 

Indicator like: a lot of different filters for conservative and aggressive trading, multi-timeframe, can scan one pair and maybe all, does not load the processor. Quality product. Responsive author.

Lev Vladimirovic Marushkin
1636
Lev Vladimirovic Marushkin 2018.12.22 16:13 
 

L'utente non ha lasciato alcun commento sulla valutazione.

iman
300
iman 2018.11.27 08:34 
 

I have got to say, I regret buying divergence indicator from ex-Wall Street guy that does not have push notification alert, it costed me more than double too! This is because that guy has more reviews than you. Yours however is much controlable and has hidden divergence feature However, what I am about to say next could be a good idea for you to develop. For now, I have to set each indicator in a single chart to see if three of them give the same divergence warning either hidden or regular on various designated timeframe however just another idea is if you can make them detect each divergence individually and put up some kinda table with all of the wanted pair as the top row and timeframe as the column for a defined set of RSI, CCI, MACD, Stoch, etc. (I know, too many will clutter the chart). When divergence occur it will populate the appropriate pair and which time frame it occurs and whether hidden or regular. The existing extra in the chart is excellent touch which the ex-Wall Street guy divergence probably didn't think of that. Here you can make some sort of log to say that this warning on this pair occur 5,10, 60,235 minutes ago. Now, user then can scan the table and check how long the warning is while in a glance user can see if each oscillator agrees to the divergence and in which time frame. I know someone else has built the oscillator indicator with those table however theirs do not consider divergence, just crossing line in overbought/oversold line. That's my 2 cent, however it is still a great indicator.

4example
245
4example 2018.02.23 23:56 
 

Hands down. one of the best coders. And one of the best products. It literally sifted my work from analyzing and searching to just visually confirming my strategies. Tones of hours saved.The developer is very fast in responding to any queries and ready to help. THANK YOU!

rafaelmercadop
139
rafaelmercadop 2018.01.18 11:39 
 

Great indicator and the programmer is always available to listen and help you. And as some other review here posted, this indicator is a time saver!

[Eliminato] 2017.12.18 11:31 
 

L'utente non ha lasciato alcun commento sulla valutazione.

fabbry72
1354
fabbry72 2017.11.01 22:01 
 

Very good indicator to catch divergence.

Jan is always one of the best developer on MQL5.

Rispondi alla recensione
Versione 2.9 2023.03.30
*** Please always make a backup of the existing indicator (the .ex4 file) before you make the update ***

Change log:
- added an option to write the signals as global variables instead of to a file
- added a possibility to use the indicator in single chart mode (checking only the current chart symbol and time frame). This option is in some ways limited though. More information in the product's blog
- added the possibility to set the colors in the panel
- added the possibility to set a custom alert text
- added the possibility to set a custom panel title
Versione 2.8 2020.11.02
*** Please always make a backup of the existing indicator (the .ex4 file) before you make an update ***

- bug fix in the pinbar filter
- added the possibility to enable the MA trend filter separately for regular and hidden divergences
Versione 2.7 2020.09.13
*** Please always make a backup of the existing indicator (the .ex4 file) before you make an update ***

- I have changed the logic of detecting divergences so that more divergences will be detected. The new logic will allow divergences even if there are additional indicator extremums (top/bottoms) between the 2 already existing extremum points.
Versione 2.6 2020.06.04
- upon request I have added the possibility to scan for "early" divergences. This means that the alert will come directly upon candle open instead of waiting for the slope in the indicator to change direction (candle shift 1 or 2). Candle shift must be set to 0 for this to work. Please be aware though that this will lead to more false signals.
Versione 2.5 2019.11.11
- added the possibility to write the signals in the panel to a file. Could for instance be used by an Expert Advisor for automatical trading. For instance this product: https://www.mql5.com/en/market/product/43512
Versione 2.4 2019.10.29
- added support for a second (fast) MA when using the MA trend filter
- added the possibility to use the RSI filter on first, second or both extremums
- added Bollinger bands filter as an alternative to the RSI filter
- added MFI, Momentum, Composite Index and MACD histogram (main line) divergences
Versione 2.3 2019.09.11
- added scanning for OBV, ADX and ATR divergences
- added ADX filter
- added the possibility to select a specific time frame for the RSI filter
- added the option to use the RSI filter also on all lower time frames
- added an option to use divergence strict mode for close price levels. Please see the first screenshot under the product description
- added a filter option for setting a minimum price close level for the last extremum (divergence) candle. Please see the second screenshot under the product description.
Versione 2.2 2019.02.17
- added an option to use symbols from the Market Watch window instead of the symbols written in the Symbols parameter
- added the possbility to use separate RSI filter values for hidden divergences
Versione 2.1 2019.02.08
- added a possibility to use stochastics overbought/oversold filter for stochastics divergences
- added the possibility to set which stochastics price field to use (Low/High or Close/Close)
Versione 2.0 2018.11.26
- added the possibility to set the divergence depth used for scanning
- it will now be possible to set the candle shift where to search for the last extremum
- improved support for the strategy tester
- overall performance improvements
Versione 1.9 2018.05.18
- correted an issue with absence of alerts on the D1 time frame under some circumstances
Versione 1.8 2018.05.14
- added support for strategy testing
- added possibility to set the width of the panel
Versione 1.7 2018.04.19
- corrected the RSI logic for regular divergences
- added the possibility to use a custom sound file for alerts
Versione 1.6 2018.04.06
- corrected the alert time in the panel
- added possibility to use a custom chart template when opening a chart from the panel
Versione 1.5 2018.02.16
- added price level to the on-screen, push and mail alerts
- added time of divergence alert to the panel
Versione 1.4 2018.01.12
- bug fix in the Awesome oscillator
Versione 1.3 2017.12.29
- added MA filter option
Versione 1.2 2017.12.22
- Added the Awesome oscillator
- Possibility to disable scanning for regular divergences
- Possibility to disable the panel
Versione 1.1 2017.09.19
- added pinbar/engulfing filters