Heiken Ashi Smoothed Alert
- Indicatori
-
Jan Flodin
 Hello, my name is Jan and I have been developing automated trading tools for the last 9 years. I am originally from Sweden but have lived in the Czech Republic since 2003.
PRODUCTS - Versione: 1.0
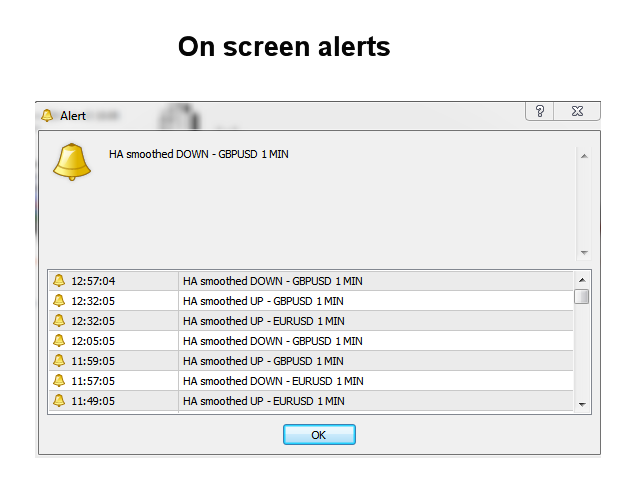
Questo indicatore può inviare avvisi quando si verifica un cambiamento di colore Heiken Ashi Smoothed. Combinato con le tue regole e tecniche, questo indicatore ti permetterà di creare (o migliorare) il tuo potente sistema.
Caratteristiche
- Può inviare tutti i tipi di avvisi.
- Possibilità di ritardare di una barra l'avviso per confermare il cambio colore (tendenza).
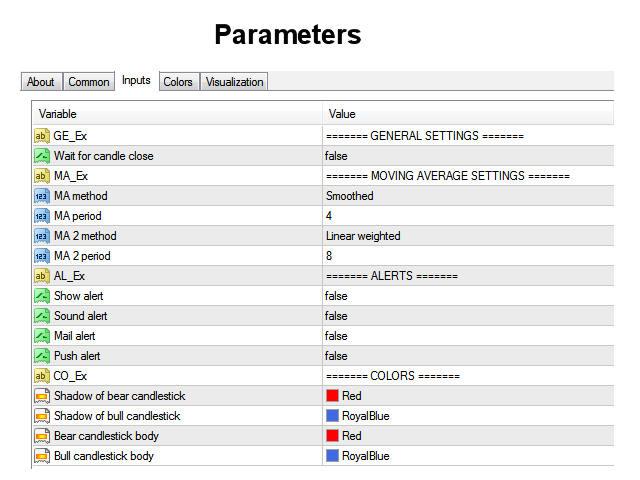
Parametri di input
- Attendi la chiusura della candela: 'vero o falso'. Impostandolo su 'true' ritarderà l'avviso all'apertura della barra successiva alla barra in cui si è verificato il cambio di colore.
- Metodo MA: L'impostazione predefinita è Smoothed (SMMA).
- Periodo MA: Il valore predefinito è 4.
- Metodo MA 2: l'impostazione predefinita è Linear Weighted (LWMA).
- Periodo MA 2: Il valore predefinito è 8.
- Avvisi: Imposta su "vero" per ogni tipo di avviso che desideri ricevere.
- Colori: imposta i colori per le barre e le ombre Heiken Ashi Smoothed (stoppini).


total super