TXBeeBox Statistics Panel
- Utilità
- Versione: 1.2
- Attivazioni: 5

Here is the English translation of the product description, formatted for clarity and easy reading:
The TXBeeBox Statistics Panel is an account and trading performance visualization and statistics tool designed for MetaTrader 5.
When an account simultaneously trades multiple symbols, runs multiple EAs, or uses a mix of automated and manual trading, simply viewing the MT5 order list often makes it difficult to quickly grasp the overall performance. This panel organizes scattered account and trading data into clear curves, statistical tables, and categorized views. It helps traders review their trading performance from multiple dimensions, including the account, timeframes, trading symbols, and Magic IDs.
The panel supports an account overview, real-time positions, multi-timeframe performance summaries, symbol statistics, Magic ID strategy statistics, and account information viewing. In a single interface, users can observe account fund status, historical profit and loss (P&L) changes, trading lot size changes, win rates, profit/loss ratios, holding times, and the results of different strategies.
Note: This product is positioned as a data statistics and visual analysis tool. It does not provide trading signals, nor does it guarantee any trading results.
Key Features
-
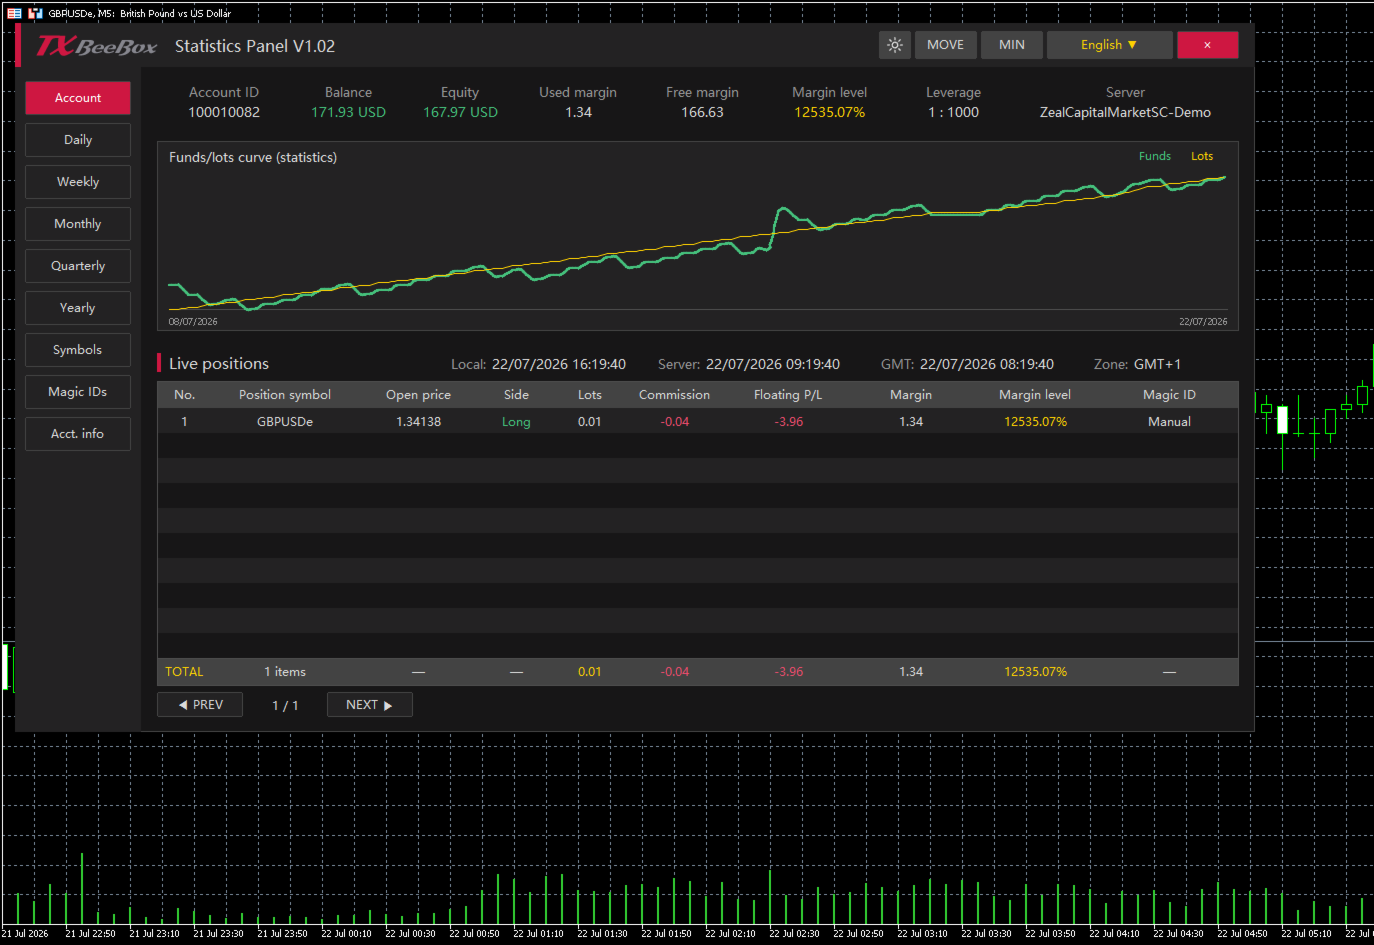
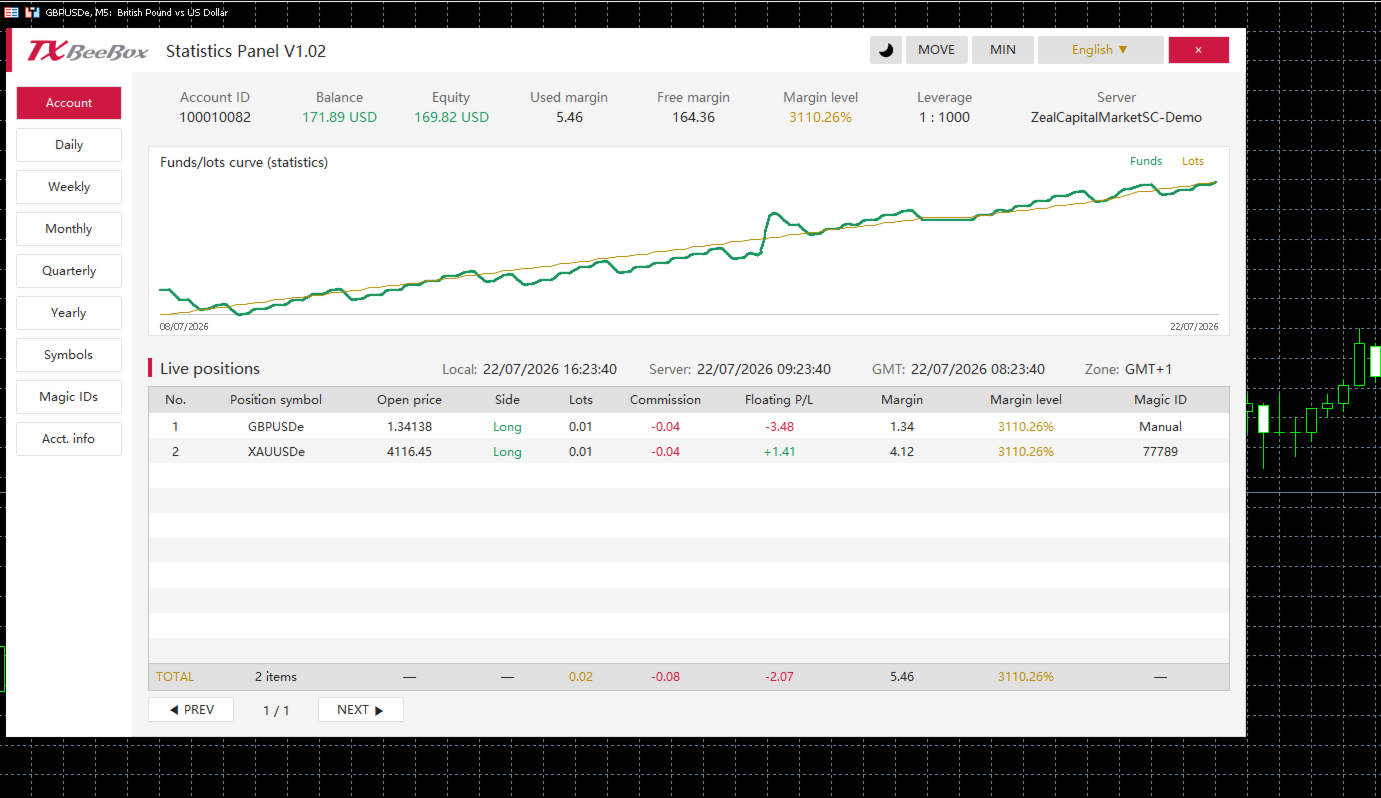
Key Account Data: Displays account balance, equity, used margin, free margin, margin level, leverage, and the trading server.
-
Real-Time Position Monitoring: Displays trading symbol, open price, buy/sell direction, lots, commission, floating P&L, used margin, margin level, and Magic ID.
-
Funds and Lots Curves: Plots fund or P&L changes against trading lot size changes on the same timeline, making it easy to compare trading volume with account performance.
-
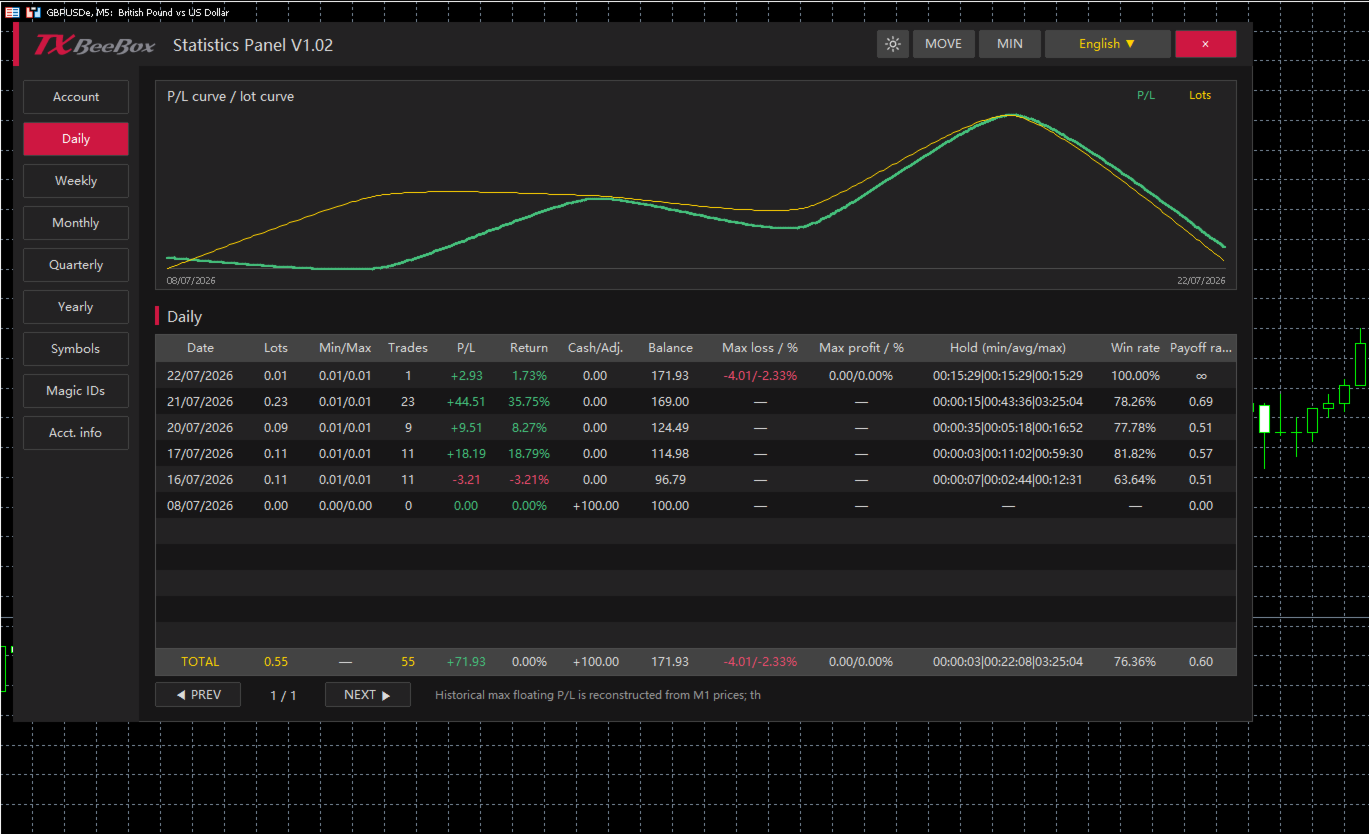
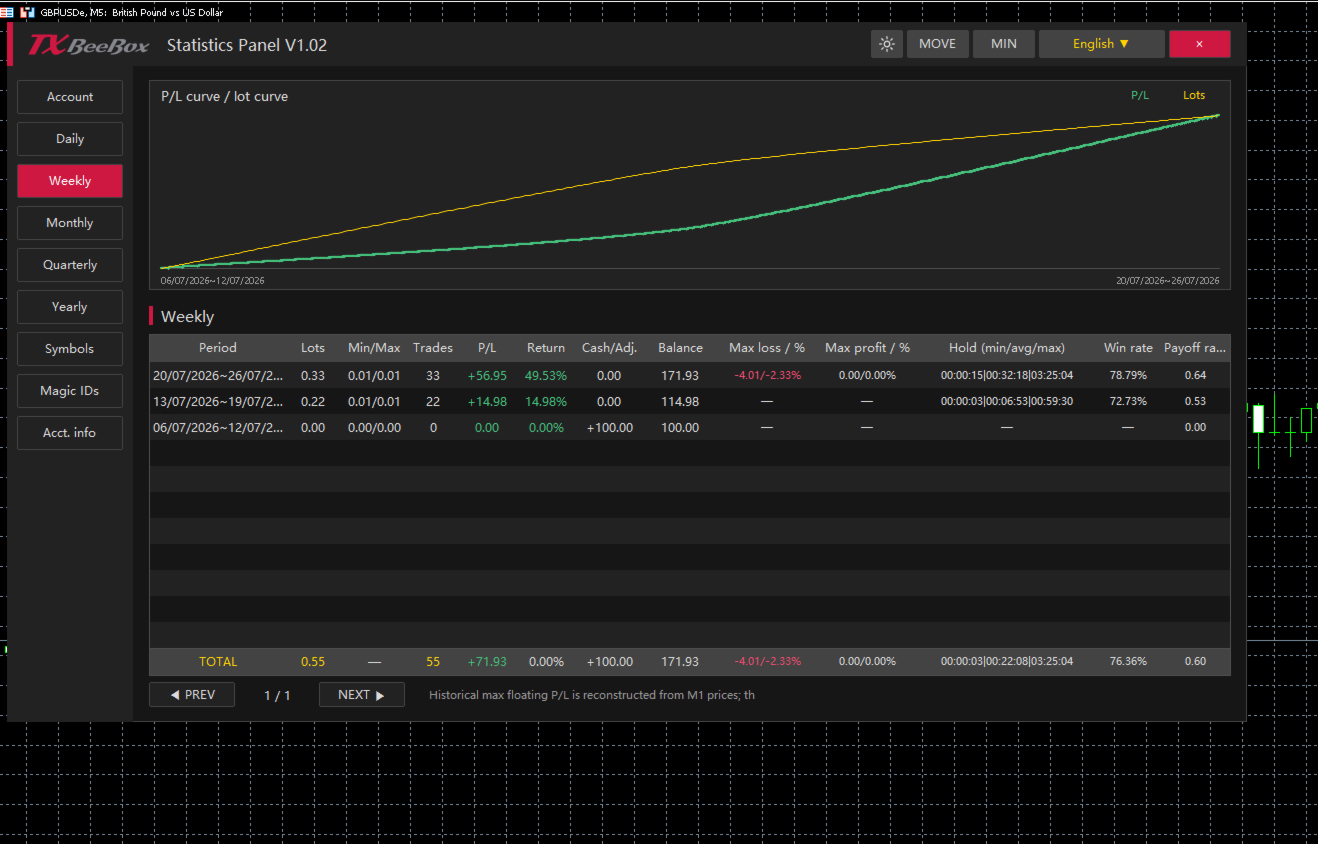
Multi-Timeframe Statistics: Supports summarizing historical trading data by day, week, month, quarter, and year.
-
Symbol Statistics: Analyzes the contribution of different markets to account results based on the trading symbol.
-
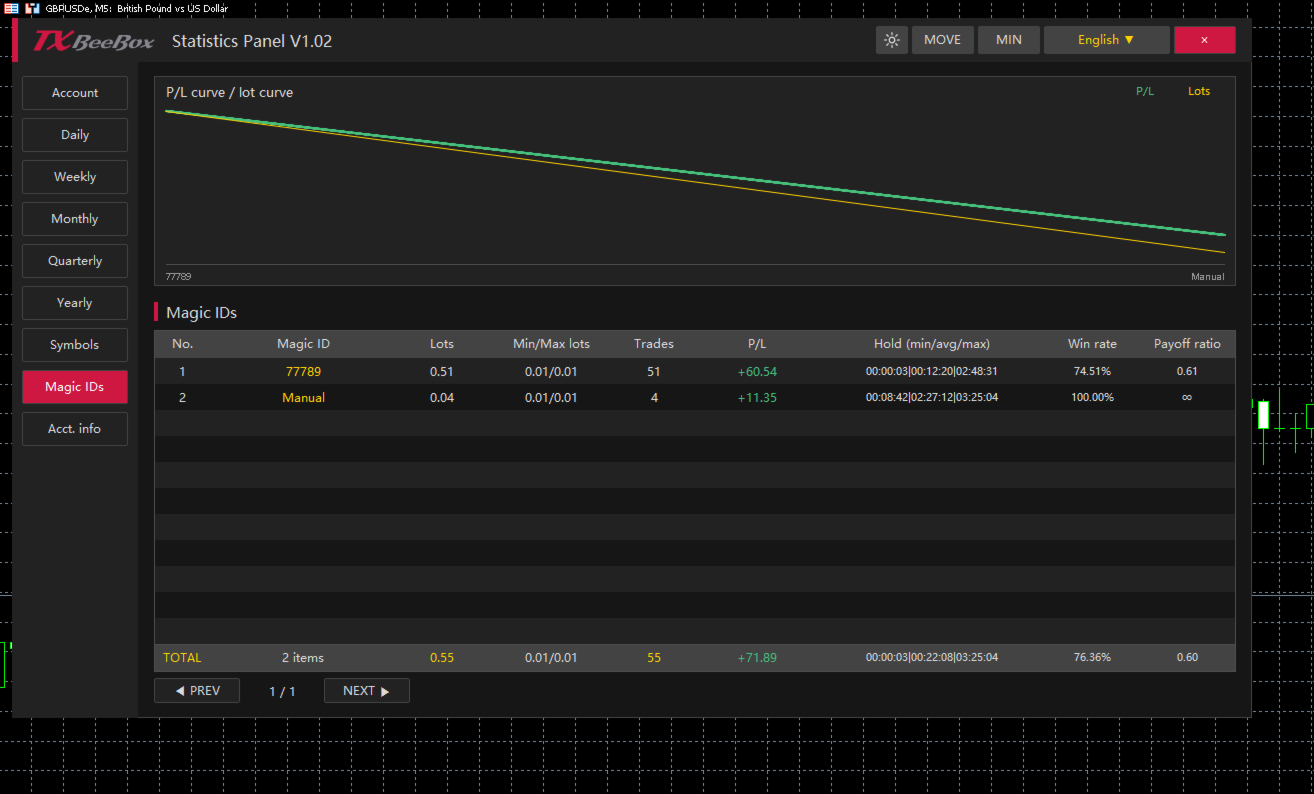
Magic ID Statistics: Separately calculates the performance of different EAs, strategies, and manual trades.
-
Risk and Efficiency Indicators: Provides data such as return rate, maximum floating profit, maximum floating loss, win rate, profit/loss ratio, and holding times.
-
Dark and Light Themes: Allows users to switch display styles based on the chart background or personal preference.
-
Panel Controls: Supports moving, minimizing, closing, language selection, and table pagination.
-
Multi-Timezone Display: Simultaneously displays local time, server time, GMT time, and the current timezone.
Account Overview
The Account page centrally displays the primary fund data for the current account:
-
Account ID: Trading account number
-
Balance: Account balance
-
Equity: Account equity
-
Used margin: Used margin
-
Free margin: Free margin
-
Margin level: Margin level
-
Leverage: Account leverage
-
Server: Trading server
The account page also includes the funds/lots curve and a real-time position table. The TOTAL row at the bottom of the table summarizes the current number of positions, total lots, total commissions, floating P&L, and margin data.
Multi-Timeframe Performance Statistics
The Daily, Weekly, Monthly, Quarterly, and Yearly pages share a consistent statistical structure, summarizing trading performance by trading day, calendar week, calendar month, quarter, and year, respectively.
For each period, you can view:
-
Cumulative trading lots
-
Minimum and maximum single-trade lot sizes
-
Number of trades
-
Period P&L
-
Period return rate
-
Deposits, withdrawals, or balance adjustments
-
End-of-period balance
-
Maximum floating loss and its percentage
-
Maximum floating profit and its percentage
-
Minimum, average, and maximum holding times
-
Win rate
-
Profit/Loss ratio
Users can first review the Yearly, Quarterly, or Monthly pages to understand long-term trends, and then use the Weekly and Daily pages to pinpoint specific changes.
Symbols and Magic ID Statistics
The Symbols page aggregates data by trading symbol, making it ideal for accounts trading multiple currency pairs, gold, indices, or other markets simultaneously. Users can compare trading volumes, P&L, win rates, profit/loss ratios, and holding times across different symbols.
The Magic IDs page categorizes statistical data based on order Magic IDs. Since different EAs typically use different Magic IDs, you can individually review each strategy's:
-
Cumulative lots
-
Minimum and maximum trading lots
-
Number of trades
-
P&L results
-
Minimum, average, and maximum holding times
-
Win rate
-
Profit/Loss ratio
The Manual category in the panel is used to separately group manual trades, making it easy to compare the performance of EA (automated) trading against manual trading.
How to Use
-
Find the TXBeeBox Statistics Panel in the MT5 Navigator and attach it to any chart.
-
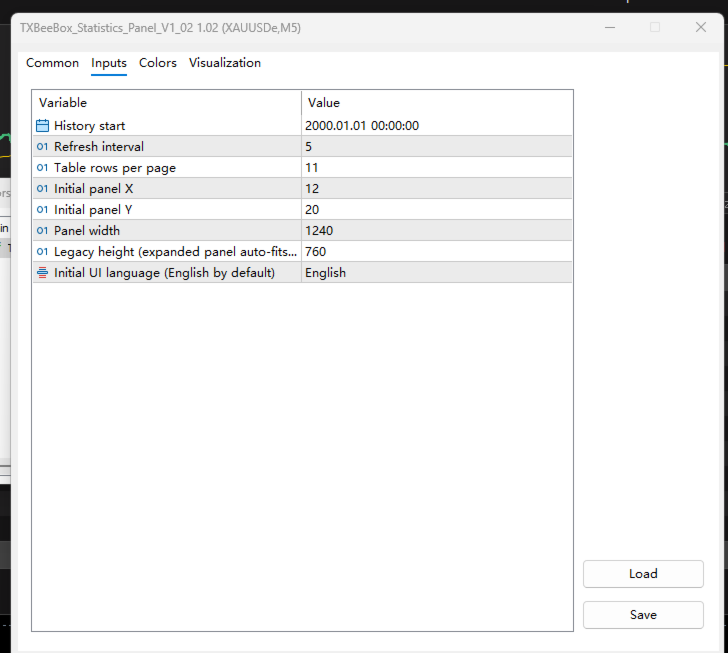
Set your preferences, including the history start time, refresh interval, rows per page, panel position, and panel width.
-
Open the Account page to view your account status, funds curve, and real-time positions.
-
Use the Daily, Weekly, Monthly, Quarterly, and Yearly pages to review your performance across multiple timeframes.
-
Use the Symbols and Magic IDs pages to determine the contribution of specific trading symbols, EAs, or manual trades to your overall account results.
-
Switch between light and dark themes to match your chart background.