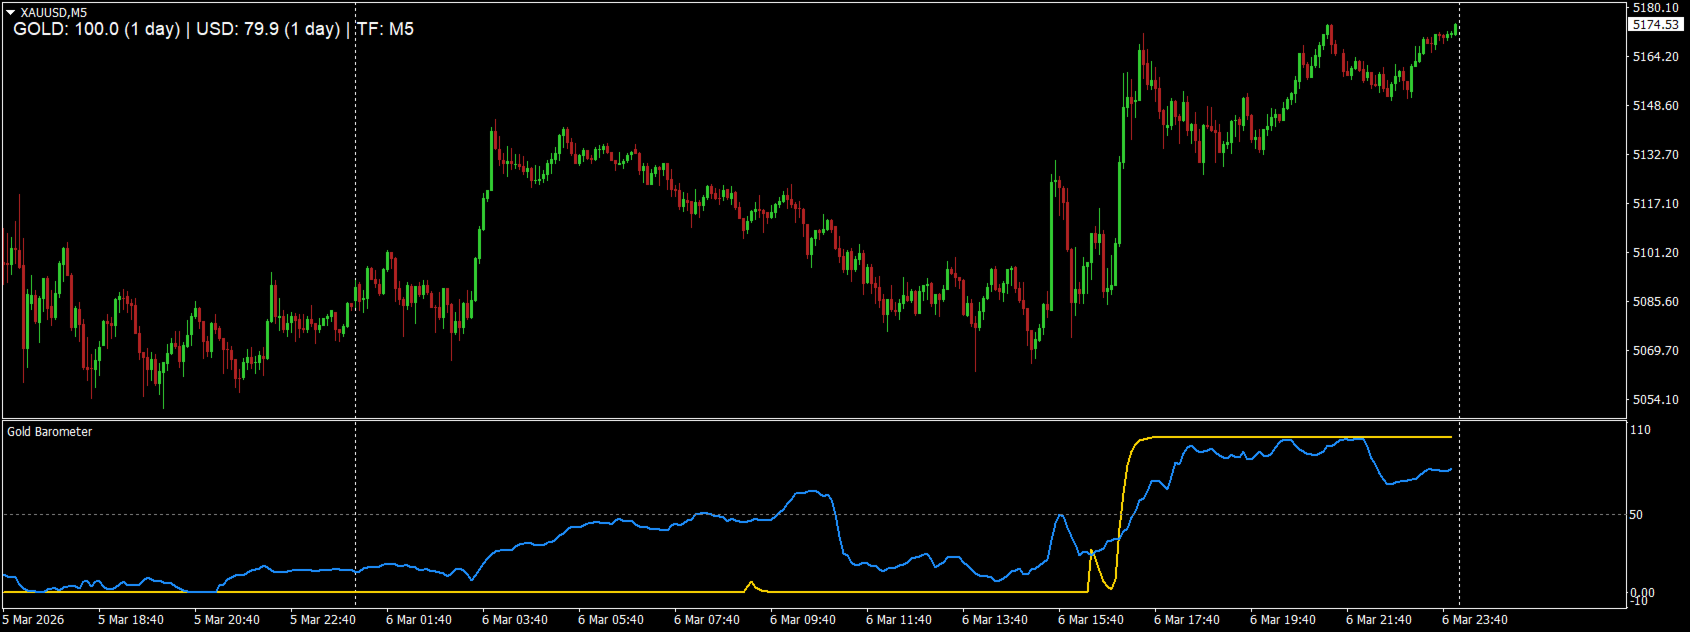
Gold Barometer
- Indicatori
- Versione: 1.0
- Attivazioni: 5

Gold Barometer is a dual-line strength indicator that measures relative momentum between Gold (XAUUSD) and the US Dollar. It calculates percentage change over a flexible lookback period (minutes, hours, or days), converts it into a normalized 0–100 strength scale, and smooths it with EMA filtering for cleaner signals.
The gold line reflects XAUUSD performance over the selected lookback.
The USD line is derived from a basket (EURUSD, GBPUSD, AUDUSD, USDJPY, USDCHF, USDCAD), giving a broader view of dollar strength. Values above 50 indicate bullish pressure; below 50 indicate weakness. The 50 level acts as a neutral equilibrium line.
Because the current forming candle is excluded, signals are based on closed bars, improving reliability and reducing noise.
How to Use
1. Trend Confirmation (Primary Use)
-
Gold above 50 and USD below 50 → bullish bias on XAUUSD.
-
Gold below 50 and USD above 50 → bearish bias.
The wider the gap between the two lines, the stronger the directional conviction.
2. Cross Strategy
-
Gold crossing above USD → potential upward momentum shift.
-
Gold crossing below USD → potential downside momentum shift.
Best used with price structure or breakout confirmation.
3. Divergence Insight
If price makes new highs but Gold strength fails to rise, upside momentum may be fading. The same applies inversely for lows.
4. Multi-Timeframe Alignment
Use higher timeframe lookback (e.g., 1 day) for macro bias, and shorter lookback for timing entries.
Practical Tip:
When both lines hover near 50 and move sideways, market conditions are balanced—avoid forcing trades. Strong separation combined with price breaking structure often signals expansion phases.
This tool works best as a directional filter within a structured trading system rather than a standalone entry trigger.