Bitcoin Barometer
- Indicatori
- Pieter Gerhardus Van Zyl
- Versione: 1.0
- Attivazioni: 5
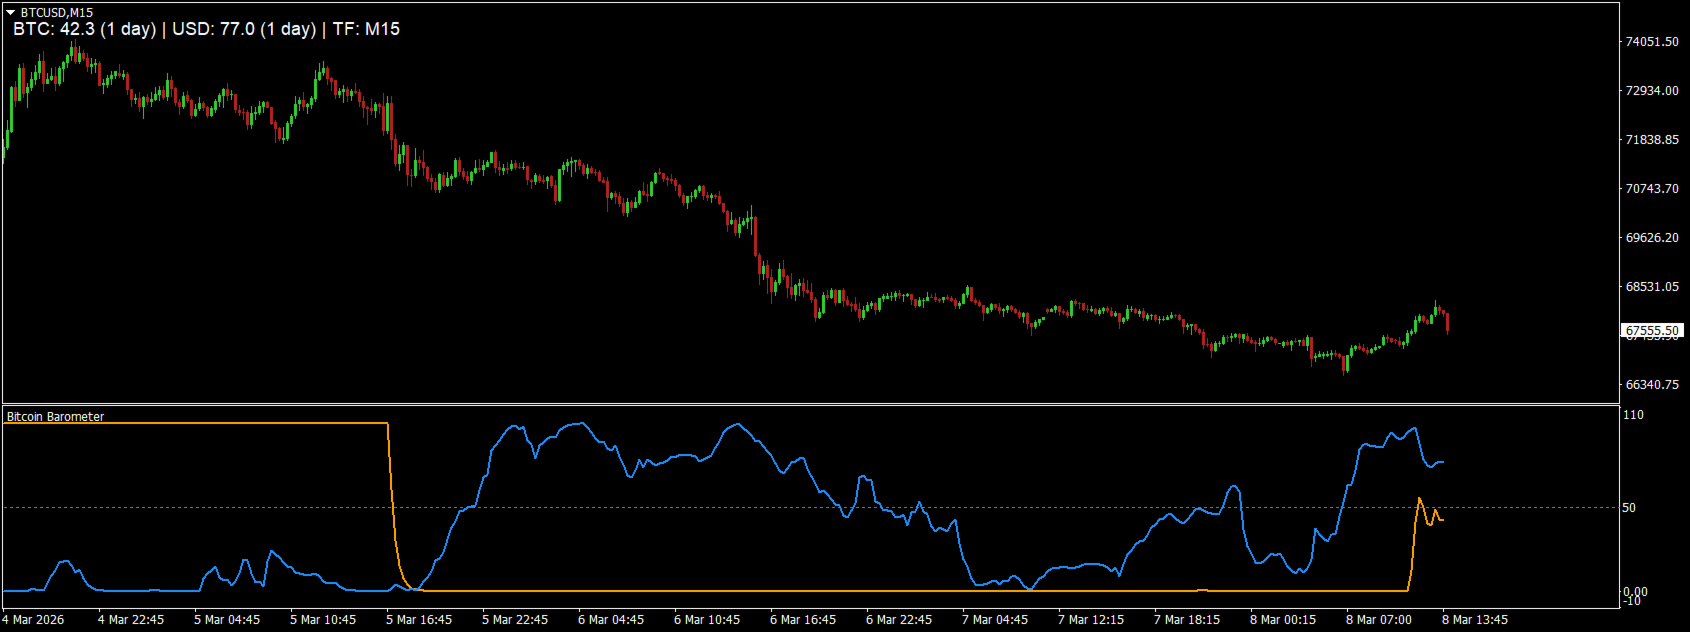
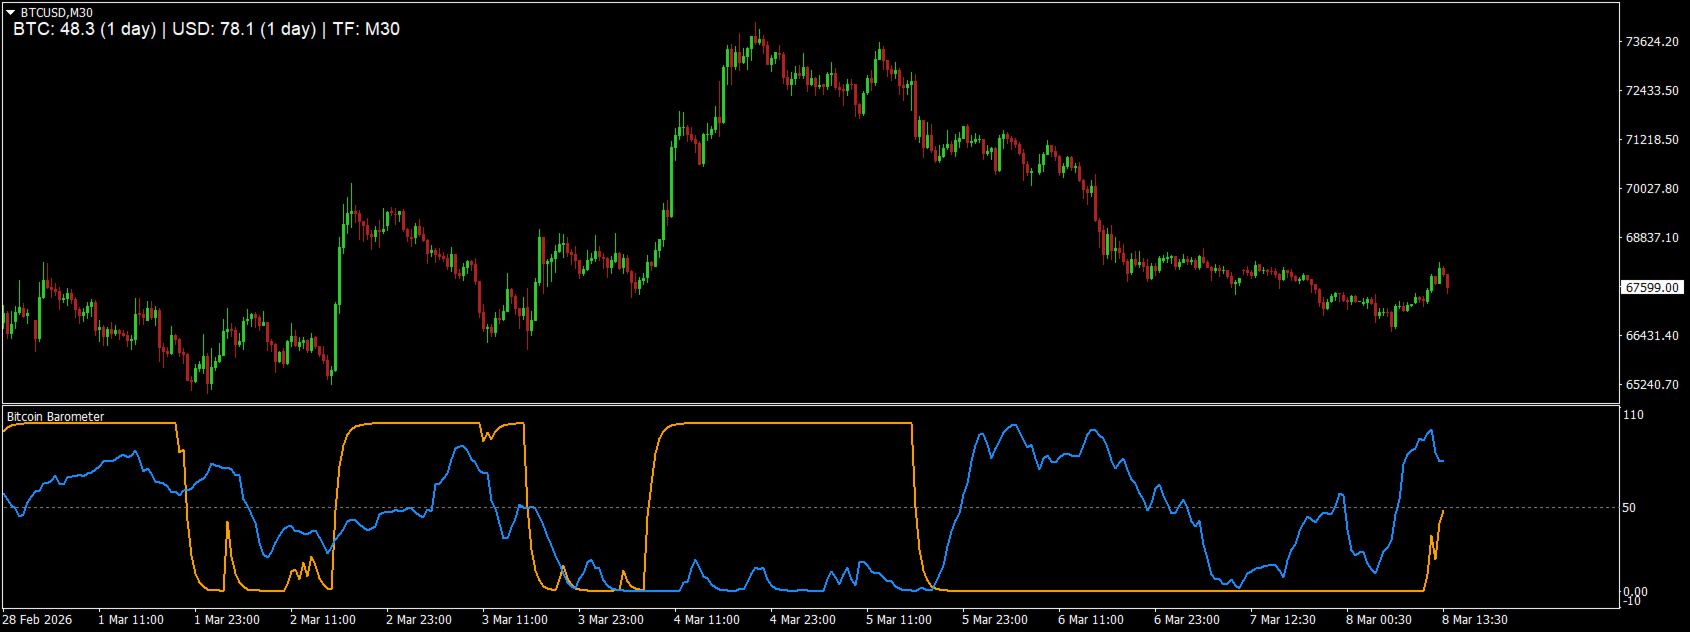
Bitcoin Barometer is a dual-strength oscillator designed to measure the relative momentum of Bitcoin versus the US Dollar in one clear view. It plots two smoothed lines in a separate window: BTC Strength (orange) and USD Strength (blue), both normalized on a 0–100 scale with a central equilibrium level at 50.
The indicator calculates percentage return over a customizable lookback period (minutes, hours, or days), then converts that return into a strength score. USD strength is derived from a basket of major pairs (EURUSD, GBPUSD, AUDUSD, USDJPY, USDCHF, USDCAD) to provide a broader view of dollar pressure rather than relying on a single pair. Both lines are smoothed using EMA logic to reduce noise while keeping responsiveness. The current forming candle is excluded, ensuring values are based on completed bars only.
How to Use
1. Above / Below 50
-
Above 50 = bullish pressure
-
Below 50 = bearish pressure
If BTC is above 50 while USD is below 50, bullish Bitcoin conditions are strengthening.
If USD is above 50 while BTC is below 50, downside pressure on Bitcoin is increasing.
2. Crossovers
When BTC Strength crosses above USD Strength, momentum favors Bitcoin.
When USD Strength crosses above BTC Strength, dollar dominance is increasing.
3. Divergence Behavior
If price rises but BTC Strength weakens, momentum may be fading.
If price falls while USD Strength drops, selling pressure may be losing force.
4. Lookback Optimization
Short lookbacks suit intraday trading.
Longer lookbacks help identify broader macro bias.
Used correctly, the Bitcoin Barometer acts as a momentum compass, helping you align trades with the dominant force driving BTCUSD.