SR Volume Map MT4
- Indicatori
- Part-time Day Trader
- Versione: 1.0
- Attivazioni: 15
SR Volume Map displays a clear support and resistance heatmap based on traded volume. It highlights key price areas where price is more likely to react.
The tool serves as a visual guide for planning trade entries, stops, and targets using volume-based structure.
Designed for both beginner and advanced traders, SR Volume Map indicates where trading activity is concentrated and helps create clearer, more structured trade plans.
Works on all symbols and timeframes.
How SR Heatmap Works
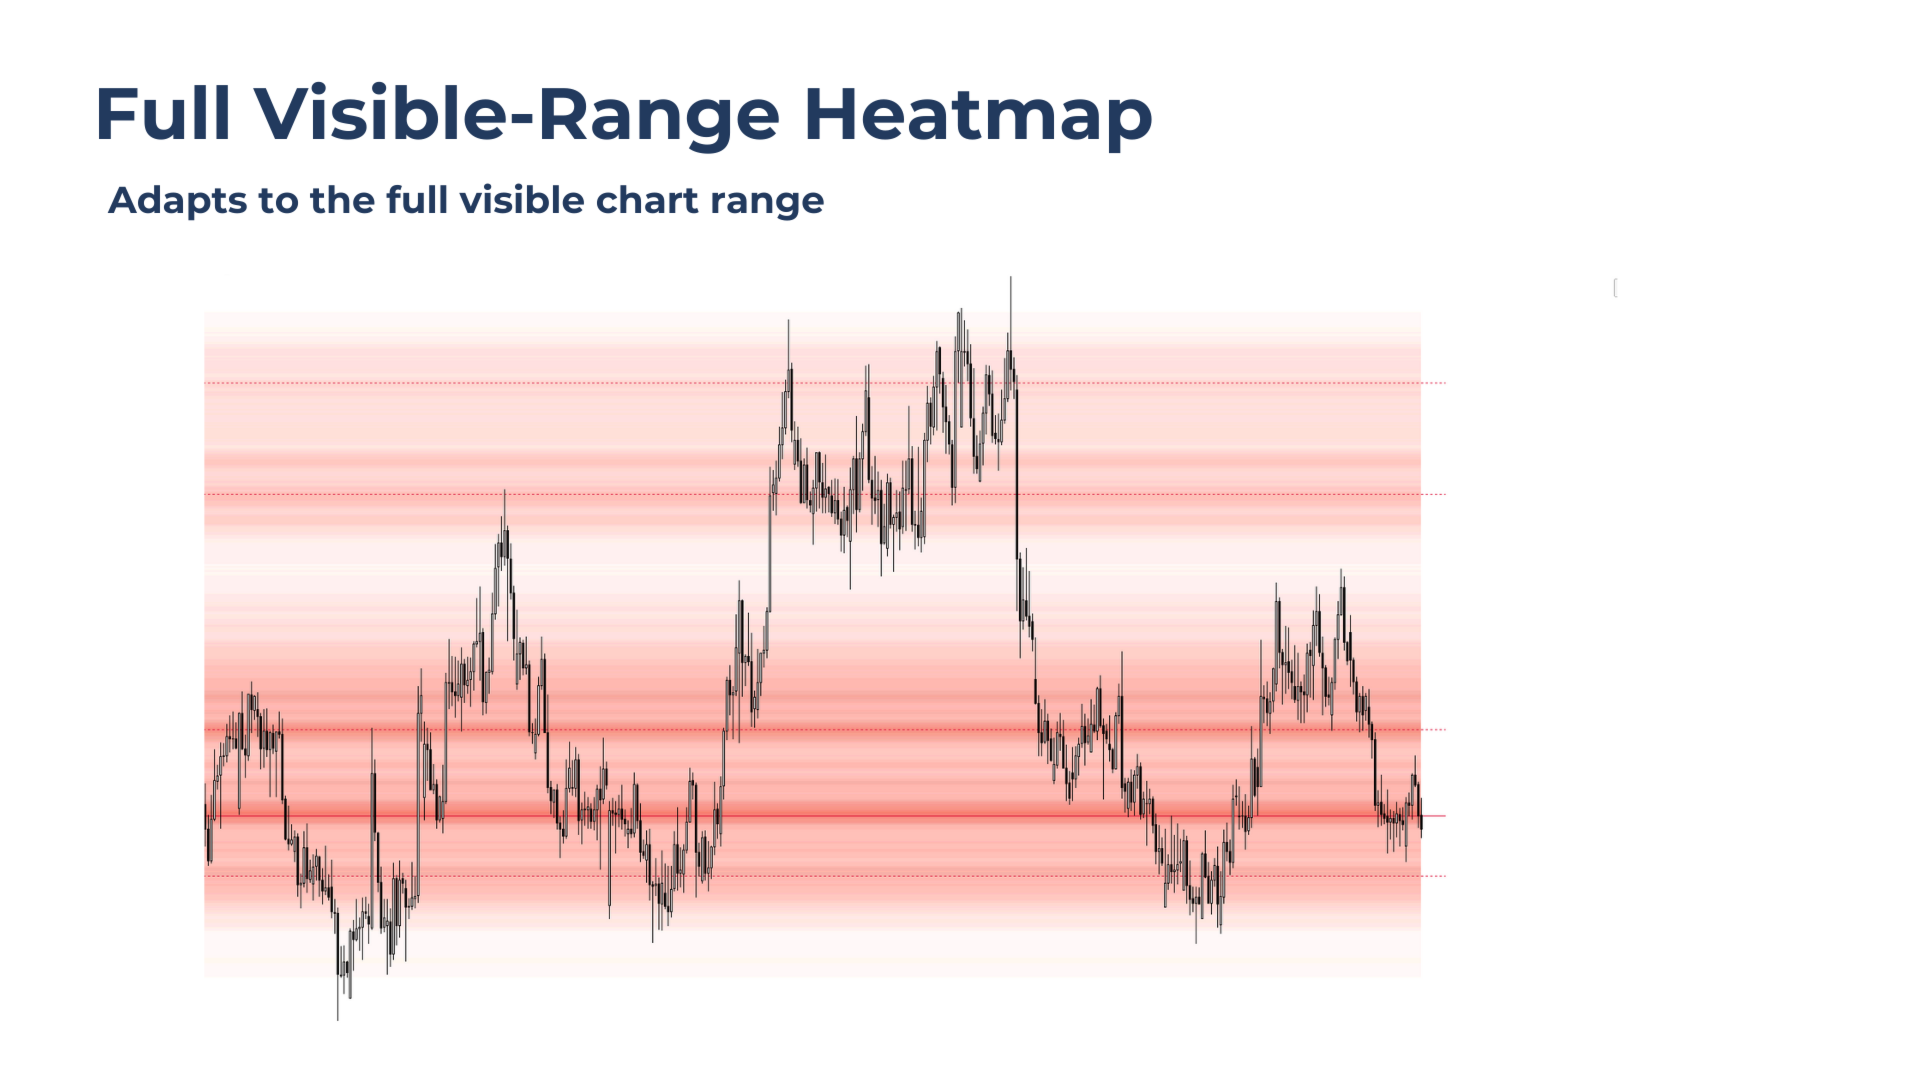
SR Volume Map analyzes recent price action and measures traded volume across different price levels. This data is visualized as a heatmap directly on the chart.
Brighter or more intense areas highlight price levels with higher trading activity. These levels often function as support or resistance, as they previously attracted significant market participation.
Key Features
- Volume-based heatmap of support and resistance zones
- Full range or local volume mapping
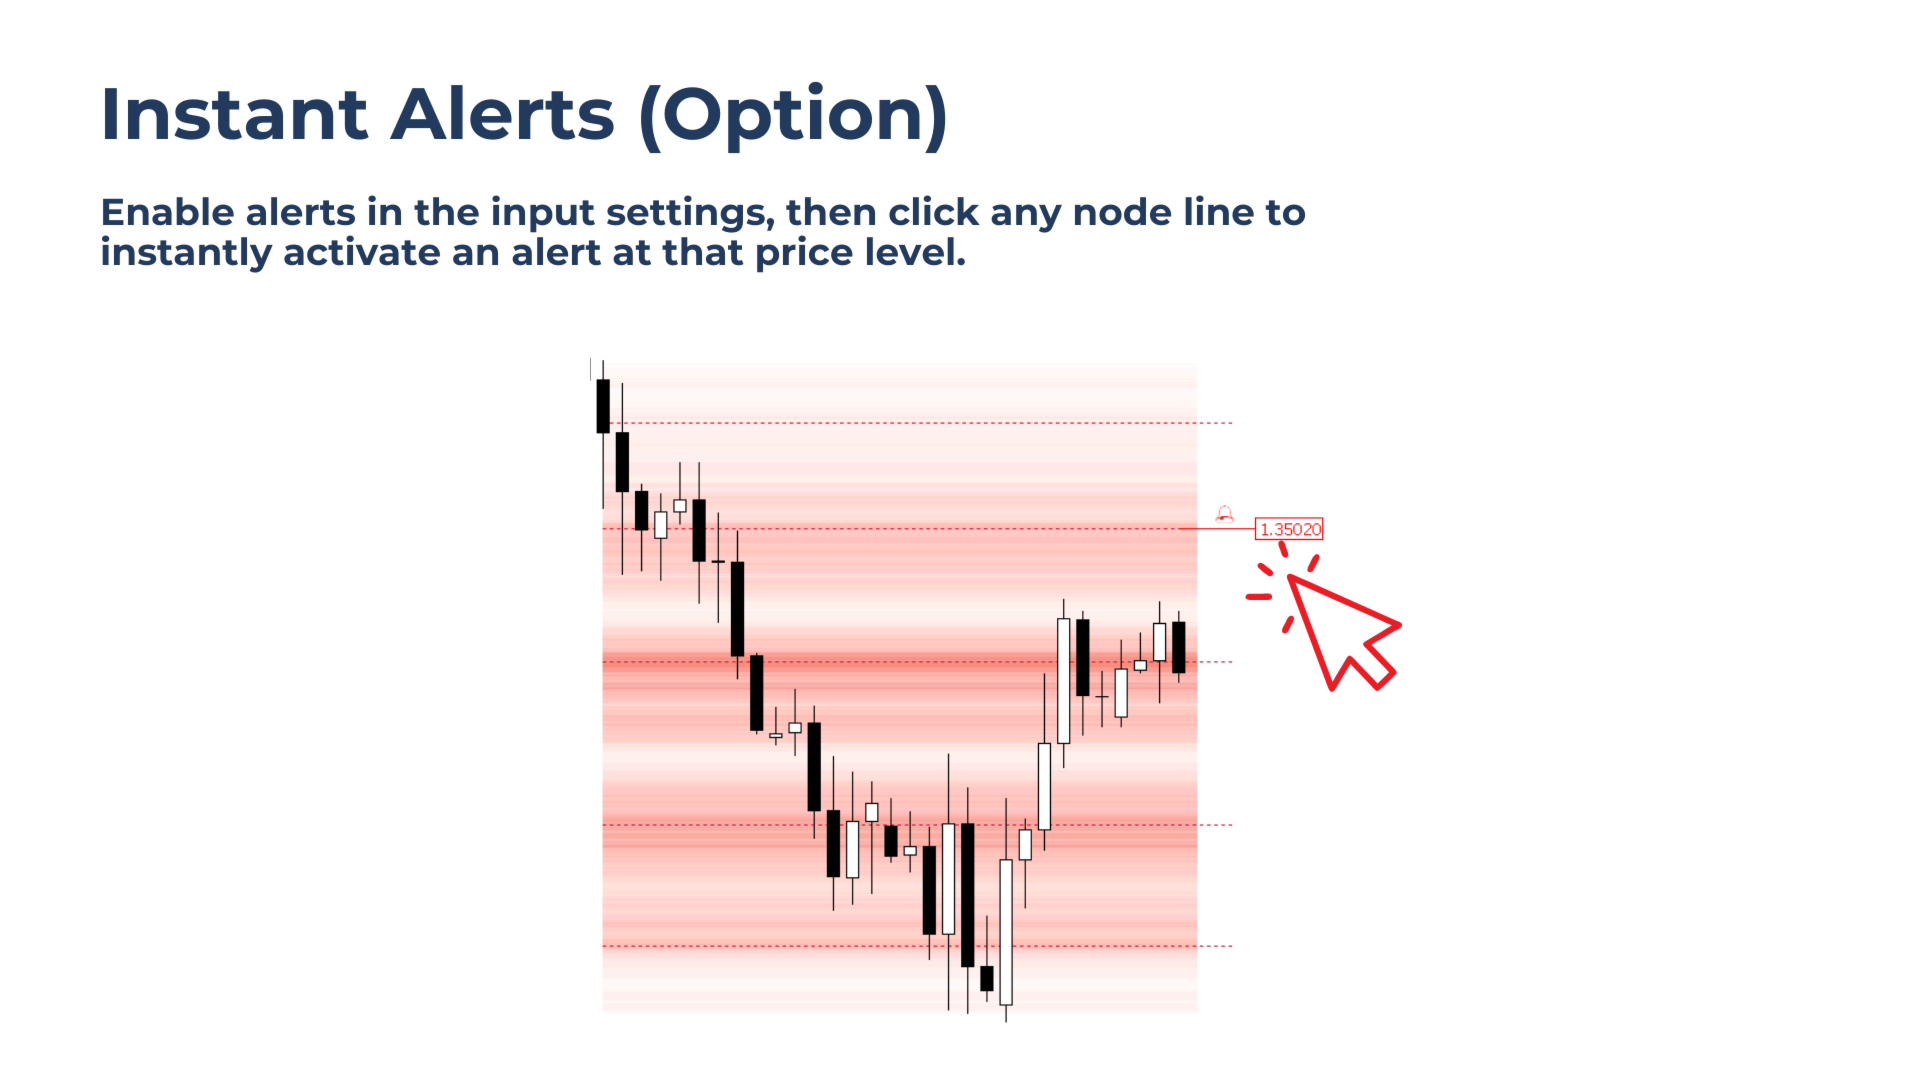
- Instant level alerts (by clicking node lines)
- Customizable colors
- Show / hide option
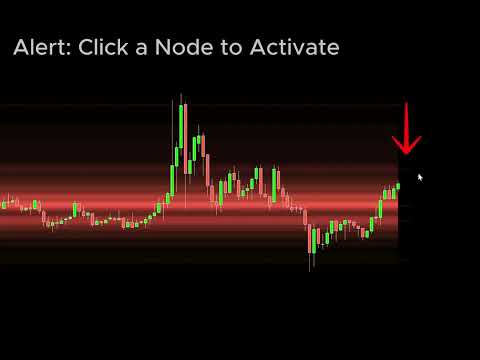
On-Click Alerts
When enabled in the input settings, the tool provides a simple on-click alert system. Clicking a node line places an instant alert on that specific price level and triggers a notification when price is reached.
On-click alerts offer a faster, more practical alternative to the built-in MetaTrader alert system and allow monitoring price levels without constant screen watching.
Alerts are bound to price levels, not to the visual nodes used to activate them, and automatically clear when the chart timeframe is changed.
Always at Hand
SR Volume Map supports simple, structured trade planning by providing clear, volume-based context for entries, stop-loss placement, and targets.
To avoid unnecessary chart clutter, use the corner button to show or hide the volume map.
SR Volume Map is not supported in the Strategy Tester.