Multi Andrew PitchFork

5
ANDREW’S PITCHFORK TRADING STRATEGY

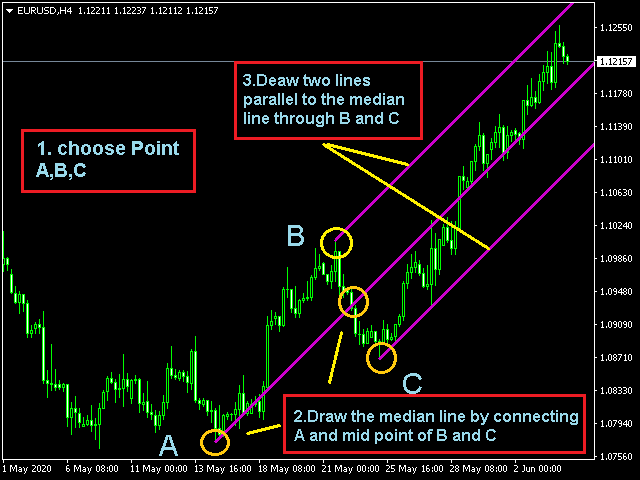
      Essentially, Andrew’s Pitchfork is a tool for drawing price channels. While two lines surrounding price are usually enough to draw a channel, the Pitchfork has an extra line. It is the median line or the handle of the Pitchfork.

    The median line is central to this trading method. This is why Andrew’s Pitchfork is also known as the Median Line Method.

TRADING RULES 

    There are many ways to trade using Andrew’s Pitchfork but the basic idea is that price will oscillate around the median line. In this version, we will focus on trading the first re-test of the limiting median line.

LONG TRADE

  1. Draw a bull channel with Andrew’s Pitchfork
  2. Wait for price to fall and test the lower median line
  3. No bar high should be lower than the lower median line
  4. Buy a tick above the high of a bull bar at the lower median line

SHORT TRADE

  1. Draw a bear channel with Andrew’s Pitchfork
  2. Wait for price to rise and test the upper median line
  3. No bar low should be higher than the upper median line
  4. Sell a tick below the low of a bear bar at the upper median line


Recensioni 1
Frank Paetsch
7501
Frank Paetsch 2020.09.11 14:59 
 

good indicator. Thank you

Prodotti consigliati
Questo indicatore funziona con la teoria delle onde di Elliott in due modi: Modalità automatica: In questa modalità, l'indicatore rileverà automaticamente le cinque onde motrici sul grafico in conformità alla teoria delle onde di Elliott. Fornirà previsioni e individuerà potenziali zone di inversione. Inoltre, avrà la capacità di generare avvisi e messaggi push per informare i trader sugli sviluppi importanti. Questa funzionalità automatica semplifica il processo di identificazione e analisi dei
Binary Options Support Resistance Indicator This indicator is designed for binary options trading and effectively shows retracements from support and resistance levels. Signals appear on the current candle. A red arrow pointing downwards indicates a potential selling opportunity, while a blue arrow pointing upwards suggests buying opportunities. All that needs adjustment is the color of the signal arrows. It is recommended to use it on the M1-M5 timeframes as signals are frequent on these timef
ADX Pointer
Dominik Mandok
ADX Pointer is an indicator which is based on "Average Directional Index" and draws three numbers in chart window depending on the value of ADX. In ADX Pointer you can set "ADX_Period" which is of course period of Average Directional Index and you can also set 3 levels. When ADX value exceed first level ("ADX_Level1") in chart window appears number "1", when ADX exceed second level ("ADX_Level2") appears "2" and when ADX exceed third level ("ADX_Level3") appears "3". Simple. ADX Pointer works on
The new update makes this indicator a complete tool for studying, analyzing and operating probabilistic patterns. It includes: On-chart Multi-asset percentage monitor. Configurable martingales. Twenty-one pre-configured patterns , including Mhi patterns and C3. An advanced pattern editor to store up to 5 custom patterns. Backtest mode to test results with loss reports. Trend filter. Hit operational filter. Martingale Cycles option. Various types of strategies and alerts. Confluence between patte
"The Squeeze indicator attempts to identify periods of consolidation in a market. In general the market is either in a period of quiet consolidation or vertical price discovery. By identifying these calm periods, we have a better opportunity of getting into trades with the potential for larger moves. Once a market enters into a "squeeze," we watch the overall market momentum to help forecast the market direction and await a release of market energy." The StdATR Squeeze Channel combines standard
The CCI Divergence is a reasonably useful indicator in itself, but it is even more effective when used with divergence pattern trading. The CCI Divergence indicator signal is one of the most potent signals among the indicators that exist in the market. Here is new version for Divergence Indicator using CCI method, with more improvements. Divergences indicate a potential investment point because the directional moment does not confirm the price. A bullish divergence occurs when the underlying va
Alpha Trend sign has been a very popular trading tool in our company for a long time. It can verify our trading system and clearly indicate trading signals, and the signals will not drift. Main functions: Based on the market display of active areas, indicators can be used to intuitively determine whether the current market trend belongs to a trend market or a volatile market. And enter the market according to the indicator arrows, with green arrows indicating buy and red arrows indicating se
Mean Reversion Probability indicator is a tool based on a mathematical theory of mean reversion . As the markets very often shows the behavior of diverging from its mean, up to a certain distance, and then start to converge its mean again. This is a very well known phenomenon in stochastic processes and the price series is also a stochastic variable so we apply certain mathematical and statistical procedures to estimate the turning point . Using Mean Reversion indicator, traders could potentiall
PABT Pattern Indicator - it's classical system one of the signal patterns. Indicator logic - the Hi & Lo of the bar is fully within the range of the preceding bar, look to trade them as pullback in trend. In the way if indicator found PABT pattern it's drawing two lines and arrow what showing trend way.  - First line - it's entry point and drawing at: 1. On the high of signal bar or on middle of the signal bar (depending from indicator mode) for buy; 2. On the low of signal bar or on middle of t
Elliott Wave Trend was designed for the scientific wave counting. This tool focuses to get rid of the vagueness of the classic Elliott Wave Counting using the guideline from the template and pattern approach. In doing so, firstly Elliott Wave Trend offers the template for your wave counting. Secondly, it offers Wave Structural Score to assist to identify accurate wave formation. It offers both impulse wave Structural Score and corrective wave Structure Score. Structural Score is the rating to sh
Dear traders this is Our new Indicator called Hull Pro MTF Indicator — Precision Multi-Timeframe Trend Visualizer Overview The Hull Pro MTF Indicator is a next-generation Heiken-Ashi-based multi-timeframe visual tool designed for top-down market analysis . It blends the power of Hull Moving Average (HMA) logic and multi-level Heiken-Ashi smoothing to reveal directional bias, volatility ranges, and price symmetry across hourly, daily, weekly, monthly, and yearly structures — all in a single c
The indicator detects and displays 3 Drives harmonic pattern (see the screenshot). The pattern is plotted by the extreme values of the ZigZag indicator (included in the resources, no need to install). After detecting the pattern, the indicator notifies of that by a pop-up window, a mobile notification and an email. The indicator highlights the process of the pattern formation and not just the complete pattern. In the former case, it is displayed in the contour triangles. After the pattern is com
The   RSI Divergence + FVG Signal   indicator combines   Relative Strength Index (RSI) Divergence   with   Fair Value Gap (FVG)   detection to generate high-probability buy and sell signals based on both momentum shifts and institutional imbalance zones. Core Features: RSI Divergence Detection : Identifies both regular and hidden bullish/bearish divergences between price and RSI. Divergences indicate potential trend reversals or continuation. FVG Zone Recognition : Detects Fair Value Gaps (imbal
The   Fibonacci Confluence Toolkit   is a technical analysis tool designed to help traders identify potential price reversal zones by combining key market signals and patterns. It highlights areas of interest where significant price action or reactions are anticipated, automatically applies Fibonacci retracement levels to outline potential pullback zones, and detects engulfing candle patterns. Its unique strength lies in its reliance solely on price patterns, eliminating the need for user-define
ZLMA Trend Candles indicator uses an enhanced Zero-Lag Moving Average to highlight key trend shifts, repainting candles in real time. It reacts faster than traditional moving averages, helping you spot potential market turns earlier. Gain clear entry and exit signals and filter out market noise with ease! This product is also available for MetaTrader 5 =>  https://www.mql5.com/en/market/product/129278 1. What Is ZLMA Trend Candles? ZLMA Trend Candles is a MetaTrader 4/5 indicator based on the Z
First Dawn
Innovicient Limited
The First Dawn indicator uses a unique mechanism to search and plot signals. This keeps searching for signals, making it a great indicator for scaping and identification of changes in direction, swing trading and trend trading. The  First Dawn   helps you get early signals. The backtest gives the true picture of how the indicator works with real/demo accounts. Although this is a tiny indicator it is packed with advantageous settings that will help you whether you desire to: Snap the Peaks and
TradeZones Fibonacci Pro – Zone Fibonacci dinamiche e avvisi di trading intelligenti Individua automaticamente le zone chiave di inversione utilizzando Fibonacci. Affina con precisione i tuoi ingressi. TradeZones Fibonacci Pro è un indicatore professionale che traccia automaticamente i livelli di Fibonacci più rilevanti sul tuo grafico, identificando potenziali zone di acquisto e vendita basate su un periodo configurabile. Grazie a un’interfaccia intuitiva, avvisi integrati e un pratico pulsa
"The Squeeze indicator attempts to identify periods of consolidation in a market. In general the market is either in a period of quiet consolidation or vertical price discovery. By identifying these calm periods, we have a better opportunity of getting into trades with the potential for larger moves. Once a market enters into a "squeeze," we watch the overall market momentum to help forecast the market direction and await a release of market energy." Modified TTM Squeeze Indicator is a modifica
Indicatore Crypto_Forex HTF Ichimoku per MT4. - L'indicatore Ichimoku è uno degli indicatori di tendenza più potenti. HTF significa - Higher Time Frame. - Questo indicatore è eccellente per i Trend Trader e anche in combinazione con le voci Price Action. - L'indicatore HTF Ichimoku consente di collegare Ichimoku da un timeframe più elevato al grafico corrente. - Trend rialzista: linea rossa sopra quella blu (ed entrambe le linee sono sopra la nuvola) / Trend ribassista: linea rossa sotto quell
Bollinger Trend Lines – MT4 & MT5 Bollinger Trend Lines   is a professional volatility-based trend indicator designed to clearly identify trend direction and dynamic stop levels using Bollinger Bands. Fuses on one core principle: follow the trend, ignore noise, and let volatility define the stop. How it works The indicator builds   trailing trend lines   using Bollinger Bands: In an   uptrend , the   lower band trails price and can only rise In a   downtrend , the   upper band trails pri
Trend Scanner is a trend indicator that helps to determine the current and forecast market direction using an advanced algorithm. Thanks to flexible alert settings, the indicator will promptly warn you about a trend reversal. The indicator is intuitive and easy to use, and will be an excellent filter in your trending trading strategies. The lines of this indicator are also an excellent dynamic level for stop loss, and is used as one of the types of trailing stop in Trading Panel . To fine-tune t
VR Cub
Vladimir Pastushak
VR Cub è un indicatore per ottenere punti di ingresso di alta qualità. L'indicatore è stato sviluppato per facilitare i calcoli matematici e semplificare la ricerca dei punti di ingresso in una posizione. La strategia di trading per la quale è stato scritto l'indicatore ha dimostrato la sua efficacia per molti anni. La semplicità della strategia di trading è il suo grande vantaggio, che consente anche ai trader alle prime armi di commerciare con successo con essa. VR Cub calcola i punti di apert
Questo indicatore rileverà i pattern armonici disegnati sul grafico tramite metodi manuali e automatici. Aggiungi la tua recensione, per favore. Note: Questo indicatore ha un pannello di controllo e salverà ogni impostazione (grafico e timeframe). Puoi ridurlo per avere più spazio sul grafico e puoi premere il pulsante di chiusura per nascondere tutti i dati dell'indicatore sul grafico se preferisci lavorare con altri strumenti di analisi. Quando utilizzi questo indicatore e modifichi le imposta
Over Trend MT4
Mansour Babasafary
Trend based indicator Identify trends with this indicator A simple-to-use trend indicator No complicated settings Attributes: Can be used in all symbols Can be used in all time frames Relatively high signals No complicated settings Specific to the trend Lifetime support Settings: Alarm Show Alert: By activating these settings, after receiving the signal, you will receive an alarm in Metatrader Alarm Show Notification: By activating these settings, after receiving the signal, you will receive a
Questo strumento software è progettato per semplificare il processo di creazione di linee di tendenza orizzontali e rettangoli nella scelta di cinque colori personalizzabili. Disegnare linee di tendenza orizzontali precise in MT5 può essere impegnativo, ma con questo indicatore puoi crearle senza sforzo nei colori che si adattano alle tue preferenze. Inoltre, il nostro strumento fornisce una chiara visualizzazione dei livelli di prezzo associati alle linee orizzontali tracciate. Apprezziamo
Are you tired of channeling? This indicator is designed to draw channels. Triple graphics channels, automatically installs 3 different graphics channels. These channels are shown on a single graphic. These channels are calculated by a number of different algorithms. Automatically draws on the screen. You can select three time zones. Parameters Period1 - from here you can select the first period. It can be selected from 1 minute time period to monthly time period. Period1_Channel_Color - period1
Teoria delle Onde di Elliott Automatizzata 1. Conteggio automatico e riduzione della soggettività Onde d'Impulso (1-2-3-4-5): Usa regole rigide per mostrare la struttura corretta. Onde Correttive (A-B-C): Aiuta a trovare opportunità di rientro nel trend. 2. Analisi Multi-Grado Analizza 3 livelli: Minor: Movimenti rapidi. Intermediate: Trend principale. Primary: Quadro generale. 3. Obiettivi di prezzo e Ingresso Proiezione di Fibonacci: Calcola i target futuri. Linee di Breakout: Mostra dove ent
STRUCTURAL TREND LINES - MT4 Indicator Simple indicator that automatically draws trend lines based on market structure. Features: - 3 degrees of structure detection (short, medium, long term) - Configurable swing strength for each degree - Single color per degree for clean visualization - Adjustable number of lines per degree - Customizable colors and line widths How it works: The indicator identifies swing highs and lows based on the strength parameter, then connects these points to create t
Oscillator The Trend Signal indicator is an indicator designed to generate trend signals. It uses its own set of algorithms and the moving average indicator to find signals. It has the feature of filtering the signals with the channel system. In this way, it tries to improve the quality of the signals. Features and Trade strategy There are two channels in the indicator. These channels are 70 and -70 channels. You will reach the signals without losing time thanks to the alarm features found on t
Offerta speciale : ALL TOOLS , solo $35 ciascuno! Nuovi strumenti   a   $30   per la   prima settimana   o per i   primi 3 acquisti !  Canale Trading Tools su MQL5 : Unisciti al mio canale MQL5 per ricevere le ultime novità Zero Lag Liquidity traccia zone di liquidità dai profili delle ombre su timeframe inferiori e da ombre ad alto volume. Per ogni candela anomala, l’indicatore costruisce un istogramma dei volumi all’interno dell’ombra, trova un Punto di Controllo (POC) locale e rappresenta qu
Gli utenti di questo prodotto hanno anche acquistato
Gann Made Easy
Oleg Rodin
4.83 (162)
Gann Made Easy è un sistema di trading Forex professionale e facile da usare che si basa sui migliori principi del trading utilizzando la teoria di mr. WD Gann. L'indicatore fornisce segnali ACQUISTA e VENDI accurati, inclusi i livelli di Stop Loss e Take Profit. Puoi fare trading anche in movimento utilizzando le notifiche PUSH. CONTATTAMI DOPO L'ACQUISTO PER RICEVERE GRATUITAMENTE LE ISTRUZIONI DI TRADING E OTTIMI INDICATORI EXTRA! Probabilmente hai già sentito parlare molte volte dei metodi d
The Propfolio Master Suite is the ultimate all-in-one analytical workstation for professional traders. Combining the power of the Beat The Market Maker (BTMM) methodology, Smart Money Concepts (SND/Liquidity), and Advanced Volume Profile, this suite replaces multiple different indicators with one optimized engine. Monitor up to 14 pairs simultaneously from a single chart, instantly identify market cycles, and seamlessly map institutional footprints with the click of a button. The Command Center
Scalper Inside PRO
Alexey Minkov
4.74 (69)
Scalper Inside PRO Scalper Inside PRO is an intraday trend and scalping indicator for MetaTrader 4 that uses an exclusive algorithm to quickly detect market direction and key target levels. It automatically calculates entry, exit and multiple profit targets, and shows detailed performance statistics so you can see how different instruments and strategies performed. This helps you choose the most suitable trading instruments for the current market conditions. Additionally, you can easily integrat
PZ Harmonacci Patterns
PZ TRADING SLU
3.17 (6)
Trade smarter, not harder: Empower your trading with Harmonacci Patterns This is arguably the most complete harmonic price formation auto-recognition indicator you can find for the MetaTrader Platform. It detects 19 different patterns, takes fibonacci projections as seriously as you do, displays the Potential Reversal Zone (PRZ) and finds suitable stop-loss and take-profit levels. [ Installation Guide | Update Guide | Troubleshooting | FAQ | All Products  ] It detects 19 different harmonic pric
M1 Sniper
Oleg Rodin
5 (23)
M1 SNIPER è un sistema di indicatori di trading facile da usare. Si tratta di un indicatore a freccia progettato per l'intervallo temporale M1. L'indicatore può essere utilizzato come sistema autonomo per lo scalping sull'intervallo temporale M1 e come parte del tuo sistema di trading esistente. Sebbene questo sistema di trading sia stato progettato specificamente per il trading sull'intervallo temporale M1, può comunque essere utilizzato anche con altri intervalli temporali. Inizialmente ho pro
Auto Optimized Parabolic RSI: Motore di Momentum 3D Avanzato La maggior parte degli indicatori per trader privati fallisce perché si affida a parametri statici che smettono di funzionare nel momento in cui la volatilità del mercato cambia. Auto Optimized Parabolic RSI risolve il problema dell'"obsolescenza dell'indicatore" ricalcolando continuamente il proprio vantaggio matematico, portando un adattamento quantitativo di livello istituzionale direttamente sul tuo terminale MT5. Il Vantaggio Prin
PRO Renko System
Oleg Rodin
5 (30)
PRO Renko System è un sistema di trading altamente accurato appositamente progettato per il trading di grafici RENKO. Questo è un sistema universale che può essere applicato a vari strumenti di trading. Il sistema neutralizza efficacemente il cosiddetto rumore di mercato che consente di accedere a segnali di inversione accurati. L'indicatore è molto facile da usare e ha un solo parametro responsabile della generazione del segnale. Puoi facilmente adattare lo strumento a qualsiasi strumento di
NAM Order Blocks
NAM TECH GROUP, CORP.
3.67 (3)
MT4 Multi-timeframe Order Blocks detection indicator. Features - Fully customizable on chart control panel, provides complete interaction. - Hide and show control panel wherever you want. - Detect OBs on multiple timeframes. - Select OBs quantity to display. - Different OBs user interface. - Different filters on OBs. - OB proximity alert. - ADR High and Low lines. - Notification service (Screen alerts | Push notifications). Summary Order block is a market behavior that indicates order collection
Quants HL Break
Ferhat Mutlu
5 (2)
Calcolo avanzato fatto da pura azione sui prezzi per trovare breakout LH e HL. Ti darà un grande punto di inversione nel mercato.I segnali LH e HL possono essere utilizzati anche per i breakout di traingle. Una volta che si verifica un breakout, indica una forte inversione.Bel filtro per le medie mobili.Consiglio vivamente di usarlo con gli indicatori di tendenza. Può essere utilizzato come ulteriore conferma per supporto e resistenza, indicatori della domanda di offerta. Maggiori dettagli po
Dynamic Forex28 Navigator
Bernhard Schweigert
4.43 (7)
Dynamic Forex28 Navigator - Lo strumento di trading Forex di nuova generazione. ATTUALMENTE SCONTATO DEL 49%. Dynamic Forex28 Navigator è l'evoluzione dei nostri indicatori popolari di lunga data, che combinano la potenza di tre in uno: Advanced Currency Strength28 Indicator (695 recensioni) + Advanced Currency IMPULSE con ALERT (520 recensioni) + CS28 Combo Signals (Bonus). Dettagli sull'indicatore https://www.mql5.com/en/blogs/post/758844 Cosa offre l'indicatore di forza di nuova generazione?
RFI levels PRO
Roman Podpora
5 (1)
L'indicatore mostra accuratamente i punti di inversione e le zone di ritorno dei prezzi in cui il       Principali attori   . Vedi dove si formano le nuove tendenze e prendi decisioni con la massima precisione, mantenendo il controllo su ogni operazione. VERSION MT5     -     Rivela il suo massimo potenziale se combinato con l'indicatore   TREND LINES PRO Cosa mostra l'indicatore: Strutture di inversione e livelli di inversione con attivazione all'inizio di un nuovo trend. Visualizzazione dei l
Apollo SR Master è un indicatore di Supporto/Resistenza con caratteristiche speciali che rendono il trading con le zone di Supporto/Resistenza più semplice e affidabile. L'indicatore calcola le zone di Supporto/Resistenza in tempo reale senza alcun ritardo, rilevando i massimi e i minimi dei prezzi locali. Quindi, per confermare la nuova area SR formata, l'indicatore mostra un segnale speciale che segnala che la zona SR può essere presa in considerazione e utilizzata come un vero e proprio segna
Se acquisti questo indicatore, riceverai il mio Trade Manager Professionale   + EA  GRATUITAMENTE. Innanzitutto è importante sottolineare che questo sistema di trading è un indicatore Non-Repainting, Non-Redrawing e Non-Lagging, il che lo rende ideale sia per il trading manuale che per quello automatico. Corso online, manuale e download di preset. Il "Sistema di Trading Smart Trend MT5" è una soluzione completa pensata sia per i trader principianti che per quelli esperti. Combina oltre 10 indic
CRT Candle Range Theory HTF MT4.   Ultimate CRT Indicator: Advanced ICT Concepts and Malaysian SnR Trading System Discounted   Price   $50  !!     Secure your lifetime access   now   before it switches to   subscription-only ! Master the Market Maker's Footprints with the Most Advanced Candle Range Theory Indicator Unlock the true power of   Smart Money Concepts (SMC)   and trade precisely like the institutions with the   Ultimate CRT Indicator . Built exclusively for serious traders, this indic
ATTUALMENTE SCONTATO DEL 40% La soluzione migliore per ogni principiante o trader esperto! Questo indicatore è uno strumento di trading unico, di alta qualità e conveniente perché abbiamo incorporato una serie di caratteristiche proprietarie e una nuova formula. Con un solo grafico è possibile leggere la forza delle valute per 28 coppie Forex! Immaginate come migliorerà il vostro trading perché sarete in grado di individuare l'esatto punto di innesco di una nuova tendenza o di un'opportunità
Segnale GoldRush Trend Arrow L'indicatore GoldRush Trend Arrow Signal fornisce un'analisi precisa e in tempo reale dei trend, pensata appositamente per gli scalper ad alta velocità e a breve termine nel mercato XAU/USD. Progettato specificamente per il timeframe di 1 minuto, questo strumento mostra frecce direzionali che indicano chiari punti di ingresso, consentendo agli scalper di navigare con sicurezza nelle condizioni di mercato volatili. L'indicatore è composto da frecce di avviso PRIMA
Market Structure Patterns MT4
Samuel Manoel De Souza
5 (18)
Market Structure Patterns   è un indicatore basato sui   Smart Money Concepts   che mostra gli   elementi SMC/ICT   che possono portare le tue decisioni di trading a un livello superiore. Approfitta di   alert ,   notifiche push   e   email   per essere avvisato quando si forma un elemento sul grafico, il prezzo supera un livello e/o entra in una zona. Gli sviluppatori possono accedere ai valori degli elementi dell’indicatore utilizzando le   variabili globali , consentendo l’automazione delle d
Advanced Supply Demand
Bernhard Schweigert
4.91 (300)
Speciale Trading- SCONTO DEL 40% La soluzione migliore per qualsiasi trader principiante o esperto! Questo indicatore è uno strumento di trading unico, di alta qualità e conveniente, perché abbiamo incorporato una serie di funzionalità proprietarie e una nuova formula. Con questo aggiornamento, potrai visualizzare doppie zone di timeframe. Non solo potrai visualizzare un TF più alto, ma anche entrambi, il TF del grafico e il TF più alto: MOSTRA ZONE ANNIDATE. Tutti i trader che operano con Of
PZ Turning Points MT4
PZ TRADING SLU
1 (1)
Identify key turning points with reliable fractal analysis This indicator examines the price structure of fractals of different periods to determine possible reversal points in the market, providing timing to positional traders that already have a fundamental or technical valuation model. Unlike its younger brother, Reversal Fractals , this indicator won't miss reversals because of the period selected, and will find reversal fractals on a zig-zag fashion, ignoring those reversals which do not
L'indicatore " Dynamic Scalper System " è progettato per il metodo di scalping, ovvero per il trading all'interno di onde di trend. Testato sulle principali coppie di valute e sull'oro, è compatibile con altri strumenti di trading. Fornisce segnali per l'apertura di posizioni a breve termine lungo il trend, con ulteriore supporto al movimento dei prezzi. Il principio dell'indicatore. Le frecce grandi determinano la direzione del trend. Un algoritmo per generare segnali per lo scalping sotto fo
Se fai trading nel Forex, avere informazioni dettagliate sulla forza delle valute e sulla correlazione tra coppie di valute può portare il tuo trading a un livello superiore. La correlazione ti aiuterà a dimezzare il rischio, mentre l'analisi della forza ti permetterà di massimizzare i profitti. Questo indicatore offre un approccio ibrido per selezionare le coppie di valute più appropriate, combinando l'analisi della forza delle valute e la correlazione tra coppie di valute. Come utilizzare l'a
Trend Catcher ind
Ramil Minniakhmetov
INDICATORE TREND CATCHER L'indicatore Trend Catcher analizza i movimenti dei prezzi di mercato, utilizzando una combinazione di indicatori di analisi del trend proprietari dell'autore e personalizzati. Identifica la vera direzione del mercato filtrando il rumore a breve termine e concentrandosi sulla forza del momentum sottostante, sull'espansione della volatilità e sul comportamento della struttura dei prezzi. Utilizza inoltre una combinazione di indicatori personalizzati di smoothing e filtr
ATTUALMENTE SCONTATO DEL 26%!! Questo indicatore è una super combinazione di entrambi i nostri indicatori principali ( Advanced Currency Strength 28   &  Advanced Currency IMPULSE with ALERT  ). Mostra i valori di forza della valuta per unità di TICK e segnali di allerta per 28 coppie Forex. È possibile utilizzare 11 diverse unità di Tick. Si tratta di 1, 2, 3, 4, 5, 6, 10, 12, 15, 20 e 30 secondi. La barra dell'unità di tick nella finestra secondaria verrà mostrata e spostata a sinistra quand
Day Trader Master è un sistema di trading completo per i day trader. Le systeme se compose de due indicatori. Un indicar est un signal fléché pour acheter et vendre. C'est l'indicateur de fleche que vous obtenez. Je vous fournirai le deuxième indicaur gratuitement. Le deuxième indicaur è un indicaur de tendance spécialement conçu pour être utilisé conjointement avec ces flèches. GLI INDICATORI NON SI RIPETONO E NON RITARDANO! Usare questo sistema è molto semplice. Devi solo seguire i segnali del
KURAMA GOLD SIGNAL PRO (MT4) — Sistema di Trading XAUUSD Completo con Filtro a 7 Strati, TP/SL Automatico e Punteggio di Qualità NESSUN REPAINT. NESSUN RIDISEGNO. NESSUN RITARDO. Ogni segnale è permanente. Ciò che vedi è ciò che ottieni. BONUS: Acquista la licenza a vita e ricevi AI Zone Radar (valore $59) + manuale PDF completo GRATIS. Inviami un messaggio dopo l'acquisto. AI Zone Radar: https://www.mql5.com/en/market/product/175834 FIDUCIA DEI TRADER: Già utilizzato da una community attiva
Master head and shoulders patterns for better trading decisions A head and shoulders pattern is a chart formation that resembles a baseline with three peaks, the outside two are close in height and the middle is highest. It predicts a bullish-to-bearish trend reversal and is believed to be one of the most reliable trend reversal patterns. It is one of several top patterns that signal, with varying degrees of accuracy, that a trend is nearing its end. [ Installation Guide | Update Guide | Trouble
PZ Double Top Bottom
PZ TRADING SLU
5 (1)
Trade double tops and bottoms effectively The PZ Double Top/Bottom Indicator is a technical analysis tool that helps traders identify potential price reversal patterns in the market. These patterns, known as double tops and bottoms, are characterized by two consecutive peaks or valleys in the price of an asset. Double tops and bottoms are often seen as potential reversal patterns because they can signal a change in the direction of the current trend. [ Installation Guide | Update Guide | Troubl
Gold Scalper Super
Aleksandr Makarov
5 (2)
Gold Scalper Super is an easy-to-use trading system. The indicator can be used as a standalone scalping system on the M1 time frame, as well as part of your existing trading system. Bonus: when purchasing an indicator, Trend Arrow Super is provided free of charge, write to us after purchase. The indicator 100% does not repaint!!! If a signal appears, it does not disappear! Unlike indicators with redrawing, which lead to the loss of a deposit, because they can show a signal and then remove it.
Un indicatore tecnico che struttura i grafici e identifica i movimenti ciclici dei prezzi. Può funzionare su qualsiasi grafico. Diversi tipi di notifiche. Ci sono altre frecce sul grafico stesso. Senza ridisegnare la storia, lavora sulla chiusura della candela. TF consigliati da M5 in su. Parametri facili da usare e configurare. Se si utilizzano 2 indicatori con parametri diversi, è possibile utilizzarli senza altri indicatori. Ha 2 parametri di input Ciclicità e durata del segnale Questi 2 pa
KuKl
IGOR KIRIANEN
The indicator is built on a non-standard Zig Zag, it draws accumulations after which if the price leaves this zone and a test of this zone occurs, then a sound signal is given and an arrow appears - after the test candle closes.The indicator does not redraw its signals, it is very easy to use, there are only three settings 1- this is the zig zag parameter 2- this is the minimum price exit from the zone 3- this is the maximum price exit from the zone. The lower the parameter for Zig Zag, the more
Altri dall’autore
Stochastic RainBow 5
Kourosh Hossein Davallou
3 (1)
A   stochastic   oscillator is a momentum indicator comparing a particular closing price of a security to a range of its prices over a certain period of time. The sensitivity of the oscillator to market movements is reducible by adjusting that time period or by taking a moving average of the result. It is used to generate overbought and oversold trading signals, utilizing a 0-100 bounded range of values. This indicator  show 8 stochastic on one chart.
FREE
RenkoVPEurUsd
Kourosh Hossein Davallou
5 (1)
Of course. Here is the product description for "RenkoVP for MetaTrader 4 RenkoVP for MetaTrader 4 (EURUSD Only) RenkoVP is a powerful, fully online Renko-based indicator designed specifically for analyzing the EURUSD currency pair. It provides traders with a clean, noise-free view of market structure by combining traditional Renko bricks with advanced volume profile analysis, dynamic Fibonacci tools, and automatic pattern recognition—all without the need for problematic offline charts. Core F
FREE
RenkoVP
Kourosh Hossein Davallou
Overview RenkoVP is a professional tool for price structure analysis that runs fully online on the main chart. Unlike many other Renko indicators, it requires no offline charts. The indicator combines Renko bricks, volume profile, dynamic Fibonacci levels, and automatic pattern recognition to help traders identify trends, key zones, and precise entry/exit points. Renko Bricks Configuration The indicator offers both manual and automatic brick configuration: No offline chart required - runs direc
StochasticRainBow
Kourosh Hossein Davallou
5 (2)
A stochastic oscillator is a momentum indicator comparing a particular closing price of a security to a range of its prices over a certain period of time. The sensitivity of the oscillator to market movements is reducible by adjusting that time period or by taking a moving average of the result. It is used to generate overbought and oversold trading signals, utilizing a 0-100 bounded range of values. This indicator  show 15 stochastic on one chart.
FREE
MarketSession
Kourosh Hossein Davallou
The 24-hour forex (FX) market offers a considerable advantage for many institutional and individual traders because it guarantees liquidity and the opportunity to trade at any conceivable time. Currencies can be traded anytime but an individual trader can only monitor a position for so long, however. Most traders can't watch the market 24/7 so they're bound to miss opportunities or worse. A jump in volatility can lead to a movement against an established position when the trader isn't around. A
FREE
Price Ladder
Kourosh Hossein Davallou
This indicator is based on the Channel . Input Parameters channel_One- show trend line One on or off. timeFrame_One - time Frame of channel One . ColorChannel_One - color of  trend line One. channel_Two- show trend line Two on or off. timeFrame_Two - time Frame of channel Two . ColorChannel_Two - color of  trend line Two. channel_Three- show trend line Three on or off. timeFrame_Three - time Frame of channel Three . ColorChannel_Three - color of  trend line three. channel_Four- show trend line F
FREE
Iranian stock market
Kourosh Hossein Davallou
5 (1)
Smart money is a powerful currency. This money is available to major investors who can identify, predict or even generate capital movements ahead of others. This money can flow into financial and capital markets and create dramatic price changes in various stocks. Therefore, detecting smart cash flow, which usually enters the market in a coherent manner and confronts the volume and value of transactions in a market with high returns, is one of the methods that some investors use to invest. But h
FREE
Display Multipair
Kourosh Hossein Davallou
This is an indicator that allows displaying three currency pairs in one window. Input Parameters: Symbol1 - first currency pair. symbol1mirrior - mirror display of the first currency pair. s1color - color of the first currency pair. Symbol2 - second currency pair. symbol2mirrior - mirror display of the second currency pair. Symbol3  - third currency pair. symbol3mirrior -  mirror display of the third currency pair. Symbo4  - fourth currency pair. symbol4mirrior - mirror display of the fourth cur
Price Aleart
Kourosh Hossein Davallou
Price Alert indicator plays sound alerts when the price reaches certain levels that are set by the trader. If you use e-mail alert feature, don't forget to set the e-mail settings in your MetaTrader platform options window.   Input parameters: WhenPriceGoesAbovePIP - if the price exceeds the current one by a specified amount of Pips, the alert will be triggered. WhenPriceGoesBelowPIP - if the price goes below the current one by a specified amount of Pips, the alert will be triggered. WhenPriceIs
Wolfe Wave
Kourosh Hossein Davallou
This particular methodology. Please note the odd sequence in counting, as you will see, it is necessary for the inductive analysis. By starting with a top we are assured of beginning our count on a new wave. (The reverse would apply for a bearish wave.) The 2 point is a top. The 3 point is the bottom of the first decline. The 1 point is the bottom prior to point 2 (top), that 3 has surpassed. The 4 point is the top of the rally after point 3. The 5 point is the bottom after point 4 and is likely
Daily GBPUSD trade
Kourosh Hossein Davallou
Our strategy relies on a choppy movement on most Forex pairs during the Asian session. Most traders in London sleep when the Sun shines over the Pacific and this results to a very slow movement of GBPUSD pair between 9:00 PM GMT and 7:00 AM GMT. Buy order: Place a buy-stop order just five  pip above the upper band. Place a stop loss just one pip below the lower band. Place a profit target at the upper LawnGreen Arrow. Sell order: Place a sell-stop order just five pip below the lower band. Place
Breakout trade
Kourosh Hossein Davallou
Breakout System  This indicator is based on the trend line and breakthrough. Pair: EURUSD, GBPUSD. Timeframe: M15 Or H1. Input Parameters AlertsOn - alert on or off. TrendLine - show trend line. TrendLineStyle - style of trend line. UpTrendColor - color of up trend. DownTrendColor - color of down trend. ShowTakeprofit - show take profits. ShowTakeprofitStyle - style of take profit. UpperTakeprofitColor - color of up take profit. LowerTakeprofitColor - color of down take profit.
Week Pivot
Kourosh Hossein Davallou
Weekly Pivot  There are a lot of advantages when trading with support and resistance lines, and they should be a staple in every trader's arsenal. Another effective method of deriving multiple horizontal based support and resistance lines is using a formula derived from yesterday's High, Low and Close bar. The formula maps out pivot point levels consisting of the pivot, and three levels of support and resistance, and these levels can be traded much the same way as trading with the regular suppor
Forex Tools X
Kourosh Hossein Davallou
The indicator is based on several useful indicators in the multi time frames that help us chart and table and alert.   The various parameters used in this indicator and the default ones are as follows. ·    Moving Average Mode:    LMMA ·        Moving Average Period One:     4 ·        Moving Average Period Two:     8 ·        Moving Average Period Three:  15 ·        Moving Average Period Four:    30 ·        Moving Average Period Five:     80 ·        Moving Average Period Six:      150 ·    
Only NonFarm Payroll Trade 4
Kourosh Hossein Davallou
Only NonFarm Payroll Trade  The employment situation is a set of labor market indicators. The unemployment rate measures the number of unemployed as a percentage of the labor force. Non-farm payroll employment counts the number of paid employees working part-time or full-time in the nation's business and government establishments. The average workweek reflects the number of hours worked in the non-farm sector. Average hourly earnings reveal the basic hourly rate for major industries as indicated
Daily GBP expert
Kourosh Hossein Davallou
Daily GBPUSD trade  Our strategy relies on a choppy movement on most Forex pairs during the Asian session. Most traders in London sleep when the Sun shines over the Pacific and this results to a very slow movement of GBPUSD pair between 9:00 PM GMT and 7:00 AM GMT. Input Parameters: Auto GMT shift extern int Broker_GMT_Shift = 0;//Manual Broker GMT shift extern int London_Night = 21; //London Night extern int London_Open = 7; //London Open
CurrencyMeter
Kourosh Hossein Davallou
Currency Meter   When trading Forex, we trade a pair of currencies at time. For example EUR/USD. If we are long on the EUR/USD it means that we expect the EUR to gain in strength relative to the USD. If we are short on the EUR/USD it means that we expect the EUR to weaken relative to the USD. You should be all familiar with this concept. The key thing about pairs though is that they just indicate the strength of one currency  relative to another. If we see the EUR/USD going up, is it because the
Three Channel
Kourosh Hossein Davallou
5 (1)
The Price Channel pattern trading strategy is one of the smartest ways to make money trading. The Price Channel pattern represents two trend lines positioned above (channel resistance) and below (channel support) the price. The price action is contained between these two parallel trendlines. The separation between the two trendlines needs to be wide enough if you want to trade inside the Price Channel Pattern. If this is the case, you can buy at the channel support level and sell at the channel
PriceActionDetector
Kourosh Hossein Davallou
Price Action translates as "price movement." Proponents of technical analysis believe that the price takes into account everything that happens on the market. Therefore, indicators and advisers are not needed, since they are calculated based on historical price data and can be very late. By the time the indicator signal triggers, the price direction may already have changed. Those indicators that are trying to predict the price direction are often redrawn. All this leads to unnecessary losses.
Visual Trading
Kourosh Hossein Davallou
With this tool you can easily draw lines on the chart and the trade is done easily. The steps are as follows: First: Draw the buy and sell lines on the chart. Second: Draw the profit and loss lines on the chart. Third: Specify the volume of the transaction you want to trade. Fourth: Activate the lines. Warning When moving lines, be careful not to make a wrong trade. Expert easily trades you. 
Multi Fair Value Gap
Kourosh Hossein Davallou
**Added to the Original Text:**   This indicator (Fair Value Gap - FVG) also **has the capability** to display **multiple timeframes** of your choice **simultaneously on a single chart**. This feature allows you to identify **stronger and more accurate signals**, as you can analyze price discrepancies (Gaps) across higher or lower timeframes, helping you make smarter trading decisions.   For example, if you spot a bullish FVG on the **1-hour timeframe** and it is also confirmed on the **4-hour
Multi OrderBlock
Kourosh Hossein Davallou
5 (1)
Order blocks are essential structures in trading that indicate areas where large institutional traders, like banks and hedge funds, have placed their orders. These blocks represent significant price levels where substantial buying or selling activity has occurred, providing clues about potential market movements. So, why should you, as a trader, care about order blocks? Well, knowing where these big orders are placed can give you a huge advantage. It’s like having a map showing where the treasur
Pattern Searching
Kourosh Hossein Davallou
Pattern Searching: Smart, Precise, & Customizable for MT4!  Are you looking for a powerful tool to quickly and accurately identify trading patterns in Forex? This advanced indicator for MetaTrader 4 (MT4) is exactly what you need!  Key Features That Will Amaze You:  Automatic Classic Pattern Detection: This indicator automatically finds the closest classic Forex patterns for you. Whether you're looking for Smart Money Concepts (SMC) or NDS strategies, this tool covers it all!   * Popular patt
Harmonic Price Patterns
Kourosh Hossein Davallou
Harmonic Price Patterns Indicator This indicator has the capability to manually display the closest harmonic pattern to you. It allows you to easily adjust its parameters and create your own custom harmonic pattern, while also displaying the price distance between each point. Key Features of the Manual Harmonic Pattern Indicator Harmonic Pattern Identification Detects popular harmonic patterns such as ABCD, Gartley, Bat, Butterfly, Crab, and Shark. Displays patterns automatically or semi-automat
MasterVolume Pro
Kourosh Hossein Davallou
Description: Elevate your chart analysis with this advanced indicator that seamlessly integrates Zigzag structures, Fibonacci retracements, and Volume Profile insights. Designed for traders who seek clarity and precision, this tool visually identifies high-probability price patterns and market turning points. Whether you're tracking CHOCH shifts, pinpointing POIs, or analyzing TRIPLE tops and FLAG formations, this indicator offers the depth and flexibility to adapt to any trading strategy.   C
RenkoPointFigure
Kourosh Hossein Davallou
Advanced Renko & Point & Figure Indicator with Win/Loss Pattern Analysis This powerful indicator combines two proven strategies—Renko and Point & Figure (P&F)—into one comprehensive tool for trend identification, pattern recognition, and risk management. With dynamic Box Size calculation (Fixed or ATR-based), moving average filters, and win/loss pattern detection, traders can make smarter, data-driven decisions. Key Features   Hybrid Renko + P&F System Renko: Noise-free price action with fixed
DualVWAP
Kourosh Hossein Davallou
Dual Timeframe VWAP Indicator for MT4  Description Professional VWAP indicator that displays both **Daily** and **Weekly** VWAP simultaneously on your chart.   Features: - Dual VWAP Lines: Blue for Daily, Red for Weekly - Configurable Bands: Two deviation bands for each timeframe - Session Control: Customizable trading hours for Daily VWAP - Clean Visuals: Solid lines for main VWAP, dashed for bands - Optimizable: Parameters can be optimized using Genetic Algorithm Key Settings: - Enable/di
On Click Trade
Kourosh Hossein Davallou
This is an Expert Advisor that allows opening and modifying positions and orders via mouse (with Stop Loss, Take Profit). Working with this Expert Advisor requires setting lot size, take profit and stop loss for positions. For pending orders you need to set lot size, take profit, stop loss and distance (pip). This Expert Advisor has only one input parameter - background color.
Moving Average RAINBOW
Kourosh Hossein Davallou
Moving Average RAINBOW Forex traders use moving averages for different reasons. Some use them as their primary analytical tool, while others simply use them as a confidence builder to back up their investment decisions. In this section, we'll present a few different types of strategies - incorporating them into your trading style is up to you! A technique used in technical analysis to identify changing trends. It is created by placing a large number of moving averages onto the same chart. When a
Three Channel 5
Kourosh Hossein Davallou
The Price Channel pattern trading strategy is one of the smartest ways to make money trading. The Price Channel pattern represents two trend lines positioned above (channel resistance) and below (channel support) the price. The price action is contained between these two parallel trendlines. The separation between the two trendlines needs to be wide enough if you want to trade inside the Price Channel Pattern. If this is the case, you can buy at the channel support level and sell at the channel
Filtro:
Frank Paetsch
7501
Frank Paetsch 2020.09.11 14:59 
 

good indicator. Thank you

Rispondi alla recensione