Linear Regression Forecaster
- Indicatori
- Versione: 1.2
- Aggiornato: 8 novembre 2025

1. Indicator Purpose and Inputs
Overview
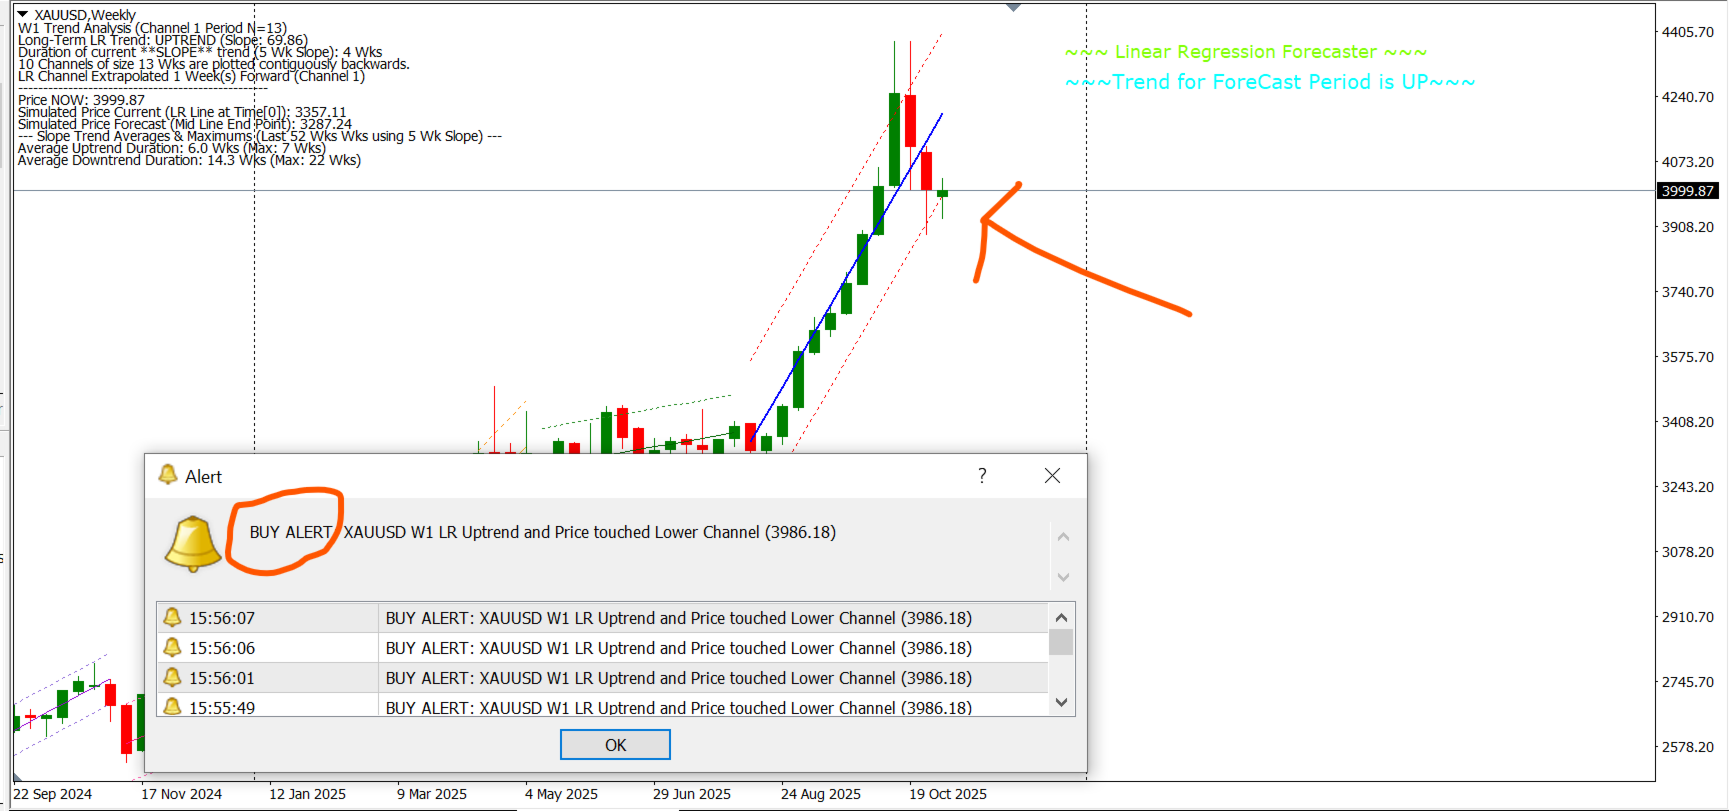
The Linear Regression Forecaster is an advanced analytical indicator designed to perform comprehensive trend evaluation and short-term price forecasting using the Linear Regression (LR) statistical method.
It is optimized for the Weekly (W1) timeframe and combines both long-term trend analysis and short-term rolling trend dynamics to generate reliable weekly forecasts.
The indicator operates using two distinct timeframes:
- Long-Term Period (e.g., 52 weeks): defines the main regression channel and overall market bias.
- Short-Term Rolling Window (default 5 weeks): evaluates the ongoing trend’s persistence and duration.
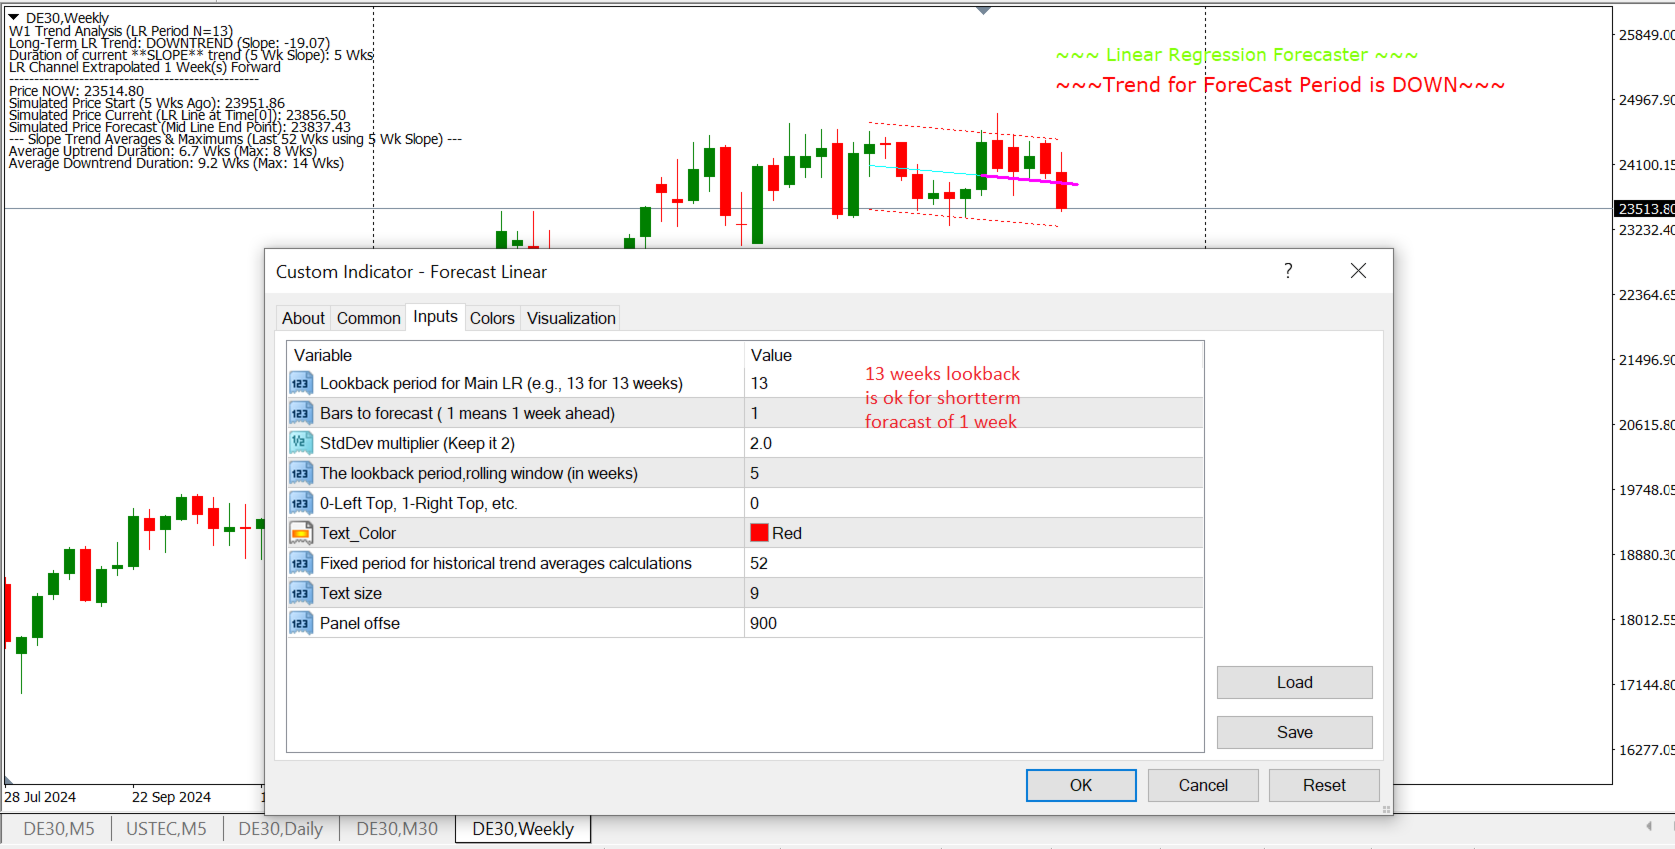
Key Input Parameters
| Input Variable | Default Value | Description / Purpose |
| Main LR Lookback Period | 52 weeks | Defines the number of weekly bars used for the main linear regression line. A 52-week window corresponds to approximately one year of market data, providing a stable, long-term view of the trend. |
| Recommended Alternative Lookbacks | — | • Short-Term Trend: 13 Weeks → represents one fiscal quarter (3 months). Highly responsive to recent momentum and suitable for forecasting the upcoming week. |
| Bars to Forecast | 1 | Number of future bars (weeks) for which the regression line is extrapolated. A value of 1 projects next week’s expected price. |
| Standard Deviation Multiplier | 2.0 | Sets the width of the upper and lower channel bands. A value of 2.0 implies that approximately 95% of historical price activity is captured within the channel. |
| Rolling Window (for short-term slope) | 5 weeks | Defines the rolling window size used to calculate short-term slopes and assess the current trend’s persistence. This rolling recalculation adapts weekly as new data arrives. |
| Fixed Historical Period (for averages) | 52 weeks | Defines the total lookback window used for computing average and maximum durations of past uptrends and downtrends, based on the short-term rolling slope logic. |
2. Trend Analysis Panel Explanation
The indicator displays an on-chart Trend Analysis Panel, summarizing key insights derived from both the long-term regression and short-term rolling slope computations.
| Label | Explanation |
| W1 Trend Analysis (LR Period N=52) | Header confirming analysis on the Weekly timeframe using 52 bars of regression data. |
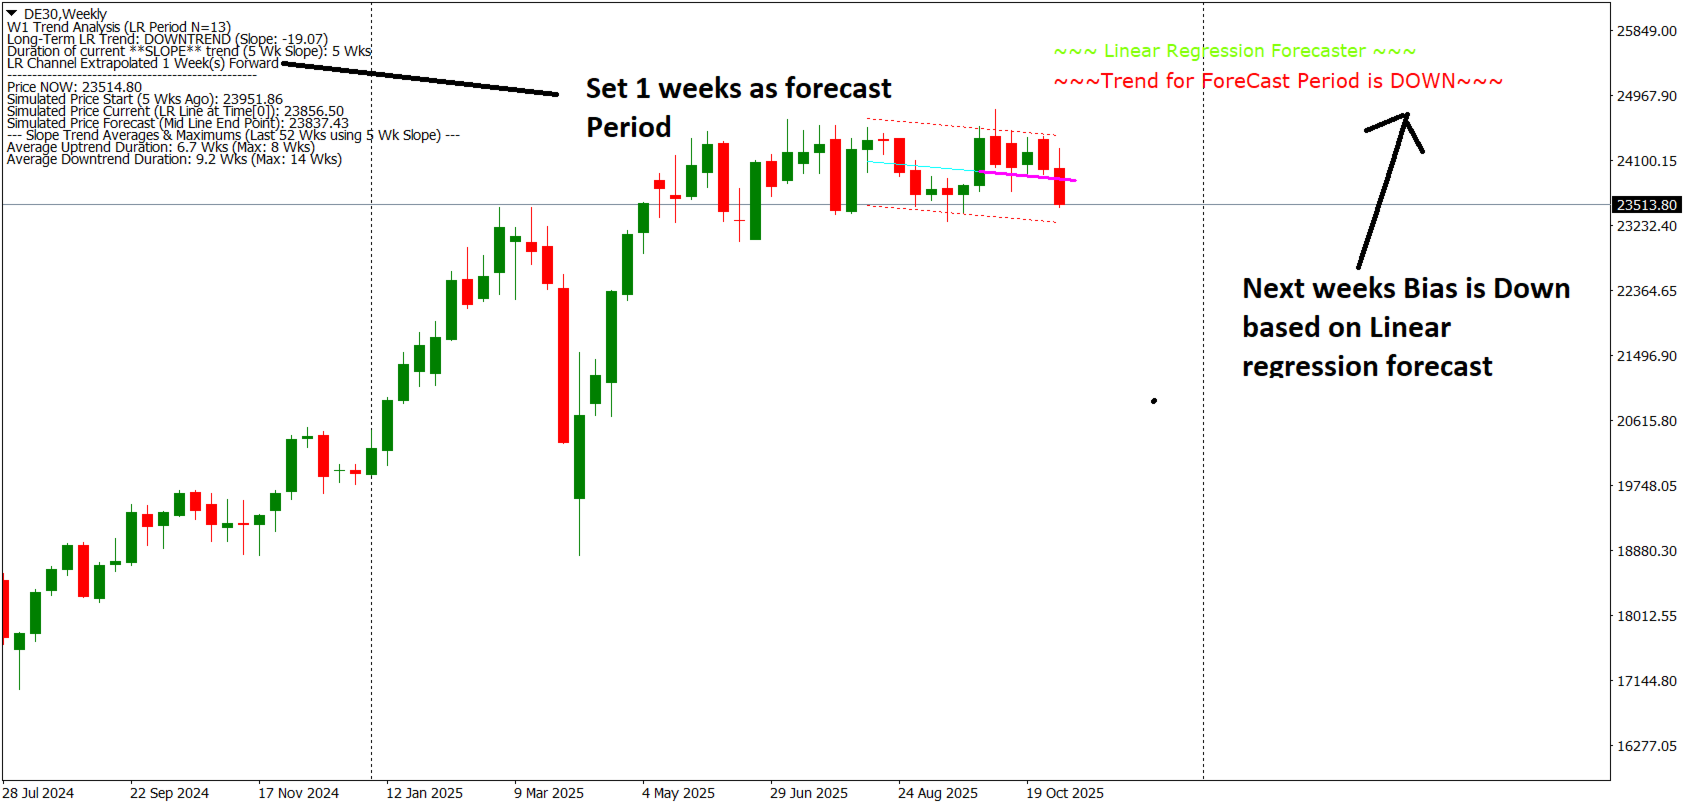
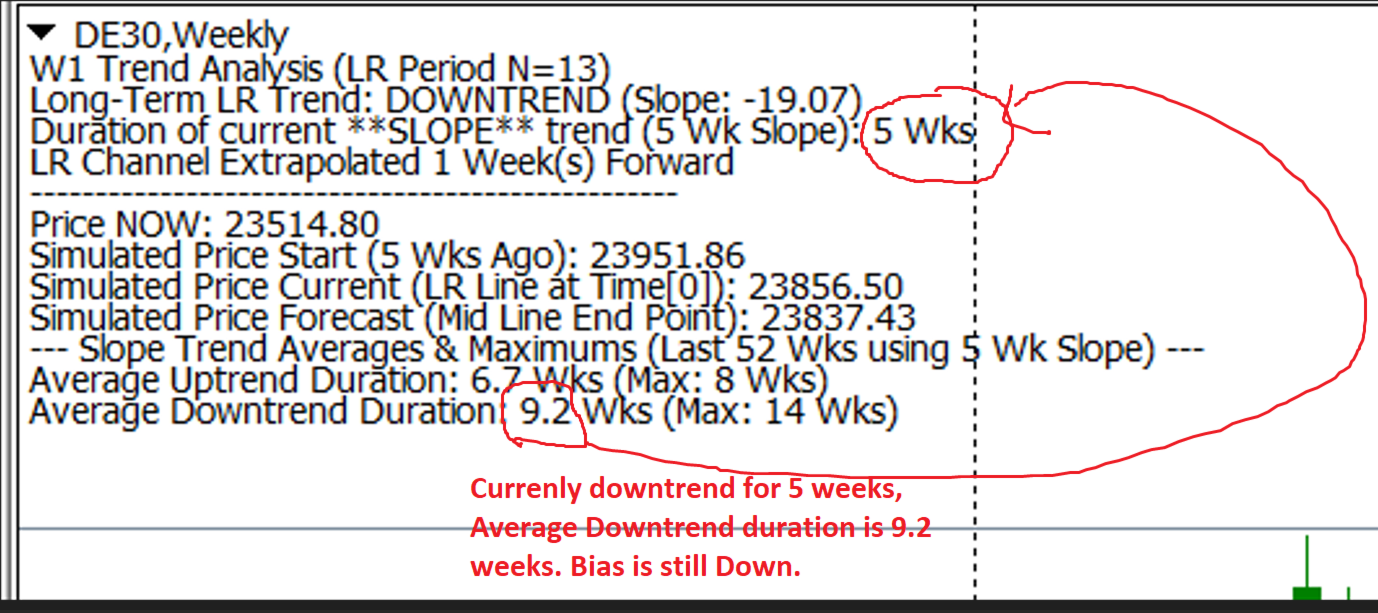
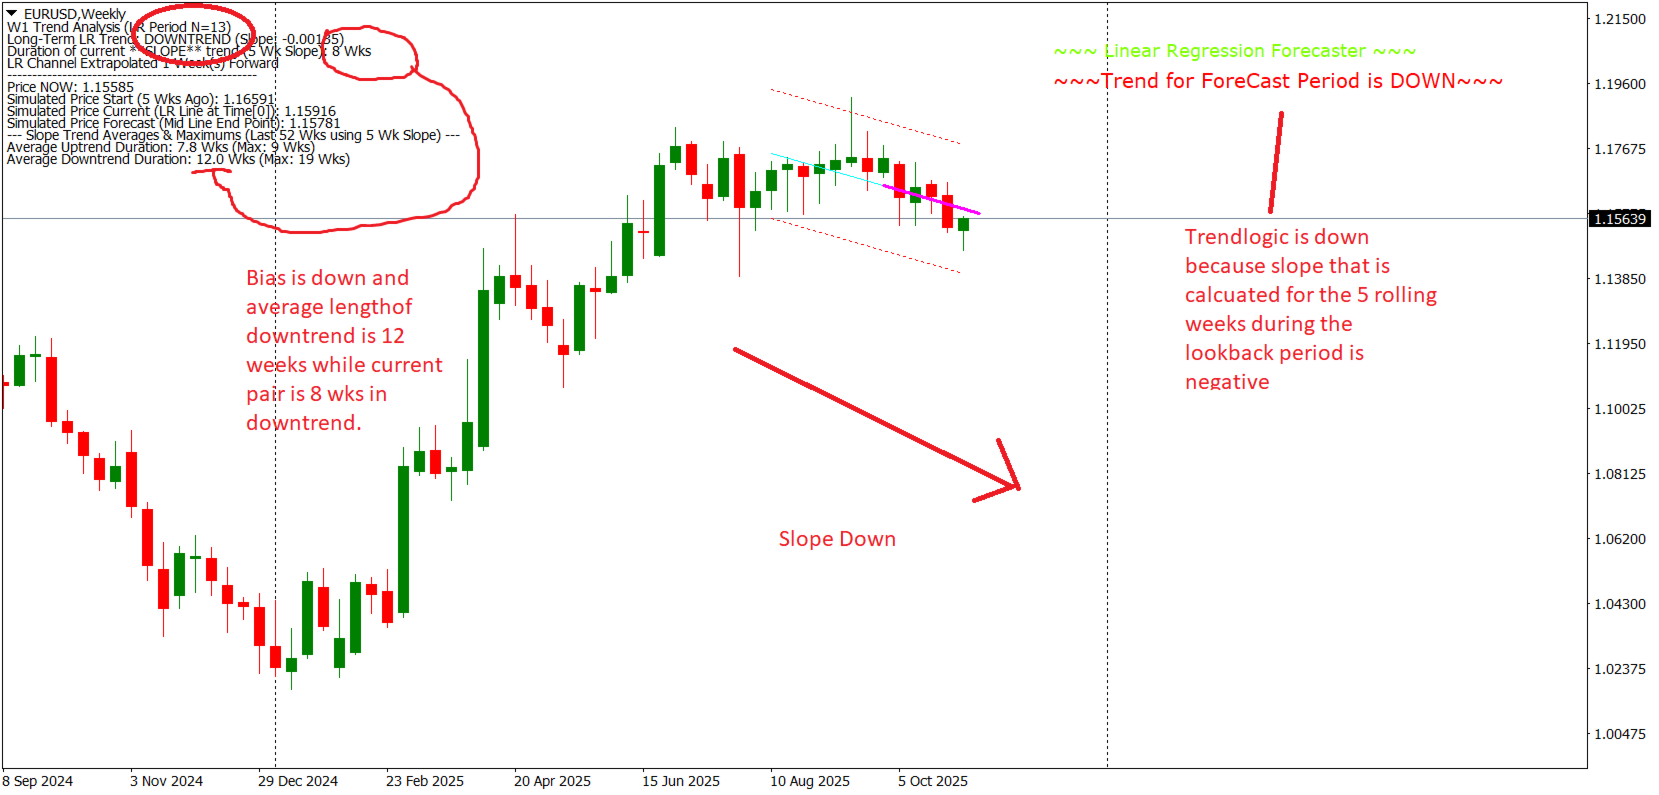
| Long-Term LR Trend: UPTREND / DOWNTREND | Indicates the overall direction of the 52-week regression line, derived from the sign of its slope (β). |
| Duration of Current Slope Trend (5-Week Rolling Window): 10 Weeks | Displays the number of consecutive weeks where the 5-week rolling slope maintained the same direction (up or down), indicating short-term trend strength. |
| LR Channel Extrapolated 1 Week Forward | Confirms that the regression line has been extended one bar into the future based on the Bars to Forecast input. |
| Price Now: [Current Close Price] | Displays the most recent weekly closing price. |
| Simulated Price Forecast (Mid-Line Endpoint): [Forecast Price] | Shows the projected price at the central regression line, extrapolated Bars to Forecast (e.g., 1 week) ahead. Formula: y = α + βx. |
| Average Uptrend/Downtrend Duration: | The mean duration (in weeks) of uptrend and downtrend periods observed over the last 52 weeks, calculated via the short-term 5-week rolling slope method. |
| Max Uptrend/Downtrend Duration: | The longest continuous uptrend/downtrend duration detected within the same 52-week historical window. |
3. Slope and Forecast Calculation Logic
The indicator employs the Least Squares Method to determine the best-fit regression line for the selected period.
However, to identify trend persistence, it uses a rolling window slope analysis rather than a single long-term slope.
Rolling Slope Logic
- Identify Current Trend Direction
- Compute the regression slope for the most recent 5-week rolling window.
- Determine if the slope is positive (uptrend) or negative (downtrend).
- Iterative Backward Check
- Move one bar backward at a time, recalculating the 5-week rolling slope for each window.
- Continue until a slope is found that reverses direction relative to the current slope.
- Stop Condition
- When the direction of the rolling slope changes (from up to down or vice versa), the counting process stops.
- Final Computation
- The number of consecutive matching slope directions is returned as Trend_Duration_Weeks.
- This represents the length of the current unbroken short-term trend (momentum duration).
Summary
- The main regression (52-week) defines the overall market direction and price channel.
- The rolling 5-week regression dynamically tracks the short-term slope and trend persistence.
- Together, they form a balanced model — the long-term LR provides trend context, while the short-term rolling slope captures evolving momentum for next-week forecasting.
- It is not recommended for timeframes smaller than 1 week. Use it a trend identifier not as target or entry trigger.
Added alerts for the current channel:
The indicator uses the Weekly (W1) Linear Regression Channel's trend and boundaries but checks the live price on every tick to generate real-time signals.
| Trend Condition | Alert Trigger (Signal) | Alert Action |
| Uptrend (Slope > 0) | The live price drops and is within the ALERT_PROXIMITY_POINTS of the Lower Channel Line (or has touched/crossed it). | BUY PROXIMITY ALERT: Signals a pull-back to dynamic support, indicating a potential long entry. |
| Downtrend (Slope < 0) | The live price rises and is within the ALERT_PROXIMITY_POINTS of the Upper Channel Line (or has touched/crossed it). | SELL PROXIMITY ALERT: Signals a rally to dynamic resistance, indicating a potential short entry. |