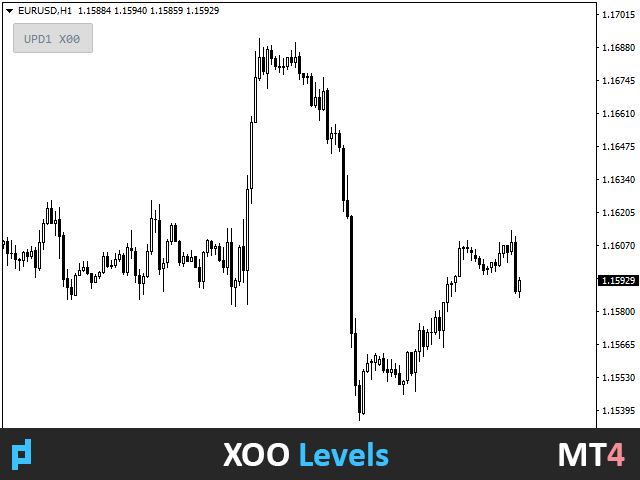
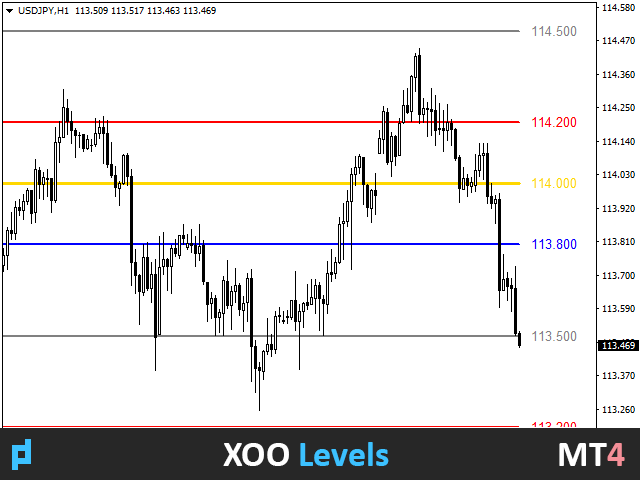
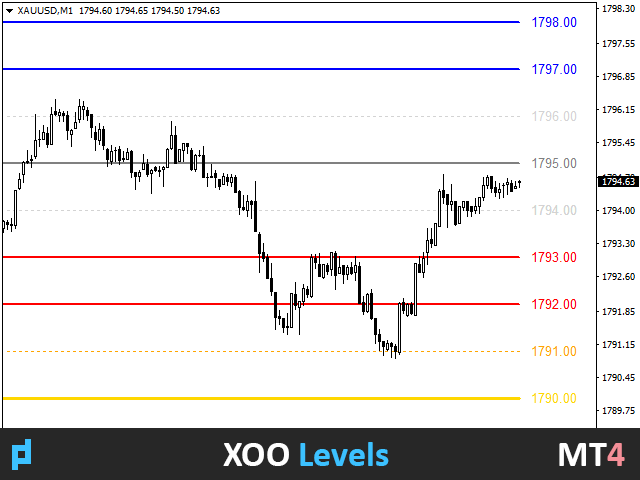
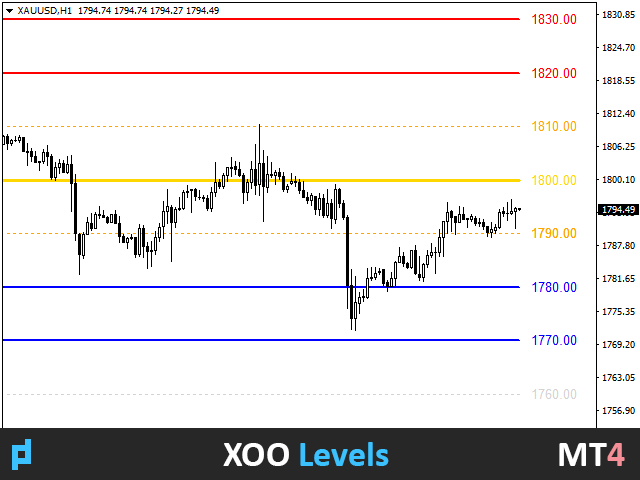
UPD1 X00 Levels
- Indicatori
-
Vitaliy Kuznetsov
 UPD1 MT4 Indicators - https://www.mql5.com/en/market/mt4/indicator?filter=UPD1
Levels
Patterns
Volume
Money Management - Versione: 2.71
- Aggiornato: 1 gennaio 2025
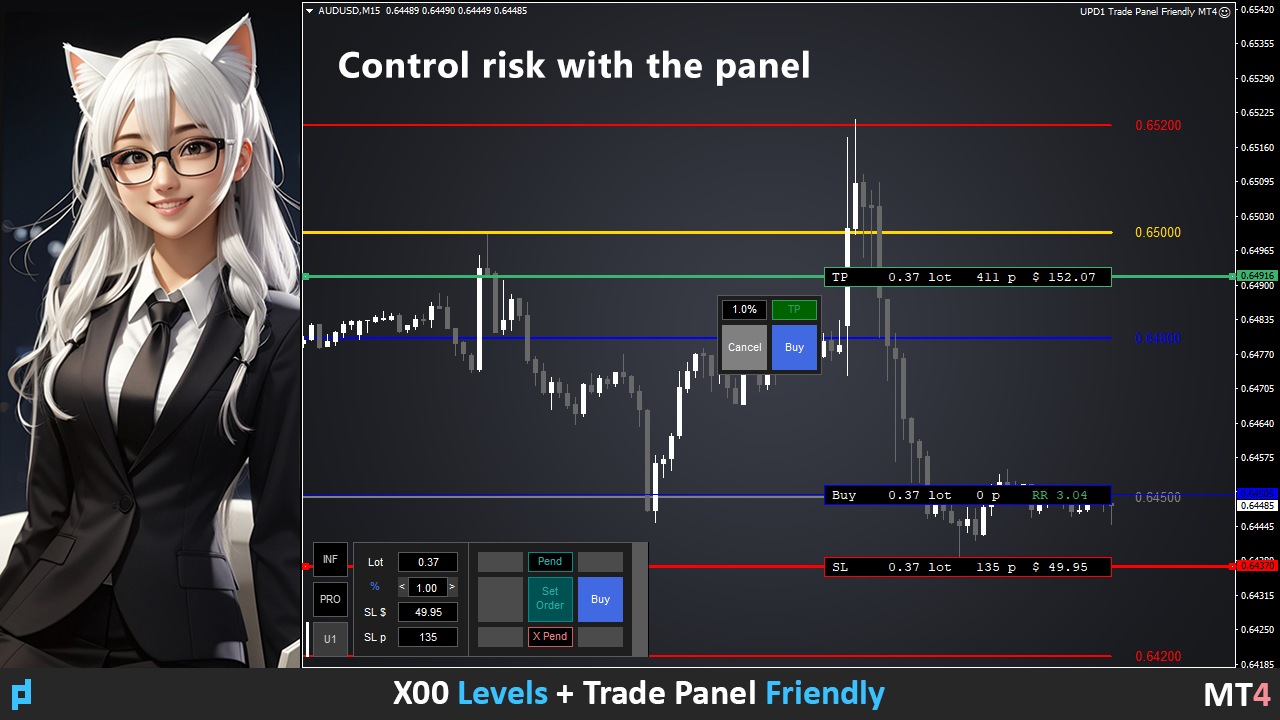
L'indicatore mostra livelli circolari sul grafico.
Sono anche chiamati livelli psicologici, bancari o dei principali operatori.
A questi livelli si verifica una vera e propria lotta tra tori e orsi, l'accumulo di molti ordini, che porta a un aumento della volatilità.
L'indicatore si adatta automaticamente a qualsiasi strumento e timeframe.
Se il livello 80 viene rotto e poi testato, acquistare. Se il livello 20 viene rotto e poi testato, vendere. L'obiettivo è 00.
Attenzione. A causa dei forti livelli di supporto e resistenza, il prezzo potrebbe non raggiungere il livello 00.
Parametri di ingresso.
Bars Count - lunghezza delle righe.
Show 00 Levels - per visualizzare o meno i livelli 00.
Show 10, 90 Levels.
Show 20, 80 Levels.
Show 30, 70 Levels.
Show 40, 60 Levels.
Show 50 Levels.
N Lines - parametro che limita il numero di livelli sul grafico.
Distance 00 Levels - distanza tra i livelli (automaticamente o manualmente).
Line Position - linee davanti o dietro il grafico.
Visual Button - visualizzazione dei pulsanti (on/off).
Corner - angolo di attacco del pulsante.
X indent - rientro orizzontale in pixel.
Y indent - rientro verticale in pixel.
Label Visual - visualizza la didascalia del livello con i numeri.
Label Font Size - dimensione del carattere.
Label Shift Bars - rientro della didascalia in barre.
Label Tooltip - visualizza la scritta sotto il cursore sopra il livello.
Label Name - etichetta completa o breve del livello.
Levels Style - stile di disegno delle linee.
Levels Width - larghezza.
Levels Color - colore.
Alert - abilita/disabilita l'avviso.
Alert Work Time - tempo di lavoro dell'avviso 00:00-23:59 (modificabile).
Alert Pop Up - finestra a comparsa.
Alert Push - avviso nell'applicazione.
Alert Email - notifica per posta elettronica.
Alert Sound - abilita o disabilita il suono.
Alert Sound Name - il file audio.
Object ID - prefisso al nome dell'oggetto.


its good, works perfectly, very clean and well designed, maybe needs option to put lines on right side of current bar, but this one not buggy like some